


Serviços Personalizados
Journal
Artigo
 texto em
  Inglês (pdf)
 Artigo em XML
 Referências do artigo
 Enviar este artigo por email
Indicadores
-
 Citado por SciELO
 -
 Acessos
Links relacionados
-
 Similares em
SciELO
Similares em
SciELO
Compartilhar

 Permalink
Agricultura, sociedad y desarrollo
versão impressa ISSN 1870-5472
agric. soc. desarro vol.16 no.1 Texcoco Jan./Mar. 2019
Articles
Agricultural development and productivity in Latin America: the problem of measurement
1 Universidad de Alcalá (daniel.sotelsek@gmail.com, llabordacastillo@gmail.com)
The growth of agricultural productivity can have consequences that are not trivial at all at the time of improving subsistence consumption and increasing the income from this sector of the economy. For authors like Fulginiti and Perrin (1998) or Nin et al. (2003), it is possible that both the methods and the data used until now have interpreted erroneously the productivity of agriculture in some countries, biasing their measurements. This is precisely the aim of this study and to achieve it, the methodological development carried out by O’Donnell (2008) will be used, to attempt to solve the problems previously mentioned and to contrast them with the results from traditional non-parametric methodologies. Through Lowe transitive indices, the change in Total Factor Productivity (TFP) is estimated, in this case of agriculture in some countries of Latin America for the period of 1990-2006. The results obtained questioned the empirical evidence obtained in preceding studies. Finally, the hypothesis is confirmed about differences in results of productivity, when it is estimated through the contest of the Malmquist index and Lowe indices.
Key words: technical change; economies of scale; technical efficiency; Lowe and Malmquist indices; Total Factor Productivity (TFP)
El crecimiento de la productividad agrícola puede tener consecuencias nada triviales a la hora de mejorar el consumo de subsistencia y de elevar los ingresos procedentes de este sector de la economía. Para autores como Fulginiti y Perrin (1998) o Nin y otros (2003) es posible que tanto los métodos como los datos hasta ahora empleados hayan interpretado de forma errónea la productividad de la agricultura en algunos países sesgando sus medidas. Este es precisamente el propósito de este trabajo y para ello se hará uso del desarrollo metodológico llevado a cabo por O’Donnell (2008) para intentar resolver los problemas anteriormente señalados y contrastarlo con los resultados de las metodologías no paramétricas tradicionales. Mediante índices transitivos de Lowe se estima el cambio de la Productividad Total de los Factores (TFP en inglés), en este caso de la agricultura de algunos países de América Latina para el período 1990-2006. Los resultados obtenidos cuestionan la evidencia empírica obtenida en estudios precedentes. Finalmente se confirma la hipótesis sobre las diferencias de resultados de la productividad cuando se estiman mediante el concurso del índice de Malmquist y el de índices de Lowe.
Palabras clave: cambio técnico; economías de escala; eficiencia técnica; índices de Lowe y de Malmquist; Productividad Total de los Factores (TFP)
Introduction
The preoccupation present since many years ago around agricultural production is well-known, which affects issues of food security and environmental sustainability. In its statistical report, FAO (2013) confirmed that close to 40 % of the world population lives in rural areas and that of these 3 billion inhabitants, 90 % depend for their sustenance on agricultural production (1 % of agricultural growth in these regions is equivalent to 3.5 % of growth in other sectors of the economy). On the other hand, in the Johannesburg World Summit on Sustainable Development (held in the year 2002), stylized facts were contributed that characterized the situation of agriculture in relation to the environment (Naciones Unidas, 2002): soil erosion is responsible for approximately 40 % of land degradation in the world, agriculture represents approximately 70 % of the total global consumption of fresh water, and approximately 20-30 % of the land irrigated in the developing world has been damaged by flooding or salinity. These figures, 10 years later, were even more conclusive. FAO (2013) and the different environmental summits (linked primarily to climate change) were not able to organize a reasonable agenda to address these issues.
Under this scenario of critical thresholds (agricultural productivity and food security) more than one billion people depend on the yield of their harvests for their survival. Facing this situation and with data that seem to indicate a stagnation in the productivity of the poorest countries, it is necessary and urgent to delve into the study of the factors that impact these results, with the objective of promoting adequate policies that allow complying with the objectives of sustainable development that link poverty and food security.
From a strictly economic perspective and taking into account the preliminary works by Lewis (1954), it can be said that the productivity of agriculture in poor countries is very important to drive economic development: Lewis thought that only an increase in productivity in the agricultural sector could provide an alternative for economic development, both through the transfer of low productivity workforce to the industrial sector and through an improvement in terms of exchange in the agricultural sector itself (Eatwell, Milgate and Newman 1989), to which an improvement in the use of the environment and an invigorating motor of the exports sector should be added1.
However, the analyses of agricultural productivity, in addition to the issues related to economic and social policies to be implemented in order to improve the yield, a complementary aspect is also present that is related to methodological and measurement problems. Our central hypothesis is that the results that are obtained through different methodologies can be really different and, since these are the results that guide them in the end, for the application of policies in the agricultural subsector to achieve increases in productivity, clarifying such differences is an important element to take into account.
Fulginiti and Perrin (1997; 1998) considered in their time the possible discrepancies on the results of agricultural productivity. These authors suggested the idea of contrasting different methods of estimation (parametric and non-parametric) and alerted about the possibility of both the methods and the data being interpreted erroneously in terms of the evolution of agricultural productivity and how these results can condition decision making. Although the results did not show differences regarding the methodology used, it was evidenced that in this point there was much to be done. In this sense, this study is centered around the same idea: consider the robustness of the results with alternative measurement techniques, in the case that we are exploring by applying the methodology developed by O’Donnell (2008; 2010; 2012), which allows overcoming certain restrictions associated to the optimizing behavior of productive units and the degree of competition in the markets of products in contrast with the traditional methodology of the Malmquist indices. More specifically, the suggestion by O’Donnell allows decomposing spatially and in time through Lowe transitive indices, the change of TFP (Total Factor Productivity) in agriculture. For this purpose, the countries of Latin America are analyzed for the period of 1990-2006.
The structure of the study is the following: this section is completed with the analysis of the empirical evidence available about the productivity analysis of agriculture in developing countries. Section II recovers the methodology applied. Section III describes the data employed and presents the results obtained. Lastly, section IV summarizes the main conclusions and implications of the study, as well as some limitations and extensions.
In general terms, productivity refers to the amount of product that is obtained from levels of use of inputs in a specific sector or country. In the agricultural subsector we encounter empirical evidence that seems to point to the decrease or, in its case, the stagnation of productivity which seems to have been the standard during the last 40 years in developing countries, contrary to what happens in developed countries,.
For the case of Latin America, CEPAL (2007 pp: 77-114) analyzes from a descriptive point of view what the situation of agricultural productivity is in the region, differentiating aspects linked to technical progress and to innovation in a context of structural change and reprimarization. The conclusion is that the productivity gap in Latin American agriculture has been increasing when comparing it with developed and developing countries. Taking into account the differences between countries regarding the endowment of factors and the increase in prices of some agricultural products, the increase in productivity during the period of 1980-2000 has been much lower than what was expected according to the endowment of factors (land and work).
There is a large number of empirical studies in this regard; some have focused on developed economies, as is the case of the United States (Ball, 1985; Jorgenson et al.; 1987; Capalbo, 1988; Chavas and Cox, 1990; Burea et al., 1995; Trueblood and Ruttan, 1995; Morrison Paul et al., 2004; Morrison and Nehring, 2005), while others have analyzed the reality of less developed countries; among these, the following can be highlighted: Trueblood and Coggins (2003), Fulginiti and Perrin (1993, 1997, 1998), Kawagoe et al. (1985), Kawagoe and Hayami (1985), Lau and Yotopoulos (1989). Concerning Latin America, we can consider those by Tejo (1998), Pfeiffer (2003) and Ludeña et al. (2007), with the objective of approaching our central objective; that is, comparing methodologies and results regarding the TFP evaluation and the decomposition of its main components, for which there are some specific studies2.
Using data for the period of 1960-1980 in 21 developed countries and 22 developing, Kawagoe et al. (1985) estimate various production functions with dummy variables for 1970 and 1980. The results obtained by these authors indicate that developed countries present technological progress, while developing countries present technological regression.
Using a methodology of parametric frontier with meta-production functions, the results obtained by Lau and Yotopoulos (1989) show a negative productivity in developing countries during the decade of the 1970s and an increase during the previous decade.
In their turn, Fulginiti and Perrin (1998) examine the change in agricultural productivity for a set of 18 developing countries for the period of 1961-1985. These authors use techniques of parametric frontier (meta-production function), such as non-parametric Malmquist indices, and conclude in the same sense that other prior studies, pointing to a decrease of agricultural productivity in half of the countries analyzed.
Suhariyanto and Thirtle (2001) measure the TFP in 18 Asian countries for the period of 1965-1996. The measurement of the TFP is calculated through Malmquist indices regarding the sequential frontier. The results they obtain show that half of the countries have experienced a decrease in productivity, due to losses in technical efficiency combined with a standstill of technological progress.
Nkamleu (2004) examines the growth of the TFP and its decomposition into technological change and of the components of technical efficiency for a sample of 16 African countries during the period of 1970-2001. The analysis is carried out using the technique of data envelopment analysis (DEA). The results obtained point out that the region suffered a decrease of its productivity in the 1970s, which gave rise to some progress during the two posterior decades. In this study it is also highlighted that the change in technological progress has been the main restriction for the attainment of higher levels of TFP during the period.
Truebold and Coggins (2003) analyze 115 countries using alternative methodologies (constant returns and scale variables) and Malmquist indices. The results show that, in average, the agricultural productivity of developing countries during the period of 1961-1990 decreases annually at a rate of 0.9 %, while the more developed countries show an increase of 1.6 %.
Tejo (1998) identifies three groups of countries with the objective of performing homogeneous comparisons and, although the increases in productivity during the period of 1970-1990 reached average values of 0.9 % (they agree with the relative endowment of the factors land and work), the conclusion is that agricultural productivity in the Latin American region shows a lower dynamism compared to the behavior of productivity in developed countries.
Pfeiffer (2003) performs a study of agricultural productivity in the Andean region that integrates countries such as Bolivia, Colombia, Ecuador, Peru and Venezuela during the period of 1972-2000 through different parametric methodological approximations (fixed effects and stochastic production frontiers) and non-parametric ones (making use of the Malmquist index). The results obtained are in consonance with the results observed in Tejo (1998).
Ludeña et al. (2006) analyze a period of 40 years for Latin America and conclude that the region had a better behavior than what studies suggest in general, showing an average increase of 0.8 % annually and 1.7 % in the last stage. On the other hand, the data indicate the strong heterogeneity among countries.
In light of the empirical evidence, it can be said that most of the studies carried out in the agricultural sector of developing countries have shown a reduction in their productivity or a very low figure of growth, in clear contrast with what has happened in developed countries. However, authors like Fulginiti and Perrin (1993) suggest caution in the conclusions in face of the possibility of biasing the results from the effect of the price policies or from other interferences suggested in the agricultural sector that may have had an impact on certain incentives.
Nin et al. (2003) are found in a similar line of caution, in this case arguing possible problems in the estimations derived from their own methods used and from the data used. Concretely, they emphasize that the estimation of the TFP based on the DEA method shows that many countries experience contractions in the frontier (technical regression) during long periods of time, a result that is possibly an artifice of the measurement along the frontier. These authors propose as possible solution the use of an accumulative DEA that is opposed to the possibility of a part of the technological frontier going backwards.
Although the proposal by Nin et al. (2003) helps to understand some of the problems mentioned, according to Headey et al. (2010) it does not address the cause of the problem that would go through distinguishing between real productivity and random noise (or measurement errors). This can be done with the stochastic frontier analysis (SFA), which has already been used in the studies of countries; for example, in Coelli et al. (2003), and now applied in international studies like those by Bharati and Fulginiti (2007) and Headley et al. (2010). These authors observe a wide variation in the yield of countries. Concretely, the growth of the TFP was the fastest in OECD, Middle East and North Africa countries, variable in the regions of East Asia, Latin America and the Caribbean, and Sub-Saharan Africa, and in general quite low in South Asia during the period of 1970-2001.
Indeed, the use of SFA allows the estimation of inefficiencies assumed in the traditional approach of accounting for growth, using flexible functional forms with which to distinguish the inefficiency of measuring the error, and with the possibility of performing the conventional hypothesis tests. Having said this, it is also true that it is not always simple to fulfill some of the basic assumptions of the SFA, such as the need to specify the form of distribution of the inefficiency term, and the need to specify a functional form of the production function, as in the case at hand, with a sample of countries that are certainly heterogeneous.
Based on the empirical evidence and the methodological discussion paired with it, we have opted for doing an assay of measurement with the same data, but with non-parametric alternative methodologies (based on methods of linear programming from techniques of data envelopment analysis-DEA) to verify if the differences are significant.
The practical advantages derived from the flexibility of the DEA method to derive international technological frontiers3 have an undeniable weight on the election of this non-parametric approach, although it is not the only factor that has been considered, as we will explain next.
Due to the heterogeneity of the sample, a parametric approximation is not considered in this study fundamentally because of the different nature of the technique based on econometric models in which rather restrictive assumptions would have to be made, by virtue of which all countries would have a similar production technological frontier.
The adoption of the non-parametric approach used in this study assumes in the final analysis the possibility of comparing the results of a new methodologic development, such as the one proposed by O’Donnell (2008), with others derived from classical non-parametric approaches, such as those based on Malmquist indices.
Methodology for the analysis of productive efficiency through Lowe indices
The methodology developed by O’Donnell (2008) allows decomposing exhaustively any TFP index that is multiplicatively-complete in the product of the measurements of technical change and several significant measurements of the change in efficiency4.
In contrast with other methods of decomposition of the TFP, the one developed by O’Donnell (2008) does not depend on any hypothesis about technology, the behavior of productive units or the level of competition in the incoming or outgoing markets.
The main advantage of this method consists in its capacity to cover complex productive environments with technologies composed by multiple inputs and outputs, discriminating between efficient and inefficient units, requiring fewer assumptions about the efficiency frontier, identifying the sources of inefficiency (which allow showing the resources that are being used in excess). In terms of their main limitation, because it is not a non-parametric statistical method, we cannot judge the goodness of fit of the specifications of the model.
O’Donnell (2010) shows how the DEA method can be used to calculate and decompose the TFP index based on Hicks-Moorsteen distance functions. Likewise, he addresses how to use the DEA method to decompose indices based on Laspeyres, Paasche, Fisher and Lowe prices.
For O’Donnell (2010) the Lowe indices, as they are known after the contributions by this author in 1823, are particularly useful for the analysis of panel data, since they are temporally and spatially transitive, pointing out that although other alternative transitive numeric indices can be used, these tend to fail to fulfill one or some of the most important axioms of the theory of index numbers5. Its temporal and spatial transitivity is especially relevant for the empirical analysis presented in this study.
The Lowe index for the calculation of the TFP is preferred as opposed to other suggestions6 like those by Elteto and Coves (1964) or Szulc (1964), not only because it is transitive, but also because it fulfills the axiom of identity and is multiplicatively-complete. In the next section there is a description of how the indices of the TFP that are multiplicatively-complete can be decomposed into economically relevant components.
The Lowe index of the TFP and its components
The efficiency of the TFP can be defined as the difference between the TFP observed and the TFP that the author determines as the point of maximum productivity (MP) (O’Donnell, 2008):
In this expression, TFPEnt denotes a global measurement of yield of an agricultural productive unit (n) during a period (t) that represents a measurement of the efficiency of the total productivity of the factors. In turn, FTP*t represents the maximum possible of the measurement obtained in the Total Factor Productivity in the period t.
In terms of inputs and aggregated product, the efficiency of the TFP (total factor productivity) can be decomposed as:
In equation (2) RSMEnt expresses the scale yields of the efficiency Mix; RAEnt refers to the yields of assignative efficiency and OTEnt to the technical efficiency directed at the output.
According to O’Donnell (2010), there are so many economically significant decompositions of the efficiency of the TFP as economically significant points in the space of the aggregated amounts. Thus, for example, the following alternative decomposition can be considered, directed at the output:
where OSEnt is the habitual measurement of the scale efficiency directed at the output; ROSEnt expresses the residue of the scale efficiency directed at the output and RMEnt represents the residue of the efficiency Mix (a measurement of the difference between the TFP in a scale efficient point and the point of maximum productivity).
The index of the TFP multiplicatively-complete can be conveniently decomposed by rearranging the equation (1) as TFPnt=TFPt*´TFPEnt . An analogous equation can be defined for the country (m) in the period (s). Thus, the index of the TFP of the country n in the period t relative to the country m in the period s can be expressed as:
The first term in parenthesis is a measurement of the difference between the maximum productivity possible in the two periods considered, being a common measurement of the technological change. As O’Donnell (2008) points out, equation (5) reveals that the change in TFP can be decomposed into a measurement of the technical change and into a measurement of the change in efficiency. On the other hand, the expressions (2), (3) and (4) can be used to delve into the decomposition of the component of change in efficiency.
For example, any index of the TFP multiplicatively-complete can be decomposed into the measurements of technological change, change in technical efficiency, and a combined measurement of change in scale and the so-called efficiency Mix:
where OSMEnt =OSEnt ´RMEnt expresses the efficiency Mix directed at the output.
The results of this methodology will be compared with those obtained by applying the traditional approach of the Malmquist indices of the TFP, taking as a basis the methodology proposed by Färe, Grosskopf, Norris and Zhang (1994), by virtue of which the change in the TFP between two periods of time is measured, calculating the rate of the distances of each point of data in relation to a technology in common.
Use of the Data Envelopment Analysis (DEA) to compute and decompose the TFP indices
The software used to calculate the TFP indices and to decompose them into a measurement of technical change and several measurements of technical change, scale and efficiency Mix is DPIN™ (Version 3.1). This software allows a non-parametric estimation of a production frontier through mathematical programming known as Data Envelopment Analysis (DEA). A detailed review of this methodology can be found in Seiford and Thall (1990) or Färe, Grosskopf and Lovell (2013).
Data, variables and empirical results
Keeping in mind the main objective of this study, the analysis methodology described earlier is applied to a set of countries in Latin America (N=19) for the period of 1990-2006 (T=18). Therefore, we have a panel of data that covers a total of 342 observations for each one of the product and input variables considered for the estimations of the TFP and their decomposition into principal components (change in efficiency, technological change, change in pure efficiency and change in scale efficiency, and efficiency Mix).
The statistical source used has been the World Development Indicators Database of the World Bank. Concretely, the production of cereals expressed in kilograms per hectare (kg/ha) has been used as output variable, and the land devoted to the production of cereals expressed in thousands of hectares (thousand ha) has been used as input variable. A descriptive analysis of the basic statistics of the variables is presented in Table 1 of the statistical annex.
These variables include as cereals wheat, rice, maize, barley, oats, rye, millet, sorghum, buckwheat, and mixed cereals. Likewise, it should be mentioned that the production data of the cereals refer to the harvests of dry grain, while cereal crops harvested for hay, food, fodder, ensilage, or for grazing are excluded. In turn, the lands devoted to the production of cereals refer to the surface harvested, although some countries report only sowing or surface cultivated.
Results and discussion
TFP and efficiency directed at output
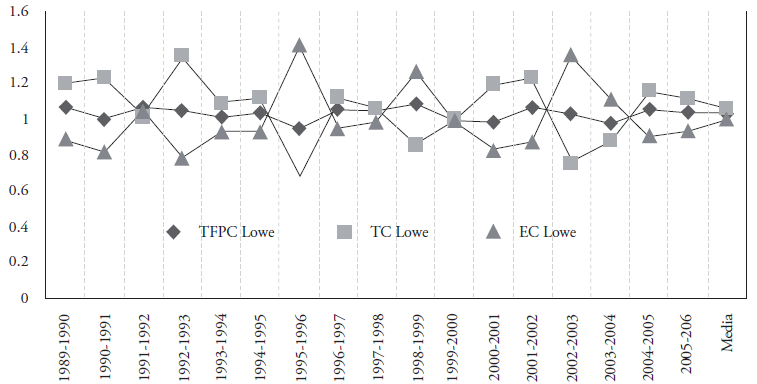
We begin the analysis by gathering in Table 1 the indices of changes of the TFP (TFPC), Technological Change (TC), and Efficiency Change (EC), as well as those relative to Technical Efficiency Change (ETC), Scale Efficiency Change (SEC), and Efficiency Mix Change (MEC), directed at the output. In order to have more information about the behavior of these indices the results of the change experienced both for the whole (1989-2006) and for the different sub-periods is presented.
Table 1 Indices of the TFPC and efficiency directed at output per year.
| Periodo | Índices del cambio de la TFP y de sus componentes | Índices del cambio de la eficiencia orientada al output | ||||
| TFPC | TC | EC | TEC | SEC | MEC | |
| 1989-1990 | 1.060 | 1.195 | 0.887 | 0.963 | 0.921 | - |
| 1990-1991 | 1.000 | 1.227 | 0.815 | 0.959 | 0.846 | - |
| 1991-1992 | 1.069 | 1.012 | 1.057 | 1.055 | 0.974 | - |
| 1992-1993 | 1.050 | 1.348 | 0.779 | 0.998 | 0.783 | - |
| 1993-1994 | 1.005 | 1.084 | 0.927 | 0.974 | 0.956 | - |
| 1994-1995 | 1.038 | 1.120 | 0.926 | 1.060 | 0.877 | - |
| 1995-1996 | 0.948 | 0.670 | 1.413 | 1.034 | 1.366 | - |
| 1996-1997 | 1.054 | 1.119 | 0.942 | 0.960 | 0.979 | - |
| 1997-1998 | 1.040 | 1.059 | 0.982 | 0.920 | 1.065 | - |
| 1998-1999 | 1.083 | 0.856 | 1.265 | 1.255 | 1.008 | - |
| 1999-2000 | 0.989 | 0.998 | 0.990 | 0.958 | 1.031 | - |
| 2000-2001 | 0.982 | 1.190 | 0.825 | 0.922 | 0.895 | - |
| 2001-2002 | 1.069 | 1.227 | 0.871 | 0.990 | 0.878 | - |
| 2002-2003 | 1.027 | 0.753 | 1.364 | 1.053 | 1.292 | - |
| 2003-2004 | 0.973 | 0.879 | 1.107 | 0.971 | 1.141 | - |
| 2004-2005 | 1.051 | 1.161 | 0.905 | 0.948 | 0.954 | - |
| 2005-2006 | 1.034 | 1.113 | 0.929 | 1.011 | 0.920 | - |
| Media | 1.028 | 1.059 | 0.999 | 1.002 | 0.921 | 1.000 |
Note: TFPC: Total Factor Productivity Change; TC: Technological Change; EC: Global Efficiency Change; TEC: Technical Efficiency Change; SEC: Scale Efficiency Change; MEC: Efficiency Mix Change.
Source: authors’ elaboration from the World Development Indicators (WDI) database by the World Bank.
In general terms it can be said that the mean change in TFP during the whole period considered has experienced an increase close to 3 %, which entails a behavior that is more similar to that of agriculture in developed countries, as has been discussed when reviewing the existing literature (when decomposing the TFPC it is observed that this increase would be explained importantly by the TC experienced that compensates the reduction observed in the EC that has been very small). When delving into the evolution of the efficiency indices estimated directed at output, it is observed that the TEC has experienced a small increase; however, it las been lagged importantly by the SEC.
These results show that, although modestly, productivity of agriculture in Latin America has experienced growth, which in a certain way endorses some empirical works, such as those already mentioned by Pfeiffer (2003) and Ludeña et al. (2006).
In order to delve into the results presented in Table 1, we can underline the sub-period of 1998-1999 as the one of greatest growth in terms of the TFPC (close to 9 %). In the opposite end we have the sub-period of 1995-1996, where the greatest loss in the TFPC index is experienced (with values close to 5 %).
We conclude the analysis of Table 1 by mentioning the most relevant results in terms of efficiency directed at output, observing that 1998-1999 is the sub-period with highest growth in the TEC (25 %), and 2000-2001 the sub-period of greatest decrease (close to 8 %).
Table 2 shows the decomposition of growth of TFPC for each of the countries considered and for the set of them, as well as the change in efficiency directed at output. It is interesting to note the improvement in efficiency experienced by Brazil, which with an EC index close to 5 % has achieved an increase in the TFPC index close to 8 %. In the opposite end we have Guatemala, with a reduction in its EC close to 4 %, figure that although modest is not an obstacle to present a slight decrease in its TFPC index, of less than 2 %, compensated by the positive change in TC. Concerning the components of the efficiency directed at output, it is important to highlight the strong growth in the TEC index experienced by El Salvador (2 %) and the SEC in Colombia (2 %).
Table 2 Indices of the TFPC and efficiency directed at output per country.
| País | Índices del cambio de la TFP y de sus componentes | Índices del cambio de la eficiencia orientada al output | ||||
| TFPC | TC | EC | TEC | SEC | MEC | |
| Argentina | 1.040 | - | 1.004 | 1.012 | 0.990 | - |
| Bolivia | 1.010 | - | 0.989 | 1.005 | 0.981 | - |
| Brasil | 1.078 | - | 1.052 | 1.010 | 1.009 | - |
| Chile | 1.050 | - | 1.016 | 1.001 | 1.014 | - |
| Colombia | 1.049 | - | 1.022 | 0.999 | 1.022 | - |
| Costa Rica | 1.059 | - | 1.000 | 1.000 | 1.000 | - |
| Cuba | 1.020 | - | 0.990 | 1.011 | 0.978 | - |
| Dominicana Rep. | 1.020 | - | 0.988 | 1.002 | 0.985 | - |
| Ecuador | 1.035 | - | 1.006 | 1.009 | 1.001 | - |
| El Salvador | 1.053 | - | 1.031 | 1.021 | 1.001 | - |
| Guatemala | 0.981 | - | 0.958 | 0.964 | 0.988 | - |
| Honduras | 1.031 | - | 1.015 | 0.998 | 1.005 | - |
| México | 1.023 | - | 0.994 | 1.000 | 0.992 | - |
| Nicaragua | 0.997 | - | 0.975 | 0.994 | 0.977 | - |
| Panamá | 1.015 | - | 0.987 | 0.996 | 0.984 | - |
| Paraguay | 0.993 | - | 0.964 | 1.000 | 0.972 | - |
| Perú | 1.021 | - | 0.994 | 1.000 | 0.996 | - |
| Uruguay | 1.043 | - | 1.017 | 1.012 | 0.998 | - |
| Venezuela, RB | 1.009 | - | 0.981 | 1.002 | 0.979 | - |
| Media | 1.028 | 1.059 | 0.999 | 1.002 | 0.993 | 1.000 |
Note: TFPC: Total Factor Productivity Change; TC: Technological Change; EC: Global Efficiency Change; TEC: Technical Efficiency Change; SEC: Scale Efficiency Change; MEC: Efficiency Mix Change.
Source: authors’ elaboration from the World Development Indicators (WDI) database by the World Bank.
Stemming from the results in Tables 1 and 2, and from a more general perspective, we can observe an evolution in the TFPC index that is rather smooth, which nevertheless is fruit of an uneven behavior of its components. Figure 1 shows how in different sub-periods the TC and EC indices have shown quite different values, as for example in 1992-1993, 1995-1996, 2001-2002, or 2002-2003, where sometimes it has been the TC which has allowed compensating the fall in growth of the EC (for example 1992-1993 and 2001-2002) and other times the role has been the opposite (for example 1995-1996 and 2002-2003) at the time of increasing the TFP.
Comparison between the Lowe TFPC index and the Malmquist index
Once the results obtained through the use of Lowe indices have been analyzed, let us consider the measurements obtained with a traditional non-parametric methodology, such as the Malmquist index, which has been widely used in the empirical literature on the analysis of productivity and the agricultural sector. For the case of Latin America in general and in Mexico in particular, see, for example: Lachaud, Bravo-Ureta and Ludena (2017); Nin-Pratt, Falconi, Ludena and Martel (2015); Trindade and Fulginiti (2015).
If we observe the mean Lowe TFPC index (Table 1) and the Malmquist index (Table 3), we see that the first with a mean value of 1.028 is sensibly higher than the second, whose value is 1.015. That is, with the Lowe index a growth of almost 3 % is observed during the period of 1989-2006, while this figure would reduce to half (1.5 %) in the case of the Malmquist index. This first result is the one that makes us think that regardless of the theoretical depth of the analysis of agricultural productivity and of the possible omission of specific variables, using the same data with different methodologies, the results are different and thus our central hypothesis is confirmed.
Table 3 Malmquist indices per sub-periods.
| Periodo | EC | TC | PEC | SC | TFPC |
| 1989-1990 | 0.877 | 1.195 | 0.960 | 0.914 | 1.049 |
| 1990-1991 | 0.803 | 1.227 | 0.955 | 0.841 | 0.986 |
| 1991-1992 | 1.017 | 1.012 | 1.050 | 0.968 | 1.029 |
| 1992-1993 | 0.773 | 1.348 | 0.994 | 0.778 | 1.043 |
| 1993-1994 | 0.920 | 1.084 | 0.968 | 0.950 | 0.997 |
| 1994-1995 | 0.919 | 1.120 | 1.054 | 0.873 | 1.030 |
| 1995-1996 | 1.398 | 0.670 | 1.032 | 1.354 | 0.937 |
| 1996-1997 | 0.930 | 1.119 | 0.955 | 0.974 | 1.041 |
| 1997-1998 | 0.966 | 1.059 | 0.915 | 1.056 | 1.023 |
| 1998-1999 | 1.248 | 0.856 | 1.246 | 1.001 | 1.068 |
| 1999-2000 | 0.979 | 0.998 | 0.956 | 1.024 | 0.977 |
| 2000-2001 | 0.817 | 1.190 | 0.917 | 0.891 | 0.972 |
| 2001-2002 | 0.863 | 1.227 | 0.986 | 0.875 | 1.059 |
| 2002-2003 | 1.352 | 0.753 | 1.051 | 1.286 | 1.018 |
| 2003-2004 | 1.102 | 0.879 | 0.969 | 1.138 | 0.969 |
| 2004-2005 | 0.892 | 1.161 | 0.943 | 0.946 | 1.036 |
| 2005-2006 | 0.923 | 1.113 | 1.008 | 0.915 | 1.027 |
| Media | 0.972 | 1.043 | 0.995 | 0.977 | 1.015 |
Note: TFPC: Total Factor Productivity Change; TC: Technological Change; EC: Global Efficiency Change; PEC: Pure Efficiency Change; SEC: Scale Efficiency Change.
Source: authors’ elaboration from the World Development Indicators (WDI) database by the World Bank.
If we delve at the level of country, higher values of the TFPC are also reflected in almost all the countries considered in the sample when we use the Lowe index (Table 2), instead of the Malmquist index (Table 4), with the case of Panama being especially relevant which presents a slight decrease in growth with this index (around 0.2 %), although with the Lowe index it would have a mean growth of 1.5 % during the period of 1989-2006. In the rest of the countries the differences observed are very similar when considering both total values and disaggregate values of the TFP, with the exception of Chile and Colombia.
Table 4 Malmquist indices per country.
| País | EC | TC | PEC | SC | TFPC |
| Argentina | 0.985 | 1.043 | 1.007 | 0.979 | 1.028 |
| Bolivia | 0.961 | 1.043 | 0.998 | 0.962 | 1.002 |
| Brasil | 0.996 | 1.043 | 1.003 | 0.993 | 1.039 |
| Chile | 1.000 | 1.043 | 1.000 | 1.000 | 1.044 |
| Colombia | 1.001 | 1.043 | 0.995 | 1.006 | 1.045 |
| Costa Rica | 1.000 | 1.043 | 1.000 | 1.000 | 1.043 |
| Cuba | 0.959 | 1.043 | 0.992 | 0.967 | 1.001 |
| Dominicana Rep. | 0.962 | 1.043 | 1.000 | 0.962 | 1.004 |
| Ecuador | 0.986 | 1.043 | 1.002 | 0.984 | 1.028 |
| El Salvador | 0.991 | 1.043 | 1.005 | 0.986 | 1.034 |
| Guatemala | 0.930 | 1.043 | 0.957 | 0.972 | 0.971 |
| Honduras | 0.974 | 1.043 | 0.987 | 0.987 | 1.016 |
| México | 0.978 | 1.043 | 0.997 | 0.981 | 1.020 |
| Nicaragua | 0.948 | 1.043 | 0.990 | 0.957 | 0.989 |
| Panamá | 0.957 | 1.043 | 0.992 | 0.964 | 0.998 |
| Paraguay | 0.941 | 1.043 | 0.988 | 0.953 | 0.982 |
| Perú | 0.968 | 1.043 | 0.994 | 0.974 | 1.010 |
| Uruguay | 0.985 | 1.043 | 1.002 | 0.983 | 1.027 |
| Venezuela, RB | 0.959 | 1.043 | 0.997 | 0.962 | 1.001 |
| Media | 0.972 | 1.043 | 0.995 | 0.977 | 1.015 |
Note: TFPC: Total Factor Productivity Change; TC: Technological Change; EC: Global Efficiency Change; PEC: Pure Efficiency Change; SEC: Scale Efficiency Change.
Source: authors’ elaboration from the World Development Indicators (WDI) database by the World Bank.
In Figure 2 we can see that in general terms the Lowe TFPC index presents a variability in the values estimated for the different sub-periods that is lower than the Malmquist TFPC index. In other words, the Lowe index provides an evolution of the TFPC that is somewhat smoother than the one offered by the Malmquist index (during all the years considered it is always lower than the Lowe index). The same happens with the components of efficiency directed at output of agriculture in Latin America, with results obtained from the Malmquist index being more variable. This very similar pattern that both indices follow throughout time is also worth underlining (with the period of 1991-1992 having the greatest discrepancy).
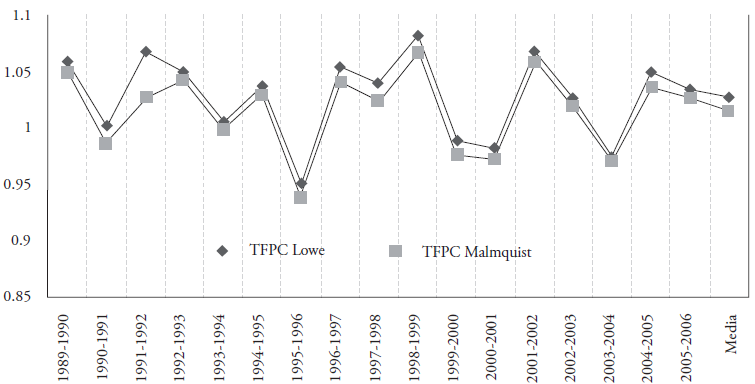
Source: authors’ elaboration from the World Development Indicators (WDI) database by the World Bank.
Figure 2 Evolution of the Lowe and Malmquist TFPC indices.
Figure 3 shows that although the TFPC with the Malmquist and Lowe indices has a similar pattern and does not differ when taking the mean values for the set of countries, when individual cases are considered the differences in some concrete cases like Brazil are higher. However, in other cases, as in Mexico, the differences between both indices are very small.
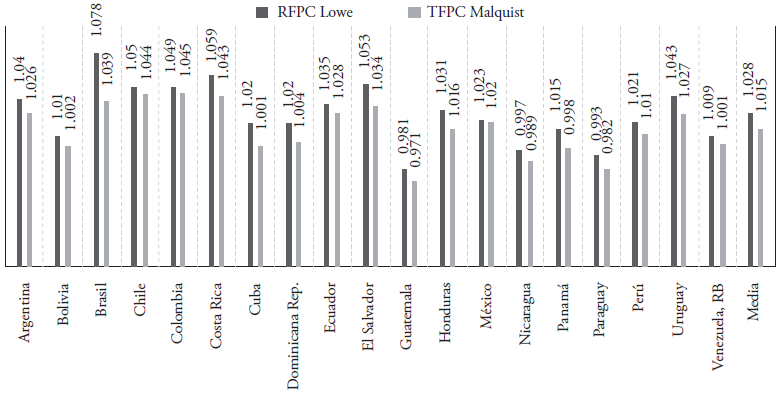
Source: authors’ elaboration from the World Development Indicators (WDI) database by the World Bank.
Figure 3 Difference by countries in the Lowe and Malmquist TFPC indices.
Estimating the mean TFPC, through Lowe and Malmquist indices, allows analyzing whether the two means proposed really present significant differences at the level of country. The Wilcoxon Contrast was carried out (Table 5) with this aim, as a non-parametric approximation for paired samples7, an adequate test for the comparison of mean ranges of values above and below the hypothetical mean of those measurements.
Table 5 Contrast of Wilcoxon differences between Lowe and Malmquist TFPC indices.
| Varianza ajustada | Estadístico | p-valor |
| 616.88 | 3.825 | 0.0001 |
Note: level of trust of 95 %.
Source: authors’ elaboration from the WDI database. World Bank.
Since the p-value for this test is under 0.05, we can reject the null hypothesis for a level of trust of 95.0 %. In other words, we can state that the two methods generate different measurements.
Conclusions
The results obtained show that, for the set of the 19 countries analyzed in Latin America, only three (Nicaragua, Guatemala and Paraguay) present a mean decrease in their agriculture productivity during the period considered, which does not agree with the empirical evidence obtained in previous studies. Likewise, Brazil and Costa Rica are identified as the most productive.
Based on the results obtained in our study we can say that, in contrast with the consistency between parametric and non-parametric techniques that Fulgini and Perrin (1998) obtained, we find that within the non-parametric methodologies such as the ones applied here when using their same data, there are significant differences in the estimation of productivity, both when considering the set of 19 countries in Latin America analyzed and in most of these countries when they are considered individually.
The inconsistency in the results obtained are an argument to be cautious about the analyses that have been performed on this theme, as well as the general conclusions that tend to consider that productivity of agriculture in developed and developing countries presented a very different evolution. In this point, it would be interesting to carry out future studies for other geographical regions with different characteristics, to see if these differences persist when using these non-parametric alternative approaches.
This scenario of agriculture in Latin America that is apparently more positive should not lead us, in any case, to conformist postures, given the evident need to continue with the effort to increase productivity in the region, but rather to reflect upon the way of measuring productivity, insofar as the methodology used can have contradictory results and therefore the policies suggested to improve agricultural yield can also have them.
Another pending, once the data are corrected, is to inquire as to why the growth of productivity in Latin America has been higher than what had been reported. In this sense, it is necessary to incorporate the most relevant variables to the analysis, both for the improvement in efficiency and for the technique. In this sense, we believe that the influence of the income and its distribution in the dynamic of the agricultural sector could play quite a relevant role.
Lastly, it is important that future studies in this area study the impact of the use of certain methodologies at the time of measuring agricultural productivity, without forgetting conceptual aspects related to additional investments; see for example Alston et al. (2010), regarding the role of the public activity of research and development that allow, among other things, to drive an integral management of the use of land and water, of marine ecosystems, forests, and conservation of biodiversity.
REFERENCES
Alston, J. M., M. A. Andersen, J. J. James, and P. G. Pardey. 2010. Persistence Pays: U.S. Agricultural Productivity Growth and the Benefits of Public R&D Spending. New York, Springer. [ Links ]
Ball, V. 1985. Output, input, and productivity measurement. Am. J. Agric. Econom. 67, 475-486. [ Links ]
Balk, B. M., and W. E. Diewert. 2003. The Lowe Consumer Price Index and its Substitution Bias. University of British Colombia, Department of Economics Discussion Paper No. 0407. [ Links ]
Bharati, P., Fulginiti, L. 2007. Institutions and Agricultural Productivity in Mercosur. MPRA Paper No. 9669. University Library of Munich, Germany. [ Links ]
Bravo-Ureta, B. E., and Pinheiro, A. E. 1993. Efficiency analysis of developing country agriculture: a review of the frontier function literature. Agricultural Resource and Economics Review. 22, 88-101. [ Links ]
Burea, R. Fare, and Grosskopf, S. 1995. A comparison of three nonparametric measures of productivity growth in European and United States agriculture. Journal of Agricultural Economics. 46, 309-326. [ Links ]
Capalbo, S. M. 1988. Measuring the Components of Aggregate Productivity Growth in U.S. Agriculture. Western Journal of Agricultural Economics 13(1): 53-62. [ Links ]
Caves, D. W., L. R. Christensen, and W. E. Diewert 1982. The Economic Theory of Index Numbers and the Measurement of Input, Output, and Productivity.» Econometrica 50(6): 1393-1414. [ Links ]
CEPAL. 2007. Progreso Técnico y cambio estructural en América Latina. Documento de Proyecto. UN-CEPAL, Santiago de Chile [ Links ]
Coelli, T., Rahman, S., and Thirtle, C. 2003. A stochastic frontier approach to total factor productivity measurement in Bangladesh crop agriculture. 1961-92. J. Int. Dev. 15, 321-333. [ Links ]
Coelli, T.J., Rao, and D.S.P. 2005. Total factor productivity growth in agriculture: A Malmquist Index analysis of 93 countries, 1980-2000. Agric. Econ. 32, 115-134. [ Links ]
Chavas, J.P., and Cox, T. 1990. A non-parametric analysis of productivity: the case of US and Japanese manufacturing. American Economic. Review 80, 450-464. [ Links ]
Eatwell, J., Milgate, M., and Newman, P. (eds). 1989. The new palgrave: Economic development. New York: Macmillan Press. [ Links ]
Elteto, O., and P. Koves. 1964. On a Problem of Index Number Computation Relating to International Comparison. Statisztikai Szemle 42: 507-518. [ Links ]
FAO. 2013. Statistical Year book: World food and agriculture. http://www.fao.org/docrep/018/i3107e00.htm [ Links ]
Färe, R., Grosskopf, S., and Lovell, C. K. 2013. The measurement of efficiency of production (Vol. 6). Springer Science & Business Media. [ Links ]
Färe, R., Grosskopf, S., Norris, M., and Zhang, Z. 1994. Productivity growth, technical progress, and efficiency change in industrialised countries. American Economic Review, Vol.84, pp: 66-83. [ Links ]
Fulginiti, L., and Perrin, R. 1993. Prices and productivity in agriculture. Review of Economics and Statistics. 75, 471-482. [ Links ]
Fulginiti, L., and Perrin, R. 1997. LDC agriculture: Nonparametric Malmquist productivity indexes. Journal of Development. Economics. 53, 373-390. [ Links ]
Fulginiti, L., and Perrin, R. 1998. Agricultural productivity in developing countries. Agricultural Economics 19 (1998) 45-51. [ Links ]
Jorgenson, D., Gollop, F., and Fraumeni, B. 1987. Productivity and U.S. Economic Growth. Harvard University Press, Cambridge, USA. [ Links ]
Headey, D., Alauddin, M., and Rao, D.S.P. 2010. Explaining agricultural productivity growth: an international perspective. Agricultural Economics, Volume 41, Issue 1, pages 1-14. [ Links ]
Hill, P. 2008. Lowe Indices. 2008 World Congress on National Accounts and Economic Performance Measures for Nations, Washington DC. [ Links ]
Kawagoe, T., Hayami, Y., and Ruttan, V. 1985. The intercountry agricultural production function and productivity differences among countries. Journal of Development Economics. 19, 113-132. [ Links ]
Kawagoe, T., and Hayami, Y. 1985. An intercountry comparison of agricultural production efficiency. American Journal of Agricultural. Economics. 67, 87-92. [ Links ]
Lachaud, M. A., Bravo-Ureta, B. E., and Ludena, C. E. 2017. Agricultural productivity in Latin America and the Caribbean in the presence of unobserved heterogeneity and climatic effects. Climatic Change, 143(3-4), 445-460. [ Links ]
Lau, L., and Yotopoulos, P. 1989. The meta-production function approach to technological change in world agriculture. Journal of. Development Economics. 31, 241-269. [ Links ]
Lewis, A. 1954. Desarrollo económico con oferta ilimitada de mano de obra. Trimestre Económico, 108, 629-675. México [ Links ]
Ludeña, C. E., Hertel, T. W., Preckel, P.V., Foster, K., and Nin, A. 2007. Productivity growth and convergence in crop, ruminant and non-ruminant production: measurement and forecasts. Agricultural Economics. 37, 1-17 [ Links ]
Morrison Paul, C. J., R. Nehring, and D. Banker 2004. Productivity, Economies, and Efficiency in U.S. Agriculture: A Look at Contracts. American Journal of Agricultural Economics 86(5): 1308-1314. [ Links ]
Morrison Paul, C. J., and R. Nehring. 2005. Product Diversification, Production Systems, and Economic Performance in U.S. Agricultural Production. Journal of Econometrics 126(2): 525-548. [ Links ]
Naciones Unidas. 2002. Informe de la Cumbre Mundial sobre el Desarrollo Sostenible, Johannesburgo (Sudáfrica), 26 de agosto a 4 de septiembre de 2002. http://daccess-dds ny.un.org/doc/UNDOC/GEN/N02/636/96/PDF/N0263696.pdf?OpenElement [ Links ]
Nin, A., Arndt, C., and Preckel, P. 2003. Is agricultural productivity in developing countries really shrinking? New evidence using a modified nonparametric approach. Journal of Development Economics, 71, August. pp: 395-415. [ Links ]
Nin-Pratt, A., Falconi, C., Ludena, C. E., and Martel, P. 2015. Productivity and the Performance of Agriculture in Latin America and the Caribbean: From the Lost Decade to the Commodity Boom (No. IDB-WP-608). IDB Working Paper Series. [ Links ]
Nkamleu, G. B. 2004. Productivity Growth, Technical Progress and Efficiency Change in African Agriculture. African Development Review, Volume 16, Issue 1, pp: 203-222. [ Links ]
O’Donnell, C. J. 2008. An Aggregate Quantity-Price Framework for Measuring and Decomposing Productivity and Profitability Change. Centre for Efficiency and Productivity Analysis Working Papers WP07/2008, University of Queensland. [ Links ]
O’Donnell, C. J. 2010. Nonparametric Estimates Of the Components of Productivity and Profitability Change in U.S. Agriculture, School of Economics University of Queensland St. Lucia, Australia, Centre for Efficiency and Productivity Analysis, Working Paper Series, No. WP02/2010. [ Links ]
O´Donnell, C. J. 2012. Non-Parametric Estimates of the Components of Productivity and Profitability Change in US Agriculture. American Journal of Agricultural Economics. July: 873-890. [ Links ]
Pfeiffer, L. M. 2003. Agricultural Productivity Growth in the Andean Community. American Journal of Agricultural Economics, American Agricultural Economics Association, vol. 85(5), pp: 1335-1341. [ Links ]
Seiford, L. M., and Thrall, R. M. 1990. Recent developments in DEA: the mathematical programming approach to frontier analysis. Journal of Econometrics, 46(1-2), 7-38. [ Links ]
Suhariyanto, K., and Colin Thirtle, C. 2001. Asian Agricultural Productivity and Convergence. Journal of Agricultural Economics, Volume 52, Issue 3, pp: 96-110. [ Links ]
Szulc, B. J. 1964. Indices for Multi-regional Comparisons. Prezeglad Statystyczny (Statistical Review) 3: 239-254. [ Links ]
Tejo, Pedro. 1998. Patrones tecnológicos en la hortofruticultura chilena. Serie Desarrollo productivo, Nº48 (LC/G.1990), Santiago de Chile, Comisión Económica para América Latina y el Caribe (CEPAL). [ Links ]
Trindade, F. J., and Fulginiti, L. E. 2015. Is there a slowdown in agricultural productivity growth in South America? Agricultural Economics, 46(S1), 69-81 [ Links ]
Trueblood, M., and Ruttan, V. 1995. A comparison of multifactor productivity calculations of the US agricultural sector. J. Prod. Anal. 6, 321-332. [ Links ]
Trueblood, Michael, and Jay Coggins. 2003. Intercountry agricultural efficiency and productivity: a Malmquist index approach. Washington, D.C., World Bank. [ Links ]
1Logically the decrease in productivity has repercussions in other areas although approaching this would exceed the objectives of this study. As an example let us point out the need to compensate the low productivity through the incorporation of new arable surface, forests, grasslands, wetlands, etc., which originate serious environmental deficiencies.
2For an exhaustive review and of broad spectrum of the main existing works about this theme until the decade of the 1990s, see the study by Bravo-Ureta and Pinheiro (1993).
3Through the estimation of distance functions of type input-output, which allow decomposing the change in TFP into movements on the frontier (technical gains) and along the frontier (efficiency gains), using for example Malmquist indices (Coelli and Rao, 2005).
4The typology of indices of the TFP multiplicatively-complete includes those by Paasche, Laspeyres, Fisher, Tornquist and those by Hicks-Moorsteen, but not the TFP index of Malmquist de Caves, Christensen and Diewert (1982).
5Details relative to the properties and the generalized use of the Lowe prices and quantity indices are approached in studies like those by Balk and Diewert (2003) and Hill (2008).
6These alternative approaches to build transitive indices consist basically in calculating binary intransitive indices and later applying a procedure of geometric mean.
7In this case there are n pairs of values (xi, yi) that can be considered as a variable measured in each country with two different methods. For this purpose, the set of differences between the sample pairs is considered, their absolute values are ordered from lowest to highest, and ranges are assigned. Finally, each range is associated with the sign of the corresponding difference and the statistic W is the lowest of the values: sum of positive ranges and sum of negative ranges (rejecting the Ho if W is too small).
APÉNDICE: ESTADÍSTICAS DESGLOSADAS POR PAÍS
Table I Basic statistics of output and input per country, 1990-2006.
| País | Producción de cereales (kg por hectárea) | Tierra dedicada producción de cereal (miles hectáreas) | ||||||||
| Media | Mediana | Des. Tip. | Máximo | Mínimo | Media | Mediana | Des. Tip. | Máximo | Mínimo | |
| Argentina | 3153.79 | 3221.56 | 544.83 | 4247.01 | 2129.37 | 9598.11 | 9242.22 | 1027.59 | 11 219.42 | 8141.40 |
| Bolivia | 1581.67 | 1556.98 | 218.75 | 2039.42 | 1352.04 | 729.74 | 723.94 | 81.39 | 901.78 | 582.50 |
| Brasil | 2586.85 | 2576.45 | 469.73 | 3385.40 | 1755.06 | 18820.78 | 18 442.08 | 1509.94 | 21 970.52 | 15 790.25 |
| Chile | 4677.41 | 4480.86 | 696.50 | 5998.31 | 3619.66 | 657.63 | 641.69 | 74.59 | 823.45 | 533.83 |
| Colombia | 3021.75 | 2980.08 | 509.80 | 3868.30 | 2450.74 | 1287.25 | 1240.12 | 216.73 | 1742.80 | 947.59 |
| Costa Rica | 3408.63 | 3451.33 | 331.93 | 3815.43 | 2621.79 | 70.45 | 69.20 | 11.89 | 93.70 | 54.67 |
| Cuba | 2371.89 | 2428.98 | 520.46 | 3188.80 | 1327.44 | 287.42 | 287.76 | 49.45 | 373.42 | 191.88 |
| Dominicana Rep. | 4014.86 | 4005.51 | 304.62 | 4623.34 | 3356.01 | 147.80 | 147.77 | 17.75 | 179.06 | 122.18 |
| Ecuador | 2108.98 | 1957.39 | 373.77 | 2804.97 | 1673.93 | 891.95 | 867.75 | 79.96 | 1048.83 | 759.65 |
| El Salvador | 2118.42 | 2045.31 | 339.52 | 2797.50 | 1609.63 | 398.95 | 410.33 | 52.10 | 486.29 | 320.10 |
| Guatemala | 1759.46 | 1778.41 | 171.21 | 2042.01 | 1365.70 | 707.45 | 676.65 | 76.64 | 855.08 | 609.00 |
| Honduras | 1401.15 | 1397.24 | 135.57 | 1579.42 | 1089.94 | 456.75 | 472.75 | 62.50 | 541.59 | 346.94 |
| México | 2709.68 | 2693.70 | 254.18 | 3181.00 | 2198.29 | 10287.95 | 10 305.87 | 561.34 | 11 480.50 | 9281.15 |
| Nicaragua | 1680.30 | 1688.68 | 118.80 | 1904.53 | 1374.22 | 395.72 | 372.98 | 86.26 | 541.78 | 282.66 |
| Panamá | 1897.06 | 1890.82 | 110.57 | 2085.92 | 1694.86 | 172.55 | 178.69 | 22.80 | 205.72 | 128.88 |
| Paraguay | 2058.37 | 2014.33 | 211.05 | 2462.80 | 1765.92 | 601.55 | 593.44 | 131.26 | 828.12 | 393.70 |
| Perú | 2935.21 | 2830.34 | 389.48 | 3557.88 | 2292.66 | 959.18 | 1000.59 | 182.70 | 1161.34 | 609.66 |
| Uruguay | 3299.37 | 3305.51 | 651.31 | 4302.97 | 2181.65 | 548.07 | 562.22 | 63.29 | 675.24 | 443.89 |
| Venezuela, RB | 3029.75 | 3084.38 | 328.93 | 3425.54 | 2343.42 | 855.64 | 811.81 | 147.19 | 1190.54 | 673.52 |
Source: authors’ elaboration from the World Development Indicators (WDI) database by the World Bank.
Received: February 2016; Accepted: August 2017
 Este es un artículo publicado en acceso abierto bajo una licencia Creative Commons
