


 nova página do texto(beta)
 Inglês (pdf)
 Artigo em XML
 Referências do artigo
 Enviar este artigo por email
 Citado por SciELO
  Similares em
SciELO
Similares em
SciELO 
 Permalink
1 Introduction
The function and structure of the central nervous system (CNS) is complex. An astronomical number of cells compose this system, including millions of neurons that possess the capacity of forming even thousands of synaptic connections. This fascinating system controls our movements and our thinking and learning processes; however, it is also vulnerable to disruptions that can result in lethal diseases. Shading light on how the CNS works both under normal and disease conditions is crucial to the development of new therapeutic strategies that allow correcting its malfunction [1]. Although the origin of CNS disorders is generally unknown, there is evidence that in many cases it involves the functional alteration of neurotransmitter receptors.
The ionotropic glutamate receptors (iGluRs) participate in critical aspects of CNS development and function. These transmembrane proteins regulate the rapid synaptic transmission, vital in neuronal communication [2]. In addition, through their role in synaptogenesis, neuronal viability, and regulation of synaptic efficacy, they also have crucial impact on memory, learning and plasticity processes [3].
The dysfunction of these protein receptors is, consequently, inherent to several chronic neurodegenerative disorders, including depression, stroke, epilepsy, Alzheimer's disease and Parkinson's disease [4,5].
The active structure of the iGluRs is composed of four subunits that integrate a tetrameric complex [6,7]. This complex includes a transmembrane domain (TMD), and two extracellular domains: the amino-terminal domain (ATD), and the ligand-binding domain (LBD). It also has an intracellular carboxyl-terminal domain (CTD) that modulates traffic and anchoring in synaptic sites. The TMD provides the structural scaffolding to form the ion-permeable central pore, while the ATD is packed in a dimer of dimers. The architecture of the LBD is defined by two lobes that houses ligands (small molecules) such as glutamate. Glutamate, the main excitatory neurotransmitter in mammals, activates iGluRs when it binds to the LBD. The outcome of this process prepares the neuron to produce a response and its disruption is associated to various CNS disorders [8-13]. The structural and dynamic characterization of the binding of ligands towards LBD is, therefore, essential from the pharmacological point of view. The design of molecules with ability to bind LBDs could drive the development of invaluable drugs for the treatment of a wide variety of neurological disorders.
The availability of the 3-dimensional (3D) structure of the protein (receptor) target is crucial to be able to incorporate drug design techniques to the discovery of new drugs. Recently, M0llerud and colleagues [14] obtained, by means of X-ray crystallography, the 3D structures of the LBDs of two rat iGluRs of the subtype kainate (GluK1) in complex with the glutamate analogue molecules (ligands), pyrazoline amino acid (LM-12b) and 3-carboxyisoxazolinyl proline (CIP-AS). However, although X-ray crystallography reveals structural information on the ligand-receptor interaction at the atomic level, it lacks the ability to provide insight into the dynamics of these interactions in both ligand-protein complexes. In this context, computational strategies have become a valuable complement to experimental techniques to extend the classical view of proteins, which considers these molecules as rigid entities, towards a dynamic model in which intra-molecular movements result in conformational changes that determine protein function and behavior when interact with different molecules.
Molecular dynamics (MD) is regarded as a computational 'microscopy' which "is able to capture the interplay between the atomic components of a system (e.g. ligand-receptor interaction) at a spatio-temporal resolution" [15]. This computer simulation technique is capable of monitoring the movements of particles (e.g. atoms and molecules), which are allowed to interact for a period of time, providing a description of the dynamic evolution of the system. This method assumes that the components of the system obey the laws of classical mechanics and, thus, the trajectories (conformational changes) of atoms and molecules are calculated solving numerically Newton's equation of motion [16].
In this work, we have used molecular dynamics to obtain a view of the dynamic structural evolution of the interaction of the ligand-binding domain (LBD) of receptor GluK1 with two analogues of glutamate (LM-12b and CIP-AS) and to calculate the energetic affinity of such interactions. This knowledge may help the rational design of new drugs to treat CNS disorders.
2 Methods
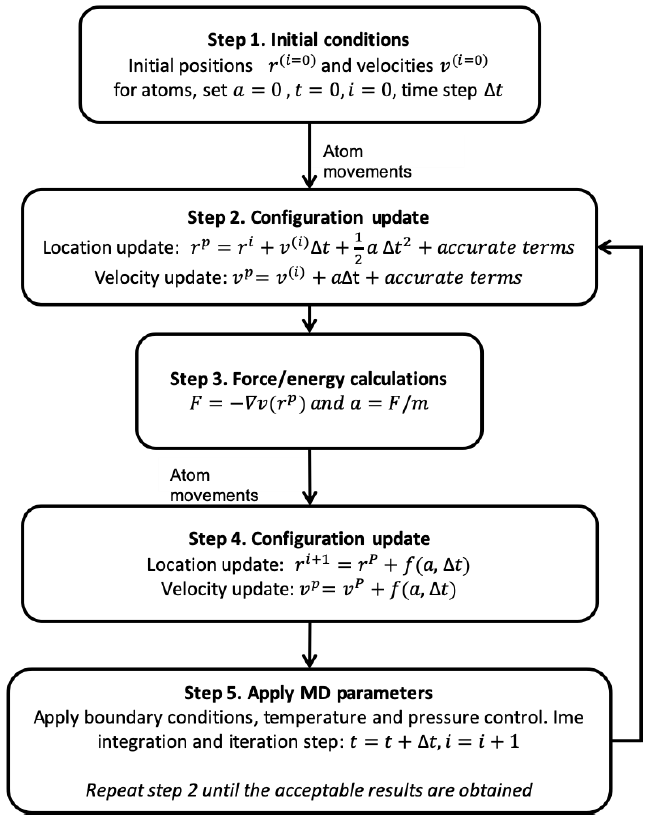
One of the most powerful tools to the study of biomolecular systems is the Molecular Dynamics (MD) method. This technique, by numerically solving the Newton's law of motion, allows to monitor the physical movements of atoms in a system and to compute its energy. MD simulations characterize, at the atomic level, the interplay between molecules for a certain period of time. This method is capable of providing detailed information on the fluctuations and structural changes of biomolecules, and thus, it is now routinely used to investigate the structure, dynamics and thermodynamics of biomolecules, such as proteins and their interactions with ligands. The first step of the MD simulation algorithm (Figure 1) includes the assignment of coordinates for each atom in the system, initial velocities, and a simulation time step (Δt) is defined. Subsequently, for each time-step of the simulation the forces between atoms, which are governed by an interatomic potential (force field), are computed and equations of motion are integrated.
2.1 Model System Preparation
The immense majority of biological processes occur in aqueous solution. Therefore, water effects are essential in determining molecular conformations and binding energies of interaction between biomolecules. Although GluK1 is a protein that is anchored to the membrane, the LBD is located in the extracellular space which is aqueous in nature. Consequently, each simulation system was constructed, including the ligand-receptor complex and a number of water molecules. The 3D coordinate of complexes GluK1-LBD/LM-12b (PDB ID: 5NEB B) and GluK1-LBD/CIP-AS (PDB ID: 5NF5 B) were taken from Protein Data-Bank [17]. The numbering of residues of both ligand binding domains (LBD) was conserved as indicated in the original pdb coordinate files. Each ligand-receptor complex was solvated with water molecules employing the Tip3P water model, and NaCl was added to reach a 0.15M concentration. Each system contained approximately 65,000 atoms with a cubic box dimension of 87 x 87 x 87 Ǻ3.
2.2 Energy Minimization
3D coordinates of proteins obtained from the PDB usually contain bad contacts between atoms, causing high energy and forces. To reduce these structural inconsistencies and to find an energetic local minimum, we subjected both systems to 50,000 steps of energy minimization using GROMACS [18], applying the steepest descent algorithm.
2.3 System Equilibration
Under physiological conditions, biological processes take place at 298K and 1 atm. Accordingly, we heated the system, employing the V-rescale thermostat [19], until a temperature of 298K was reached.
Heating was carried out under a constant Number of particles, Volume, and Temperature (NVT) ensemble during 0.5 ns. Subsequently, we applied pressure to the system until it reached the proper density using the Parrinello-Rahman barostat [19,20] and maintained the temperature constant using the Nose-Hoover thermostat [21], this process was conducted under an NPT ensemble for 5 ns, in which the Number of particles, Pressure, and Temperature were kept constant.
2.4 Molecular Dynamics Production
All simulations in this study were conducted under NPT conditions. The temperature (298K) and pressure (1 atm) were kept constant using the Nose-Hoover thermostat and the Parrinello-Rahman barostat throughout the 100 ns of simulation. Periodic boundary conditions were employed, and the long-electrostatic interactions were computed using the particle-mesh Ewald algorithm [22].
A time step of 2 fs was employed in all MD simulations, and the trajectory data was saved at 10 ps intervals. The center of mass (COM) of ligands with respect to different segments of the protein -residues I11-Y16, G59-A63, V137- S141 and S173- was measured. Binding energy of each ligand-receptor complex was obtained using the Adaptive Poisson-Boltzmann Solver (APBS) package [23], which allows to calculate the electrostatic free energy using a set of structures from the most representative cluster of the dynamics, by solving the Poisson-Boltzmann electrostatic continuity equation [23].
The cluster was calculated using structural similarity (RMSD) with a cut-off scheme of 0.07 Ǻ on the main chain of the protein and on all atoms of ligand. The most visited structure (centroid) of each cluster was used for representing the interactions and they were obtained using LigPlot+ [24] and VMD [24,25] programs. All MD simulations were performed using Gromacs 5.1.4 [18] with the CHARMM36 force field [26] on a Linux cluster using 64 cores at 2.6GHz for five days of wall-clock time for each system.
Trajectories were analyzed by using Gromacs software package.
3 Results and Discussion
Biological processes are the outcome of time dependent interactions between biomolecules, and these interactions occur at the interfaces of molecules such as those that form proteins and ligands. Thus, the structural and dynamics characterization of such interactions is of paramount importance to unveil the mechanism that sustains life.
For example, profiling the dynamics interaction of the receptor GluK1, a subtype of the iGluRs, with ligand molecules could potentially help elucidate the mechanisms that underlie many CNS disorders (e.g., Alzheimer's disease, epilepsy and depression) and pave the way to advance the development of new drugs. However, traditional laboratory approaches are able to measure mostly macroscopic observables but lack the resolution needed to measure the atomic behavior of molecules in a period of time. Molecular dynamics (MD) techniques have emerged as an essential complement to laboratory methods to gain understanding on the microscopic evolution, at the atomic level, of biomolecular systems. In this work, we have used MD to explore the dynamics of the interaction between the ligand-binding domain of the protein GluK1 with the ligands CIP-AS and LM-12b.
3.1 Characterization of Conformational Changes
According to crystallographic data [14], both LBDs display three loops and one alpha helix in close proximity to ligands. Our MD simulations identified four regions of GluK1 that play and essential role in the interaction with CIP-AS and LM-12b (Figure 2), and allowed us to explore the conformational changes of these structural motifs with respect to the ligand over a period of 100 ns of simulation.The structural conformation (trajectory) of the complex GluK1-LBD/CIP-AS remained stable throughout the simulation time (Figure 3).

Fig. 2 Three-dimensional structure of the ligand binding-domain of kainate receptor subunit 1 (GluK1-LBD) depicted in new cartoon and colored according to secondary structure. Purple (alpha helix), green (beta sheet), ochre (connecting loops), study motifs in the "mouth" of the ligand-binding domain colored by black I11-Y16), red (G59-A63), blue (V137- S141) and yellow (S173) (A). (A). Structure representation of LM-12b and CIP-AS depicted in ball and stick and Natta projection (B)
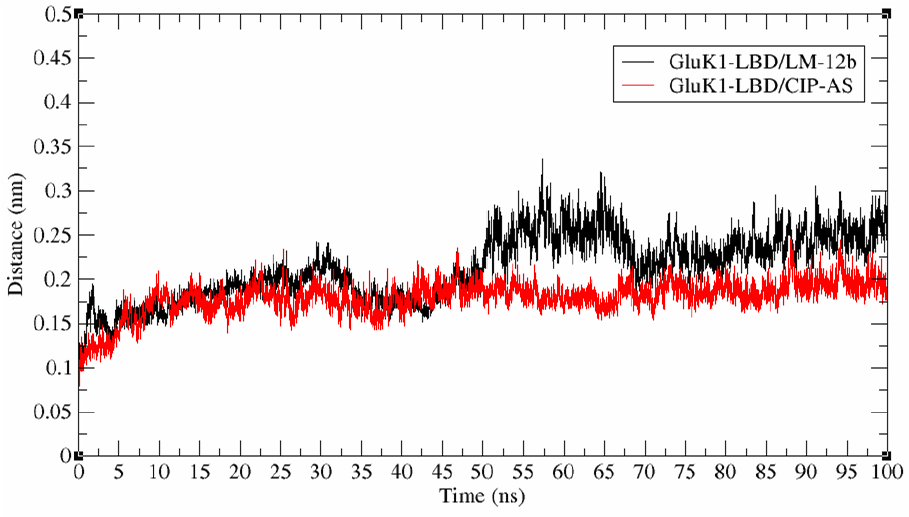
Fig. 3 Main chain RMSD of complexes GluK1-LBD/LM-12b and GluK1-LBD/CIP-AS throughout 100 ns of molecular dynamics simulation
The RMSD -the conformational change of the complex at every simulation point with respect to the initial conformation- varied approximately only 0.1 nm. It is accepted that a variation lower than 0.02 nm describes a stable molecular system [27]. In contrast, the GluK1-LBD/LM-12b complex showed an abrupt RMSD change from nanosecond 45 onwards (Figure 3). Trajectory analysis also showed that these conformational changes resulted from the structural relaxation of the segments that compose the external "mouth" of the ligand-binding domain (LBD).
Based on the residues that are allocated in close proximity to ligands, we defined four receptor segments, V137-S141, S173, G59-A63, and I11-Y16. We explored the mobility of these segments relative to the center of mass (COM) of each ligand throughout the simulation. The COM of residues V137-S141 and S173 of the complex GluK1 -LBD/LM-12b are relatively close to the COM of the ligand during the first 50 nanoseconds of simulation, ~0.6 nm (Figure 4A) and ~0.8 nm (Figure 4B), respectively. However, these distances increased dramatically from the ns 50 onwards until they remained stable at ~0.8 nm and 1 nm, respectively.

Fig. 4 Distances between the center of mass (COM) of ligands and segments allocated in the "mouth" of the LBD of complexes throughout the simulation. Distance variation between COM of segment V137-S141 and ligand (A). Distance variation between COM of residue S173 and ligand (B). Distance between COM of Segment G59-A63 and ligand (C). Distance between COM of Segment I11-Y16 and ligand (D). Inset tables shows the average (and standard deviation) distance between the COM of residue segments and COM of ligands calculated over the last 40 ns of simulation
These distances are comparable to that showed between GluK1-LBD and CIP-AS (Figures 4A and 4B). Unlike these protein segments, the distance between the residues G59-A63 and the COM of the ligand in both complexes remained stable at an approximate value of 0.85 nm (Figure 4C). The notable conformational change observed in the GluK1-LBD/LM-12b complex suggests that the initial structure obtained by crystallography may not describe accurately the ligand-receptor interactions.
The structure of the GluK1-LBD/CIP-AS complex is more uniform throughout the simulation (Figure 3). Segments V137-S141, S173, G59-A63, and I11 -Y16 of these complexes showed conformational stability (Figures 4A, 4B, 4C and 5D), and importantly the average structure obtained from the simulation is comparable to that of the crystallographic structure.
Interestingly, unlike the previous segments analyzed, where the distance between their COMs to the ligand COM is similar in both complexes over the COM of segment comprised by the residues I11-Y16 and the ligand COM presented a difference of 0.13 nm (Figure 4D). This distance difference could be attributed to the hydrophobic interaction formed with the methyl group of the structure of LM-12b (Figure 3B).
The hydrocarbon chain of residue E13 is crucially implicated in this interaction with the ligand.The close proximity of the segment I11-Y16 to both ligands is responsible for stabilizing its conformational mobility, resulting in a decreased RMSF, 1.8 Ǻ for CIP-AS, and 1.0 Ǻ for LM-12b. This low mobility is associated to the low fluctuation and high stabilization of the interactions formed in each ligand-receptor complex.
3.2 Binding Energy and Ligand-Receptor Interactions
Radioligand binding assays have been reported to the measurement of the affinity of a both LM-12b and CIP-AS towards rat GluK1 in terms of their inhibitory constants (Ki) [14]. In comparative studies, we employed a computational approach to estimate the energy of binding of both complexes and subsequently investigate if there was a consistency between predicted affinities computationally calculated and reported experimental Ki values. Although there are many computational approaches to calculate the ligand-protein energy of binding, the Poisson-Boltzmann method is a cost-effective method to estimate this thermodynamic property, and thus we used this computational strategy to calculate the binding affinities of LM-12b and CIPAS with rat GluK1. Table 1 shows the calculated binding energies for both complexes.
Table 1 Binding energy calculation by Poisson Boltzmann method and reported experimental inhibitory constant (Ki) for complexes GluK1-LBD/Ligand
These calculated energy values were consistent with the reported Ki values: a lower Ki value implies a higher affinity; likewise, a lower predicted energy of binding suggests a stronger affinity.
Although our results show that the method successfully ranks the affinities of both ligands, it underestimated the affinity of LM-12b toward the receptor (LBD of GluK1) (Table 1). Our in silico approach calculated approximately a two-fold increased affinity for LM-12b with respect to CIPAS. However, experimentally calculated Ki shows that the affinity of this ligand is actually about nine times higher than that of LM-12b (Table 1).
Other studies have found similar results [28,29] for other ligand-receptor systems and attributed such differences to the contribution of the configurational entropy [30].
It is worth noting that there are other in silico approaches that are capable of providing more accurate estimations of the binding affinity [31], but the improvement is attained at the expense of a significant increased computing time. The method that we have used though it delivers more rough binding estimations, importantly it still can rank correctly the binding affinities of a group of ligands at a reduced computing cost, which may potentially be valuable to the rapid identification of ligands that bind the protein receptor with higher affinity, which could lead to the development of new drugs.
Both complexes showed similar ionic interactions. Residues E190 and R95 (Table 2) interacted this via with the secondary amine group (N1: CIP-AS and N3: LM-12b) and the carboxylate group (C1 : CIP-AS and C8: LM-12b) (Figures 5 and 6). All saline bonding interactions have the same distance magnitude, being the R95-COO- bond of the CIP-AS ligand only slightly different (Table 2). However, the lengths of all ionic bonds for both complexes were below 0.32 nm, which are considered as strong interactions. H-bonding interactions are similar in both complexes (Figure 5B, 6B and Table 3). The only difference lies in that CIP-AS forms two additional hydrogen bonds with residue T142.
Table 2 Ionic bonding lengths for complexes GluK1-LBD/Ligand (nm)
| Ionic Bond | GluK1/LM-12b | GluK1/CIP-AS |
|---|---|---|
| R95-COO– | 0.270±0.010 | 0.271±0.010 |
| E190-NH | 0.272±0.011 | 0.293±0.027 |
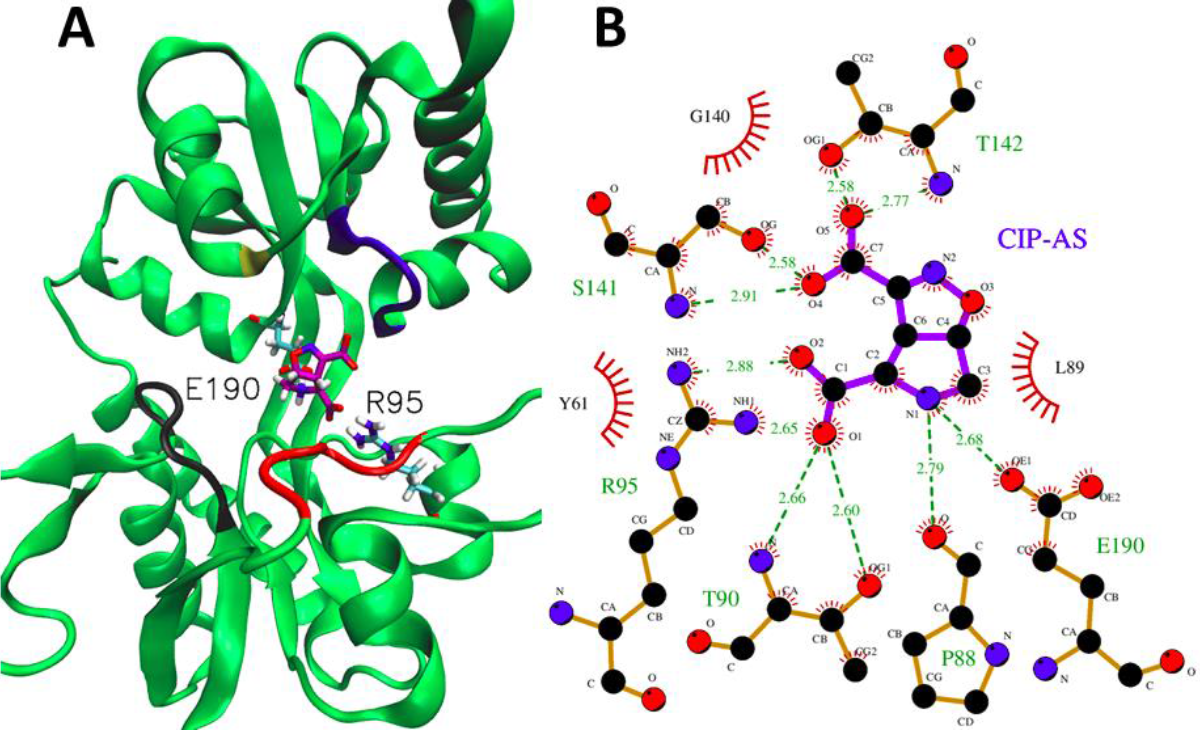
Fig. 5 Most representative centroid of complex GluK1-LBD/CIP-AS during the las 40 ns of simulation. Three-dimensional structure of complex GluK1-LBD/CIP-AS and main interaction residues (R25 and E190) depicted by ball and sticks, study motifs in "mouth" of binding ligand domain colored black I11-Y16), red (G59-A63), blue (V137- S141) and yellow (S173) (A). Bi-dimensional map of principal interactions of complex GluK1/CIP-AS. Dotted lines of green represent ionic and hydrogen interactions, red semi-circle represents hydrophobic interactions with ligand (B)

Fig. 6 Most representative centroid of complex GluK1-LBD/LM-12b during the las 40 ns of simulation. Three-dimensional structure of complex GluK1-LBD/LM-12b and main interaction residues (R25 and E190) depicted by ball and sticks, study motifs in "mouth" of binding ligand domain colored black (I11-Y16), red (G59-A63), blue (V137- S141) and yellow (S173) (A). Bi-dimensional map of principal interactions of complex GluK1/LM-12b. Dotted lines of green represent ionic and hydrogen interactions; red semi-circle represents hydrophobic interactions with ligand (B)
Table 3 Occupancy for hydrogen bonds for complexes GluT1-LBD/Ligand
| GluK1-LBD/LM-12b | GluK1-LBD/CIP-AS | ||||
|---|---|---|---|---|---|
| Donor | Aceptor | Occupancy | Donor | Aceptor | Occupancy |
| S141-Main | LM-12b-O3 | 60.41% | S141-Main | CIP-AS-O4 | 50.31% |
| S141-Side | LM-12b-O3 | 47.53% | S141-Side | CIP-AS-O4 | 67.10% |
| T90-Main | LM-12b-O4 | 83.80% | T90-Main | CIP-AS-O1 | 79.40% |
| T90-Side | LM-12b-O4 | 72.07% | T90-Side | CIP-AS-O1 | 0.13% |
| LM-12b-N1 | P88-Main | 14.86% | CIP-AS-N1 | P88-Main | 24.42% |
| T142-Side | CIP-AS-O5 | 30.27% | |||
| T142-Main | CIP-AS-O5 | 8.07% |
However, these additional interactions in the GluK1-LBD/CIP-AS caused a decreased occupation percentage for the conserved interactions.
For example, the occupancy of T90, involved in a hydrogen bonding interaction with carboxylate group of LM-12b, decreased dramatically from 72% to 0.13% (Table 3). It is worth noting that this carboxylate group is also involved in an ionic interaction with R95 of the LBD. Consequently, LM-12b stability is affected when it is in close proximity to the loop including I11-Y16 residues, which restricts its mobility and strengthens ligand-LBD atomic interactions.
The hydrophobic interactions are also highly similar in both complexes. The difference resides in that E13 residue, located in the loop I11-Y16 of complex GluK1/LM-12b (Figure 6B y 7B), appears to be in closer proximity to the methyl group of LM-12b than to that of CIP-AS. The distance between the gamma carbon (CG) of E13 and the C6 of the methyl group of LM-12b was 0.435 ± 0.043 nm, during the last 40 ns of simulation, resulting in a decreased RMSF for this specific residue from 0.25 nm to 0.17 nm for LM-12b. Also, the proximity of E13 to LM-12b increased the occupation percentage of the hydrogen bond formed by the side chains of E13 and Y61, from 10.90% to 30.12% (Table 3), resulting in a decreased mobility (RMSF) of Y61, which takes part in hydrophobic interactions in both complexes, from 0.21 Ǻ to 0.11 Ǻ.
4 Conclusions
Since molecules are flexible and dynamic in nature, experimental structures of biomolecules alone cannot reveal the entire picture of the microscopic interactions. Molecular simulations represent an interdisciplinary approach that is necessary to complement the experimental studies to describe the structural variations of biomolecules in a fixed period of time.
Our molecular dynamics studies revealed that the crystallographic structure of the GluK1-LBD/LM-12b complex may not be appropriate to represent the ligand-protein interactions.
According to this crystallographic data, protein segments (S173 and V137-S141) forming part of the "mouth" of the ligand binding-domain are in close proximity to the ligand. However, our findings showed that this is the case only at the early stages of the simulation. From ns 5 onwards, LM-12b ligand started to separate from the receptor until it stabilized at a distance similar to that between CIP-AS and GluK1-LBD.
MD simulations also showed that interactions in both complexes are essentially similar. The main difference is given by the distance of the loop comprising residues I11-Y16 to both ligands. The distance of this loop in GluK1-LBD/LM-12b complex allowed the interaction with the methyl group present in ligand. This interaction further stabilized the LM-12b molecule, decreasing its mobility and favoring interactions such as the triple interaction T190-COO--R95, and intra-chain hydrogen bonding between E13 with T61.
Residue T61 also takes part in a conserved hydrophobic interaction with the ligand in both complexes. E13 forms an additional hydrophobic contact, but it is only present in the GluK1-LBD/LM-12b complex, with methyl group of LM-12b. In comparative studies, the ligand-protein binding energy calculated using the Poisson-Boltzmann method allowed us to rank correctly both complexes and these results were consistent with the experimental affinities (Ki).
This method could be a valuable tool to classify ligand-receptor affinity for this particular system. The understanding of the structural and dynamics bases that underlie the mechanism of ligand-kainate receptor interaction may ultimately drive the identification of new modulators aimed at the treatment of CNS disorders.

