Introduction
Historically, economists and geographers have researched the location determinants and spatial distribution of economic activity. This interest has expanded to explaining the location of Foreign Direct Investment (FDI) in host countries. However, despite the vast amount of empirical literature that tries to explain the determinants of FDI location, a clear consensus has not yet been reached on this matter. Assuncao, Forte and Teixeira (2011) attribute this lack of consensus to the specificity of empirical studies that focus on a particular country or a particular region. Also, the theoretical bases that guide the list of determinants for different studies seem to turnout in some cases with non-statistical significant results.
According to Dunning and Lundan (2008) the spatial distribution of economic activity shows a tendency to geographically concentrate in regions and the theoretical claims for explaining location determinants of FDI seem to fall in two categories: micro dimensions (organizational aspects) and macro dimensions (resource allocation). Considering the macro dimensions, Jordaan (2009) mentions that certain regional factors such as regional demand, regional production costs, regional government policies and agglomeration economies influence the location decisions of FDI. In particular, the presence of agglomeration economies contains a spatial determinant that has been of recent interest in the empirical literature.
For the case of JFDI, its location determinants have been analyzed and documented specially for the case of China (Belderbos and Carree, 2002; Cassidy and Andreosso-O’Callaghan, 2006; Cheng and Stough, 2006). Japanese investment in Mexico has received scarce interest from the empirical literature, even though JFDI inflows to the country have sharply increased since the implementation of the Mexico-Japan Economic Partnership Agreement (EPA) in 2005. For example, JFDI flows to Mexico were registered at us$139m in 2003, at $440m in 2007 and us$1,618m in 2013 (Secretaría de Economía, 2015). This represents an average annual growth rate of over 20% for the entire period. Also, according to the Japan Bank for International Cooperation (JBIC), Mexico has become more appealing to Japanese investors. The country ranked 12th position in the JBIC’s JFDI attraction index in 2011 and 6th in 2014.1
Guzman-Anaya (2013) mentions that most of JFDI in Mexico is concentrated in automotive-related industries with over 70% of total flows in the NAICS2 subsector “Transport Equipment Manufacturing”. Generally, JFDI in this type of industry follows a spatial agglomeration distribution characterized by close proximity between Japanese firms (Smith and Florida, 1994). Similarly, Chan, Makino and Isobe (2006) argue that the presence of agglomeration economies or industrial clusters in the host country is determinant for the location decisions of Japanese firms. Additionally, the presence of other Japanese firms in related industries seems to also matter as a determinant factor for the location decision of new projects (Belderbos and Carree, 2002; Kakihara and Guzman-Anaya, 2014).
The present study attempts to analyze the recent increase of JFDI in Mexico and contribute to the literature on location factors from JFDI, focusing on macro dimensions or regional factors that influence the location decision of Japanese firms incorporating a spatial element in the analysis. The study is conducted at a state level using spatial analysis tools to determine if certain regional characteristics and agglomeration economy effects are determinant factors for Japanese firm location.
Literature Review
The location decision of FDI activities is influenced by regional characteristics in the host country. These regional factors may be classified in terms of regional demand, regional production costs, regional policies and regional presence of agglomeration economies (Jordaan, 2009).
Regional demand factors influence the location decision of FDI, as foreign firms tend to locate in regions with higher demand for their products. Several empirical studies have confirmed this claim. For example, Coughlin, Terza and Arromdee (1991) find that the probability of a new region being selected by new FDI projects is positively related to the regional level of income per capita. Similar results are found in Woodward (1992) for regional income. For the case of JFDI, Smith and Florida (1994) find that Japanese automotive firms in the U. S. seem to prefer populous areas that provide access to larger labor markets.
Regional production costs are usually captured in the empirical literatura via labor costs, measured by the wage level (Coughlin et al., 1991; Friedman, Hung-Gay, Gerlowski and Silberman, 1996). Generally, it is argued that foreign firms choose locations with relative lower wages. A body of literatura has found a negative relationship between wage level and FDI location, suggesting that new FDI projects prefer locations with lower wages (Luger and Shetty, 1985; Coughlin et al., 1991; Jordaan, 2009). However, another group of studies report a positive relationship between wage levels and FDI location (Head, Ries and Swenson, 1999; Guimaraes, Figueiredo and Woodward, 2000). JFDI studies usually fall in the latter group of empirical results (Smith and Florida, 1994; Cheng and Stough, 2006). Authors explain this positive relationship between wage level and FDI location by the fact that wages also incorporate the productivity attainment of workers. This seems to indicate that Japanese firms prefer locations with a more educated workforce (Cassidy and Andreosso-O’Callaghan, 2006).
Regional policies also seem to matter in the location decision of FDI. Empirically, however, it is difficult to encounter reliable data to test this hypothesis and to estimate the effect or quantify the regional variation of policies (Jordaan, 2009). A study from Head et al. (1999) reports that certain policies such as regional corporate taxes, homogeneity in regional business taxes and regional labor subsides are determinant for the location selection of new FDI projects. Empirical evidence for JFDI mentions that in certain cases, the presence of fiscal incentives attracts Japanese firms. Head, Ries and Swenson (1995) find this to have been the case for Toyota in the U. S. Also, the presence of Special Economic Zones (SEZs) seemed to be an important determinant for the location of JFDI in the early stages of liberalization of the Chinese economy (Zhou, Delios, and Yang, 2002). Finally, the presence of infrastructure also seems important for the location decision of JFDI. Cassidy and Andreosso-O’Callaghan (2006) find transportation infrastructure to be statistically significant in the location decision of Japanese firms in China.
Regional presence of agglomeration economies benefits foreign firms in host countries in several ways: better infrastructure and trained workers, a greater division of labor with more specialized support services and lower production costs (Blanc-Brude, Cookson, Piesse and Strange, 2014). Also, as pointed out by Zaheer (1995), the agglomeration of FDI creates an expatriate network with local knowledge of the institutional environment and eases the flow of information for the recruitment process of local managers with familiarity in working for international firms. For the case of JFDI, the agglomeration preference of Japanese firms follows the organizational and production structure adopted from Japan, where the manufacturing system is characterized by close proximity between assemblers and suppliers of parts and components (Aoki, 1990; Asanuma, 1989). Empirically, Belderbos and Carree (2002) find that Japanese firms select their location in areas with the presence of a keiretsu-type of agglomeration of activities, where the presence of this type of agglomeration seems to be more evident and matter more for small and medium-sized enterprises. Similarly, Smith and Florida (1994) report that Japanese firms in automotive-related industries prefer locations with agglomeration of manufacturing activities and close proximity to Japanese automotive assemblers.
Empirical Methodology and Data
The empirical approach of this analysis consists of several stages. First, it is convenient to perform an exploratory analysis of the spatial data. A visual representation of the data in a natural breaks map can show the spatial distribution and detect spatial patterns. This method consists on a data clustering technique that seeks to partition the information into classes minimizing the average deviation of each class from its mean and maximizing the within class variance.
Second, once a visual representation of the data shows a spatial pattern, it is necessary to confirm the presence of spatial dependence. In this sense, a measure of spatial dependence usually employed in empirical analysis is Moran’s I test for spatial correlation.
Specifically, Moran’s I is defined as:
where zi is the deviation of the variable xi from its sample mean (x1i - x-); wi,j are the spatial weights taken from matrix3W ; N is the sample size and S 0 is the aggregate of spatial weights, defined as:
Moran’s I follows a standardized normal distributions for large samples, the statistic can be computed as:
where:
Third, although Moran’s I evaluates the global dependence in all regions, the index is not able to detect the presence of local cluster patterns. As an alternative, local indices may be computed; for the case of Moran’s index, its local index is referred to as Local Indicator of Spatial Association (LISA) and this statistic may confirm spatial dependence for each region in the data (Romero and Andres-Rosales, 2014). The LISA index is computed as follows:
The LISA index also follows a standardized normal distribution for large samples, with its statistic computed as:
where:
A statistical significant and positive high value of the LISA index reflects a cluster in región i with presence of similar high values; a statistical significant and negative value reflects clustering of similar low values (Romero and Andres-Rosales, 2014).
Finally, once a spatial dependence is confirmed in the data, it is necessary to specify a model that captures this dependence. Estimating Ordinary Least Squares (OLS) without taking into account the spatial dependence will produce a specification error due to variable omission (Romero and Andres-Rosales, 2014; Lesage and Pace, 2009). The spatial models employed for this analysis are the Spatial Lag (SL) and Spatial Error (SE) econometric models following those proposed originally by Anselin (1988).
After estimating the model via OLS, the existence and type of spatial dependence in the data may be confirmed by means of the Moran I test and the Lagrange Multiplier (LM) test for spatial correlation. The results of these tests provide the basis to determine the appropriate model between the SL and SE alternatives.
The SL model in the general form can be specified as follows:
The SE model is specified as:
The econometric model proposed for this analysis builds on previous literatura that treats location decisions as a function of selected area characteristics (Coughlin et al., 1991; Jordaan, 2009). Empirical studies usually apply FDI inflows as the dependent variable to explain location factors associated with foreign firms. However, as Jordaan (2009) points out, using total FDI inflows may create aggregation bias and measurement errors since it is typical for a few FDI projects to account for the vast amount of total foreign investment in a host country. For this reason a unique database with the total number of Japanese firms by state was constructed.
Following previous findings on location factors from JFDI the model incorporates variables to account for regional characteristics at a state level that may be influencing the location decision of Japanese firms. Specifically, the model accounts for regional demand factors (GDP per capita and population); regional production costs (education levels); regional policies (transportation infrastructure and presence of industrial parks) and regional presence of agglomeration economies (total number of firms in a state). Also, to control for the strategic location of each state, the distance in kilometers from the state capital to the closest U.S. border city is included. The model thus takes the following form:
where:
JAPi |
Total number of Japanese firms in state i |
GDPPCi |
Natural log of GDP per capita in constant 2010 prices in state i |
POPi |
Natural log of total population in state i |
EDUCi |
Natural log of total population over 18 with a bachelor in state i |
HIGHWAYi |
Natural log of total kilometers of highways and paved roads in state i |
PARKi |
Total number of industrial parks in state i |
AGGLOMERATIONi |
Natural log of total number of films in state i |
DISTANCEi |
Natural log of kilometer distance between capital city of state I and closets U.S. border city |
Ԑi |
Error term |
i |
1 … 32 states in México |
The model specified in equation 13 was estimated for the 32 Mexican states. The dataset used for the analysis required a detailed number of Japanese firms by state in Mexico and was compiled from two sources. Primarily from the Toyo Keizai directory 2014 and 2015;4 complimentary information was gathered from Japan’s Chamber of Commerce and Industry directory 20155. In total 457 firms in all industries distributed in 12 Mexican states were aggregated in the dataset.
For the case of the independent variables, all observations are at the state level for the year 2010. The data was obtained from Mexico’s National Statistical Office (INEGI). Specifically, from the 2013 Statistical and Geographical Yearbook of Mexican States published by INEGI,6 from the 2010 Population Census from INEGI7 and from Mexico’s Secretariat of Economy.8
Results
Figure 1 shows the natural breaks map of Japanese firms for different states in Mexico. The map shows the spatial distribution and concentration of economic activity by Japanese companies. Two states concentrate 45% of all Japanese firms in Mexico, Guanajuato (17%) and Distrito Federal (28%). In general, we can observe concentration in the center, northeast and northwest regions in Mexico. The southern part of the country, which has historically been characterized by lower growth rates of economic activity and not attractive to foreign investment, exhibits no presence of Japanese firms. In total 20 out of 32 states indicate no presence of JFDI. The concentration of the 457 Japanese firms in Mexico in 12 states seems to corroborate the preference for JFDI to agglomerate and form clusters in certain regions (Belderbos and Carree, 2002; Kakihara and Guzman-Anaya, 2014).
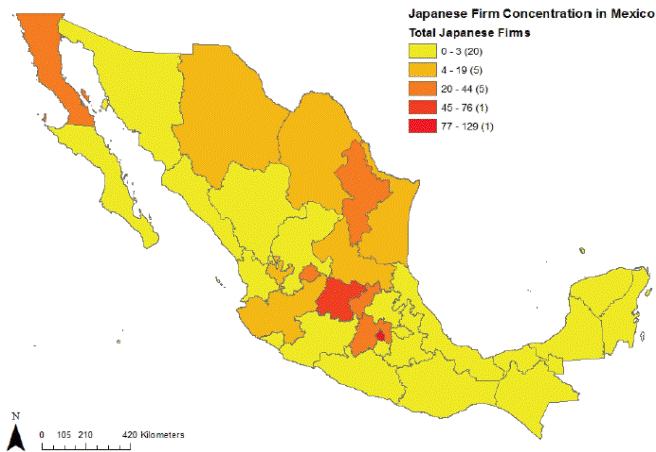
Source: Author’s calculations using the statistical spatial data analysis software “Geoda” based on information from Toyo Keizai directory 2014 and 2015; Cámara Japonesa de Comercio e Industria de México (2015).
Figure 1 Natural Breaks Map of Japanese Firms in Mexico
After a visual representation of the data, the Moran I and the Local Moran I (LISA) were estimated to test for spatial correlation within the data. Table 1 presents the results for the Moran’s I statistic. The results show no presence of spatial autocorrelation for the JAP, POP, EDUC, HIGHWAY and AGGLOMERATION variables. However, a positive and statistical significant spatial autocorrelation is observed in the GDPPC and PARK variables.

Source: Author’s calculations using the statistical spatial data analysis software “Geoda” based on information from Toyo Keizai directory 2014 and 2015; Cámara Japonesa de Comercio e Industria de México (2015).
Table 1 Moran’s I Test for Spatial Correlation
The dependent variable in the model does not seem to have spatial autocorrelation; however there still might be presence of local clusters formed by Japanese firms in specific states. In this sense, further analysis of local spatial autocorrelation for this variable was performed using the LISA statistic. The results are presented in figure 2 and figure 3. Specifically, figure 2 displays statistical significant states that present spatial clusters; five states exhibit local spatial autocorrelation with a significance level of 0.05 and three with a level of 0.01 respectively. Interestingly, the spatial cluster is shown in southern states of Mexico, where Japanese firms are not present. In figure 3 it can be observed that most statistically significant states have a “low-low” type of clustering, meaning that not only does these states fail to attract Japanese firms, but this unattractiveness for investment spills over to neighboring states. The results seem to indicate that the data exhibits some type of spatial autocorrelation that needs to be controlled for in the econometric model.
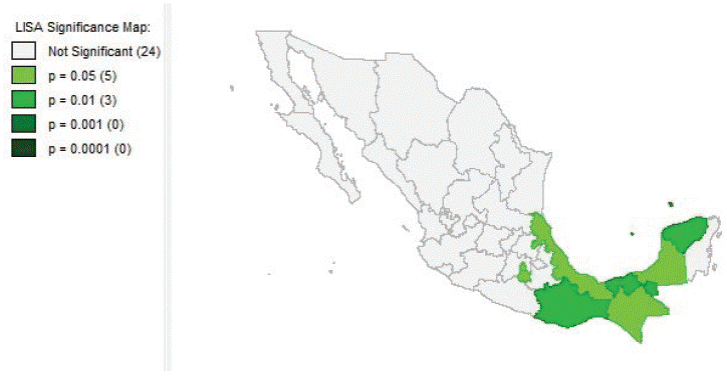
Source: Author’s calculations using the statistical spatial data analysis software “Geoda” based on information from Toyo Keizai directory 2014 and 2015; Cámara Japonesa de Comercio e Industria de México (2015).
Figure 2 LISA Significance Map for Japanese Firms in Mexico
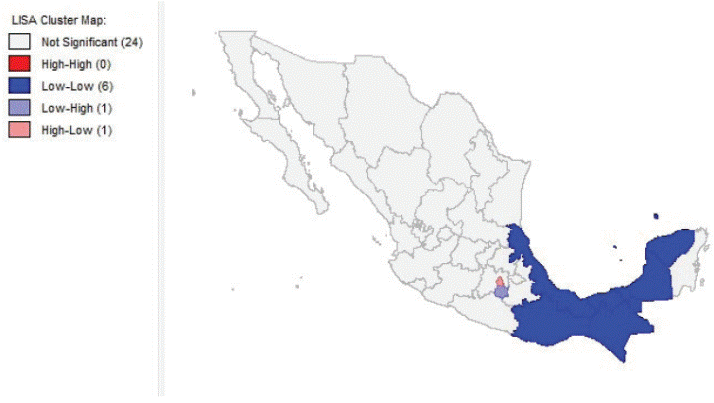
Source: Author’s calculations using the statistical spatial data analysis software “Geoda” based on information from Toyo Keizai directory 2014 and 2015; Cámara Japonesa de Comercio e Industria de México (2015).
Figure 3 LISA Cluster Map for Japanese Firms in Mexico
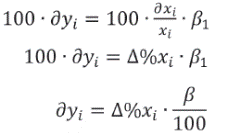
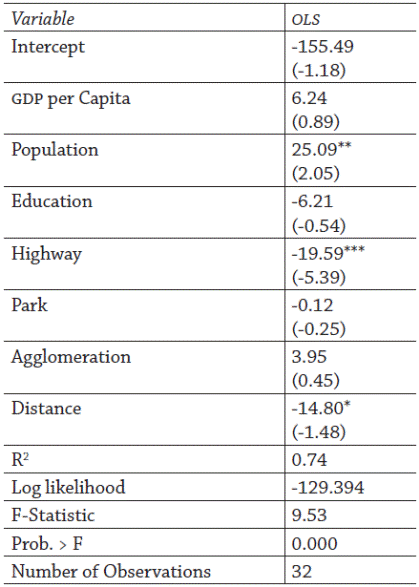
Before performing spatial regression analysis, OLS estimation was carried out. The results from the estimated OLS model are summarized in table 2. Results showed that the POP and HIGHWAY coefficients were statistical significant from this regression. Since we are dealing with a level-log type of regression, the coefficients have to take the following transformation for interpretation:
Multiplying equation 16 by 100 we get:
Note: t-ratios are in parenthesis under each coefficient.
* Significant at the 0.10 level.
** Significant at the 0.05 level.
*** Significant at the 0.01 level.
Table 2 OLS Estimation of Location Factors of Japanese FDI in Mexico
As shown in specification 1 (table 2) the coefficient for the population variable was positive and statistically significant. Results shows that a 1% increase in population (ceteris paribus) yields a 0.25 increase in the number of Japanese firms, suggesting that more populous states are preferred. As Guzman-Anaya (2015) points out, this might be explained by the preference of Japanese FDI to locate in areas with higher potential labor markets. The HIGHWAY variable on the other hand, is associated with a negative relationship with respect to Japanese companies. Specifically, a 1% increase in the highway stock of states is associated with a decline of 0.2 firms. This last result is at odds since it is expected that states with better transportation infrastructure to be more attractive to Japanese companies. However, the results might indicate that Japanese firms in Mexico are locating in greenfield investment sites where transportation infrastructure is not fully developed. As Mair, Florida and Kenney (1988) mention, the main concern in the location selection of JFDI is the implementation of just-in-time production processes, where a trade-off between greenfield sites that have a more amenable workforce and proximity to major production hubs exists. From the results, it seems JFDI is drawn to greenfield sites with access to a vast and manageable workforce.
Also, from the reported results, the distance to the U. S. is marginally statically significant with the expected negative sign. From the negative coefficient, the results indicate that states that are closer to the U. S. are more attractive to Japanese investment and reflect the importance of the U. S. market and the need for trade and production networks with the neighboring country for JFDI location.
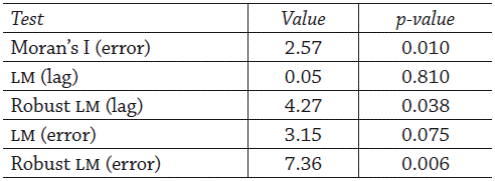
Having the OLS results, a diagnostic for spatial dependence was carried out using the Moran’s I test, the LM lag and LM error test with their specific robust versions. If the results from these tests fail to reject the null hypothesis, then we accept the OLS regression, concluding that there is no interdependence among the states analyzed. For the present analysis, this would imply that the number of Japanese firms and their arrival to specific states depend on endogenous factors from those states. The results from these tests are presented in table 3.
Note: Calculations based on a row standardized weights matrix with a queen type of contiguity using the statistical spatial data analysis software “Geoda” and based on information from Toyo Keizai directory 2014 and 2015; Cámara Japonesa de Comercio e Industria de México (2015).
Table 3 Diagnostics for Spatial Dependence
From table 3 we can conclude spatial dependence in the data. Deciding between the SE and SL models depends on a comparison between the different tests. The results show that Moran’s I error test and the LM error and Robust LM error test are all statistically significant. On the other hand, only the Robust LM lag is statistically significant. Also, Moran’s I and the Robust LM error have p-values lower than the LM lag and Robust LM lag tests, indicating that for this data the SE model should be estimated (Romero and Andrés-Rosales, 2014).
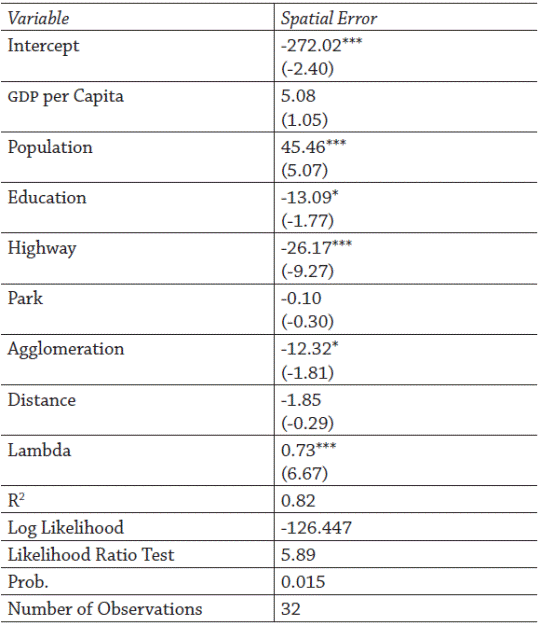
The estimation results of the SE model are presented in table 4. The lambda coefficient for the spatial lag of the error terms is positive and highly significant indicating a strong spatial dependence in the errors. In other words, states with presence of Japanese firms will affect the presence of Japanese firms in neighboring states that are above of what can be considered as “normal”. However, it is also possible to interpret the existence of spatial dependence in the error terms as a specification problem, where a variable with spatial characteristics that has not been identified is excluded from the model. Either way, it is better to estimate the SE model over the OLS alternative, since an improvement is obtained from incorporating the spatial correlation among the errors (Romero and Andrés-Rosales, 2014).
Note: z-values are in parenthesis under each coefficient.
* Significant at the 0.10 level.
** Significant at the 0.05 level.
*** Significant at the 0.01 level.
Table 4 Spatial Error Model Estimation of Location Factors of Japanese FDI in Mexico
Comparing between the OLS and the SE models, there is an improvement of fit for the SE alternative. It is important to point out that traditional measures of goodness-of-fit such as the R2 are not appropriate for the case of spatial regression models. The value mentioned in the SE output is not a real R2, but rather a pseudo-R2, value that is not comparable with the measure given by the OLS regression. For this case the proper measures of fit are the Log-likelihood values for both specifications. From both regressions, there is an increase in the Log-likelihood from -129.394 (OLS) to -126.447 (SE), suggesting an improvement of fit from the SE model.
The coefficients from the SE model explain the relationship between independent and dependent variables once the spatial effects are controlled for. The results remain consistent for the population and transportation infrastructure variables. Specifically, a 1% increase in population is associated with an increase of 0.45 Japanese firms. Once controlling for the spatial effects, there is an increase of 0.2 more firms per 1% increase in population between the OLS and the SE alternatives. For the case of the HIGHWAY variable, once again a negative relationship is observed; a 1% increase in the highway stock is associated with a 0.26 Japanese firm drop. These results confirm the OLS findings and suggest that Japanese firms prefer greenfield locations that have access to labor pools.
Also, from the SE model the education and agglomeration variables are marginally statistically significant and both exhibit negative coefficients. The negative sing in the agglomeration variable further supports the location preference of JFDI in Mexico for greenfield sites, and the negative relationship from the education variable seems to provide additional evidence for locations with labor pools that are more manageable and responsive to Japanese training.
The results must be taken with caution. Although, Smith and Florida (1994) argue that traditionally JFDI has located in rural, greenfield investment sites, previous findings from Guzman-Anaya (2015) indicate that Japanese automotive firms in Mexico opted for locations with a larger market size, larger population, higher wages, and with presence of agglomeration economies. Also, other findings from studies on JFDI location choice have contradicted the greenfield location hypothesis, showing that Japanese investors seem to avoid greenfield investment sites and are drawn to locations with high manufacturing density and transportation infrastructure (Woodward, 1992; Zhou et al., 2002; Wakasugi, 2005).
From the results reported in this study, it is important to point out that searching for location determinants from JFDI at a state level might be leading to estimation problems since the spatial component might be better observed at a more disaggregated level (e. g. municipality or urban areas) and in specific industries (e. g. automotive).
Conclusions
With the implementation of the EPA between Mexico and Japan, FDI flows to Mexico increased, especially since 2012. However, research on the determinants of the location decision of Japanese firms within Mexico has been scarce. This paper attempted to fill-in this gap in the literature and analyzed the location decision of Japanese firms in Mexico, incorporating certain macro dimensions and a spatial component in the study. The research was conducted at a state level with a unique database of Japanese firms in Mexico and used spatial econometric tools to test the effects of regional characteristics in the location decision of JFDI and the presence of spatial components in the data.
The results from the analysis showed that Japanese firms are concentrated in the center, northeast and northwest regions of Mexico where the states of Guanajuato and Distrito Federal in particular account for 45% of total Japanese firms. These results seem to indicate a preference for JFDI to agglomerate and form clusters in certain regions. Analysis performed through Moran’s I test for spatial autocorrelation did not find spatial dependence for the Japanese firm variable. However, a positive and statistical significant spatial autocorrelation was observed in the GDP per capita and industrial park variables.
Since local clusters formed by Japanese firms in specific states might be present, a local spatial autocorrelation test through the LISA statistic was performed. The results showed that five states exhibit local spatial autocorrelation with a significance level of 0.05 and three with a level of 0.01 respectively. The presence of a spatial cluster was observed in southern states of Mexico, meaning a “low-low” type of clustering.
Results from the econometric model showed that Japanese firms prefer more populous areas associated with a larger market and a greater labor pool. The results also indicate a negative relationship with the transportation infrastructure variable, suggesting the preference for greenfield investment sites. However, further analysis should be carried out using different measures of transportation infrastructure to corroborate these results. Also, the closeness of the state to the U. S. seemed to be an important determinant in the location of JFDI. This suggests a pulling effect from the U. S. market and the importance of trade and production networks within Mexico and the U. S. for the location of Japanese firms.
After conducting diagnostics for spatial dependence, the results indicated that the SE model was appropriate for this data with an improvement of fit compared to the OLS alternative. The spatial lag of the error terms was positive and highly significant indicating a strong spatial dependence in the errors. This could mean that presence of Japanese firms is affecting the presence of Japanese firms in neighboring states that are above of what can be considered as “normal” levels. However, this can also mean a specification problem, where a variable with spatial characteristics that is not accounted for has been excluded from the model.
From the SE model, the results from the OLS specification were confirmed. Japanese firms are drawn to greenfield locations that might exhibit low levels of transportation infrastructure development, but have access to labor pools. Furthermore, the education and agglomeration variables indicated negative effects in attracting JFDI at the state level. The results from the agglomeration variable further support the location preference of JFDI for greenfield sites, and the negative relationship with respect to the education variable seems to provide evidence for a location preference where the workforce might me more manageable and responsive to Japanese training.
Future research on JFDI location determinants in Mexico is encouraged. Future research should conduct the analysis at a more disaggregated level (e. g. municipalities), in certain economic industries (e. g. automotive) and incorporating the time component in the analysis. This specificity should turn out more statistical robust results and shed more light on the regional characteristics and spatial dependence that explain the agglomeration and location decisions of JFDI in host countries.


 nova página do texto(beta)


