The Sierra Madre Oriental is an orogenic belt that has been under high ground pressure throughout time, including small-scale earthquakes (Montalvo-Arrieta et al. 2010). Furthermore, the recent increase of rainfall episodes has triggered instability areas on the slopes and as a result, soil erosion and sediment-related disasters (Sánchez-Castillo et al. 2017). This plays an important role on the slopes of this orogenic belt, making areas like the one in this study prone to landslide disasters. Soil erosion is an important cause of land degradation in the Tamaulipan thornscrub region. For this reason, it is important to propose mitigation measures for both study areas through soil bioengineering practices.
Biotechnical stabilization and soil bioengineering stabilization both entail the use of live materials, specifically vegetation. Biotechnical stabilization utilizes mechanical elements (or structures) in combination with biological elements (or plants) to arrest and prevent slope failures and erosion (Gray & Sotir 1996). Plants provide most of the ecosystem coverage and are an active element of nutrient cycles (Begon et al. 1990, Friedel et al. 2000). Vegetation increases protection and decreases erosion in urbanized forest areas. The application of vegetative measures to restore the affected sites could be significant as they are ecologically friendly, low in costs, and easy in techniques (SánchezCastillo 2015).
Roots of forest species increase the shear strength of soil mainly by transferring shear stresses that develops in the soil into tensile resistance, when the shear of the slope makes the fiber deform through elongation (Sánchez-Castillo et al. 2017). This provides enough interface friction and confining stress to lock fiber in place and prevent slippage or pull-out (Gray & Ohashi, 1983). Root tensile strength is an important index for determining soil reinforcement (Genet et al. 2005).
In northeast Mexico, in the urban areas near the mountain range, there are problems with landslides and debris flow. The government and the landowners hardly enter mutual agreements to address such issues. For this reason, a proposal would give to landowners the option of planting native trees to mitigate the slope instability problems that may arise in their lands. A fundamental resource to achieve the above is to consider plant species that have the potential to grow in steep sites.
Many studies have been conducted to evaluate the mechanical properties of plant roots (Abdi et al. 2010, Burylo et al. 2011, Vergani et al. 2014). In this study, three of the most important root mechanical properties related with slope stability were measured in ten native tree species of two different ecosystems of Nuevo Leon. Therefore, the objective of this research was to estimate the values of maximum force to breakage (N), tensile strength (N/mm2) and modulus of elasticity (N/mm2) of studied species, establishing the differences between the values by species, diametric category, and ecosystem. The characterization of the mechanical properties of native species will allow us to establish the species with higher values as a potential element on soil bioengineering in the prevention of disasters.
Materials and methods
Study area. The study area is located in two sites in the state of Nuevo Leon, Mexico. Site 1 is located in the experimental forest station “Bosque Escuela” in a Pine-Oak forest at Iturbide, Nuevo Leon (24° 43’ N & 99° 52’ W). According to García (1981), the predominant climate in the area is type A (Tropical); Cs (humid temperate with rains in winter). In site 1, average annual rainfall is 620 mm and temperature reach as low as -10 °C. Average annual temperature is 18 °C (Marmolejo 2000, Cantú-Silva & González-Rodríguez 2002). The soil type that predominates in the study area corresponds to Kastañozem calcium class, with high mineral nutrient contents of K, Fe, Mn, Cu and low contents of Zn and P. The predominant soil pH in the area is moderately alkaline (7.5 - 8.5), with low content of organic matter and nitrogen (Cantú-Silva & González-Rodríguez 2002).
Site 2 is located in Linares, Nuevo Leon, (25° 09’ N & 99° 54’) at the Faculty of Forest Sciences Campus. The site where the study was conducted is a fragment of the vegetation (tall trees and shrubbery), that belongs to the Tamaulipan thornscrub region (Rzedowski 1978, Garrett 2002). This thornscrub is distributed in northeastern Mexico and southern Texas, covering an area of more than 200,000 km2 (Alanís-Rodríguez et al. 2008). According to the classification of García (1981), the climate type in the study area is a subtropical and semiarid climate (Cs) with temperatures of up to 45 °C during the summer and an average temperature of 14.7 to 22.3 °C, with an average annual rainfall of 805 mm (Yáñez et al. 2014).
Selection of species: The selection of species was made considering their native characteristics: natural distribution, abundance and presence in hillside areas. Five to ten individuals per species were selected. In each of the two sites, different conditions such as soil depth (Site 1 from 40 cm to 1.5 meters, Site 2 from 3 to 5 meters), were found. The species order is showed below according to their community:
Site 1. Pine-Oak Forest (Experimental forest station, Iturbide). 1) Quercus rysophylla Weath. Evergreen tree, which can reach 25 m in height. The leaves are alternate, simple, rigid, and elliptical measuring 7 to 25 cm long and between 2 and 8 cm wide. When the leaves mature they are smooth, bright and dark green on top. The acorns are oval and mucronate. Their length ranges from 1 to 1.7 cm, alone or in pairs, sessile. The dome of the acorns is of a golden color when young (Nixon 1998). 2) Pinus pseudostrobus Lindl. It is known as pacingo and mocochtaj (Tojolobal language), white pine, ocote, pine canis, and real pine. It is a native perennial species from Mexico from the temperate forest region, growing at altitudes ranging between 1,300 and 3,250 m. They usually measure 3-45 meters in height and their trunk is straight and with a diameter from 40 to 80 cm (Farjon 2013). 3) Quercus canbyi Trel. Is a species of the genus Quercus belonging to the family of the Fagaceae. Evergreen, it has a pyramidal shape when young and an irregular shape once it matures. Normally it will reach 12 to 15 m in height. Its leaves are 15 to 20 cm long and from 5 to 7 cm wide with dark edges and bright green (Trencheva 2008). 4) Quercus polymorpha Schltdl. & Cham. occurs in deep canyons of the Sierra Madre in northern Mexico, southward to Guatemala and north to the borderlands of West Texas. It is widespread in many states of Mexico (Nuevo León, Tamaulipas, San Luis Potosí, Querétaro, Hidalgo, Veracruz, Puebla, Oaxaca, Chiapas, Coahuila, Guanajuato, Jalisco, Sinaloa, Michoacán and Morelos). It is vulnerable to habitat loss and degradation in many ecosystems where it is found. Cloud forests are particularly at risk of habitat degradation due to climate change, as well as to severe threat fragmentation owing to deforestation (Jerome 2017). 5) Arbutus xalapensis Kunth gray in color; it grows like an evergreen tree. It is a shrub that usually reaches 6-11 m in height, it can reach up to 12 m in height, it is 9.3 m in circumference and 13 m in the crown spread at favorable sites. The oldest bark is dark brown, gray, or black. The young bark can be white, orange, or pink. (Ramírez-Marcial & GonzálezEspinosa 1998).
Site 2. Tamaulipan thornscrub (Faculty of Forest Sciences Campus). 6) Acacia farnesiana (L.) Willd. Prickly bush or small tree, evergreen or semi-deciduous, from 1 to 2 m in height in its shrub form, and from 3 to 10 m in its arboreal form, with a diameter at breast height of up to 40 cm. Rounded cup. Short and thin trunk, well defined or branched from the base with numerous stems. Upward and sometimes horizontal branches, with thorns of 6 to 25 mm in length. External surface smooth when young and fissured when old, gray to dark brown gray in color (Maslin 2018a). 7) Acacia berlandieri (Benth.) Seigler & Ebinger. It is a native shrub in northeastern Mexico and southwestern United States. It belongs to the subfamily Mimosoideae of Fabaceae. It grows from 1 to 5 meters high with spherical white flowers. The flowering season is from February to April. The flowers of white to cream color (yellowish with age) grow in the form of balls, 5/8 inches or more in diameter, and are quite fragrant. The leaves are composed and reach 13 to 20 cm long with pairs of leaflets that grow up to 12 to 22 cm (sometimes up to 45 cm) in length. These leaflets are divided again into 30-50 (Hatch et al. 1990). It is generally found in the slopes of the mountainous range of Northeast of Mexico (Maslin 2018b). 8) Acacia rigidula Benth. Commonly known as Black brush acacia or Chaparro Prieto; it is a species of shrub or small tree in the legume family. It has a distribution through America, Mexico and United States (Texas). This perennial is not listed as being threatened. It reaches a height from 1.5 to 4.6 m. Black brush acacia grows on limestone hillsides and canyons (Maslin 2018c).
9) Cordia boissieri A. DC. Subtropical tree with short branched trunk, always green from 182.4 to 364.8 centimeters high. The leaves are green, large (7.7-12.7 cm in length and 7.7-10.2 cm in width), soft, with velvet and brown at the bottom. The flowers are white-yellow in the form of trumpets of 5.2 to 7.6 cm in diameter, and are produced throughout the summer, especially after the rains from April to June. The whitish fruit ripens from July to September and is 2.6 cm long (Hassler 2018). 10) Havardia pallens Britton & Rose. It is a shrub or small tree from 3 to 6 m high. The trunk has thorns and the bark is smooth, gray to reddish. The leaves are grayish green, bipinnate, 10 to 15 cm long, with 7 to 20 pinnas (pairs of leaflets), each with 30 to 40 leaflets. The flowers are fragrant and have a cream color, from 1.3 to 2.5 cm in diameter, blooming between May to the middle of September. The fruit is a flat brown pod from 5 to 12 cm in length (Roskov et al. 2018).
Sampling method. In each of the sampling sites the individuals were randomly selected with approximately five meters of minimum distance between them. Fifty root samples per species from an exposed root system were extracted, sampling five individuals per species from each of the ten species tested. This to consider the percentage that is discarded in the experiment due to damages or failed tests.
Preparation of root samples for analysis. The roots were extracted from exposed root systems with least disturbance in the area. The samples were cut, carefully packed, and stored in paper bags. In order to preserve their moisture content, they were stored in a cooler container from the moment of extraction and transported to the Soil Laboratory of the Forest Sciences Faculty for further tests. In the laboratory, damaged roots were discarded, and the root samples were classified by diameter range: from 0.1 to 2.9 mm, from 3 to 5.9 mm and from 6 to 10 mm, and a maximum diameter up to 10 mm. They were cut to approximately 10 cm in length and individually labeled for further testing.
Tensile strength test. In the laboratory, the test was conducted with a total of 300 segments: 30 per species, and 10 per diameter class (Category 1: from 0.1 to 2.9 mm, Category 2: from 3 to 5.9 mm, and Category 3: from 6 to 10 mm). Test were carried out using a Universal Testing Machine SHIMADZU type SLFL-100Kn. Root samples were clamped and pulled at a constant speed of 10 mm/min. After each test, the sample diameter was measured. Data was visualized using the material testing operation software Trapezium. The applied force required to break the root was taken as a measurement of root breakage to calculate tensile strength.
Where: Fmax is the maximum force to root breakage (N) and D is the average root diameter (mm) (Mattia et al. 2005, Genet et al. 2005, Bischetti et al. 2005, De Baets et al. 2008).
Elastic properties of each root sample were determined using the modulus of elasticity (Eroot) as:
Where: Fmax is the maximum force applied to the object under tension, A0 is the original cross-sectional area, CE is the change of length of sample and L0 is the original length (Ammann et al. 2009).
Statistical analysis. Data was analyzed using the Statistical Program for Social Sciences (SPSS) standard version 13.0 for Windows (SPSS Inc., Chicago, IL.). Since all data did not show the assumptions of normal distribution, these were analyzed using the nonparametric Kruskal-Wallis test (Steel & Torrie 1980). To analyze tensile strength and modulus of elasticity values for each species, the Mann-Whitney U non-parametric test without correction at a p = 0.05 was applied. Power regression models were generated for the correlation between the species with the tensile strength and the modulus of elasticity (p < 0.01).
Results
A total of 260 samples were successfully tested: 26 for Acacia farnesiana, 30 for Cordia boissieri, and 26 for Havardia pallens, 28 for Acacia rigidula, 23 for Acacia berlandieri, 30 for Arbutus xalapensis, 30 for Pinus pseudostrobus, 30 for Quercus canbyi, 17 for Quercus polymorpha, and 30 for Quercus rysophylla. Tension tests were conducted successfully on 85 % of the total collected samples. The remaining 15 % failed by root system damage instead of the applied tension, that is attributed to tests discarded by breaking at the ends or by displaced bark. Details of the mechanical properties obtained may be observed in Table 1.
Table 1 Maximum, minimum and average values of maximum force to root breakage (Fmax), tensile strength (Ts) and modulus of elasticity (Eroot) of the ten species analyzed.
| Fmax (N) | Ts (N/mm2) | Eroot (N/mm2) | |||||||
|---|---|---|---|---|---|---|---|---|---|
| Species | Max. | Min. | Avg. | Max. | Min. | Avg. | Max. | Min. | Avg. |
| A. farnesiana | 743.75 | 18.75 | 164.93 | 22.94 | 14.01 | 12.43 | 229.30 | 14.31 | 86.70 |
| C. boissieri | 128.13 | 15.63 | 46.04 | 7.77 | 1.86 | 4.45 | 122.82 | 9.38 | 73.01 |
| H. pallens | 500.00 | 25.00 | 137.93 | 28.87 | 8.81 | 10.03 | 163.67 | 7.12 | 79.77 |
| A. rigidula | 971.88 | 34.38 | 180.06 | 44.65 | 13.71 | 20.54 | 169.84 | 15.90 | 97.31 |
| A. berlandieri | 809.38 | 25.00 | 290.00 | 21.03 | 14.92 | 22.12 | 298.81 | 27.50 | 127.39 |
| A. xalapensis | 475.00 | 37.50 | 138.95 | 14.73 | 7.68 | 9.07 | 368.91 | 12.75 | 104.92 |
| P. pseudostrobus | 465.63 | 31.25 | 139.27 | 15.34 | 6.79 | 9.24 | 309.41 | 10.14 | 102.30 |
| Q. canbyi | 606.25 | 21.88 | 234.17 | 26.25 | 12.06 | 14.07 | 360.26 | 6.41 | 99.42 |
| Q. polymorpha | 996.88 | 18.75 | 218.08 | 23.40 | 16.84 | 11.34 | 185.28 | 30.31 | 64.86 |
| Q. rysophylla | 975.00 | 56.25 | 301.25 | 31.83 | 12.66 | 19.27 | 154.55 | 53.81 | 113.95 |
The ranking of species by average tensile strength is as follows: Acacia berlandieri> Acacia rigidula> Quercus rysophylla> Quercus canbyi> Acacia farnesiana> Quercus polymorpha> Havardia pallens> Pinus pseudostrobus> Arbutus xalapensis> Cordia boissieri (Table 2).
Table 2 Tensile strength (Ts) and modulus of elasticity (Eroot) of the ten species analyzed by diametric category (CI = 0.1 to 2.0 mm, CII = 3 to 5.9 mm and CIII = 6 to 10 mm) and average.
| Ts(N/mm2) | Eroot (N/mm2) | |||||||
|---|---|---|---|---|---|---|---|---|
| Species | CI | CII | CIII | Avg. | CI | CII | CIII | Avg. |
| A. farnesiana | 16.02 | 11.63 | 8.44 | 12.03 | 137.29 | 57.64 | 14.93 | 69.95 |
| C. boissieri | 8.83 | 3.40 | 1.11 | 4.45 | 128.32 | 39.50 | 12.63 | 60.15 |
| H. pallens | 20.18 | 4.39 | 4.09 | 9.50 | 117.06 | 63.26 | 19.55 | 66.62 |
| A. rigidula | 43.63 | 10.99 | 5.51 | 20.04 | 159.24 | 99.01 | 23.07 | 93.77 |
| A. berlandieri | 31.52 | 19.83 | 10.25 | 22.53 | 242.70 | 81.18 | 41.01 | 121.63 |
| A. xalapensis | 12.18 | 8.39 | 6.63 | 9.07 | 173.47 | 41.74 | 18.37 | 77.86 |
| P. pseudostrobus | 14.99 | 6.95 | 6.79 | 9.57 | 188.50 | 46.49 | 16.64 | 83.88 |
| Q. canbyi | 14.99 | 11.83 | 10.39 | 12.40 | 227.47 | 63.61 | 12.64 | 101.24 |
| Q. polymorpha | 13.42 | 8.74 | 7.88 | 10.01 | 107.90 | 56.92 | 43.59 | 69.47 |
| Q. rysophylla | 25.13 | 18.52 | 14.17 | 19.27 | 133.34 | 114.28 | 63.01 | 103.54 |
Considering the average of all the tensile strength values obtained, the 10 species analyzed ranged from 4.45 N/mm2 in C. boissieri to 22.12 N/mm2 in A. berlandieri. The species are ordered in an ascendant way taking into account their average tensile strength C. boissieri <A. xalapensis <P. pseudostrobus <H. pallens <Q. polymorpha <A. farnesiana <Q. canbyi <Q rysophylla <A. rigidula <A berlandieri.
According to the relationship between the species for diameter variable, Q. rysophylla showed significant differences with all species except Q. canbyi and Q. polymorpha. At the same time, Q. canbyi showed significant differences with all species except H. pallens, Q. polymorpha and Q. rysophylla. Q. polymorpha showed no significant differences with any species. On the other hand, for tensile strength variable (Ts) Q. canbyi showed significant differences with all species except C. boissieri and C. boissieri showed no significant differences with any species except A. xalapensis. For the variable modulus of elasticity (Eroot) Q. rysophylla was the species that showed significant differences with all species except A. berlandieri, A. xalapensis, P. pseudostrobus and A. rigidula (Table 3).
Table 3 p values of the Mann Whitney U test to compare root diameter, tensile strength (Ts) and modulus of elasticity (Eroot) in different species
| vs | Diameter | Ts | Eroot | |
|---|---|---|---|---|
| A. farnesiana | C. boissieri | 0.71 | 0.69 | 0.40 |
| H. pallens | 0.23 | 0.08 | 0.94 | |
| A. rigidula | 0.70 | 0.19 | 0.94 | |
| A. berlandieri | 0.11 | 0.34 | 0.72 | |
| A. xalapensis | 0.90 | 0.19 | 0.93 | |
| P. pseudostrobus | 0.14 | 0.04 | 0.84 | |
| Q. canbyi | 0.01 | 0.00 | 0.19 | |
| Q. polymorpha | 0.59 | 0.25 | 0.38 | |
| Q. rysophylla | 0.04 | 0.55 | 0.04 | |
| C. boissieri | H. pallens | 0.26 | 0.26 | 0.67 |
| A. rigidula | 0.50 | 0.34 | 0.28 | |
| A. berlandieri | 0.24 | 0.81 | 0.15 | |
| A. xalapensis | 0.63 | 0.04 | 0.36 | |
| P. pseudostrobus | 0.40 | 0.06 | 0.39 | |
| Q. canbyi | 0.01 | 0.13 | 0.54 | |
| Q. polymorpha | 0.45 | 0.30 | 0.64 | |
| Q. rysophylla | 0.00 | 0.80 | 0.02 | |
| H. pallens | A. rigidula | 0.36 | 0.82 | 1.00 |
| A. berlandieri | 0.00 | 0.10 | 0.77 | |
| A. xalapensis | 0.55 | 0.23 | 1.00 | |
| P. pseudostrobus | 0.02 | 0.19 | 0.88 | |
| Q. canbyi | 0.14 | 0.00 | 0.39 | |
| Q. polymorpha | 0.59 | 0.64 | 0.48 | |
| Q. rysophylla | 0.02 | 0.03 | 0.03 | |
| A. rigidula | A. berlandieri | 0.03 | 0.28 | 0.31 |
| A. xalapensis | 0.93 | 0.27 | 0.92 | |
| P. pseudostrobus | 0.05 | 0.23 | 0.84 | |
| Q. canbyi | 0.02 | 0.00 | 0.28 | |
| Q. polymorpha | 0.90 | 0.66 | 0.95 | |
| Q. rysophylla | 0.00 | 0.08 | 0.11 | |
| A. berlandieri | A. xalapensis | 0.08 | 0.13 | 0.34 |
| P. pseudostrobus | 0.73 | 0.37 | 0.56 | |
| Q. canbyi | 0.00 | 0.00 | 0.11 | |
| Q. polymorpha | 0.59 | 0.39 | 0.51 | |
| Q. rysophylla | 0.00 | 0.35 | 0.31 | |
| A. xalapensis | P. pseudostrobus | 0.15 | 0.69 | 0.96 |
| Q. canbyi | 0.04 | 0.00 | 0.22 | |
| Q. polymorpha | 0.64 | 0.99 | 0.95 | |
| Q. rysophylla | 0.01 | 0.17 | 0.19 | |
| P. pseudostrobus | Q. canbyi | 0.00 | 0.00 | 0.2 |
| Q. polymorpha | 0.76 | 0.96 | 0.88 | |
| Q. rysophylla | 0.00 | 0.04 | 0.12 | |
| Q. canbyi | Q. polymorpha | 0.14 | 0.01 | 0.32 |
| Q. rysophylla | 0.41 | 0.00 | 0.01 | |
| Q. polymorpha | Q. rysophylla | 0.07 | 0.31 | 0.00 |
If p values are ≤ 0.05, the mean comparison is declared different.
The relationships among root diameter, tensile strength (Ts), and modulus of elasticity (Eroot) are shown in Figures 1 to 10. The relationship found between root diameter and tensile strength (Ts) was negative and could be fitted with a power regression equation, showing highly significant values p < 0.01 (**) for Acacia farnesiana (y = 18.883x−0.32, R² = 0.5619, F = 26.788**), Cordia boissieri (y = 21.596x−1.387, R² = 0.7769, F = 161.574**), Havardia pallens (y = 26.199x−0.9, R² = 0.732, F = 58.960**), Acacia rigidula (y = 52.942x−1.129, R² = 0.5714, F = 30.671**), Acacia berlandieri (y = 35.851x−0.412, R² = 0.606, F = 26.191**), Arbutus xalapensis (y = 18.677x−0.565, R² = 0.693, F = 50.741**), Pinus pseudostrobus (y = 25.443x−0.475, R² = 0.8489, F = 93.041**), Quercus canbyi (y = 25.443x−0.475, R² = 0.8489, F = 171.648**), Quercus polymorpha (y = 14.588x−0.442, R² = 0.4405, F = 7.471**) and Quercus rysophylla (y = 37.93x−0.532, R² = 0.8205, F = 77.302**).
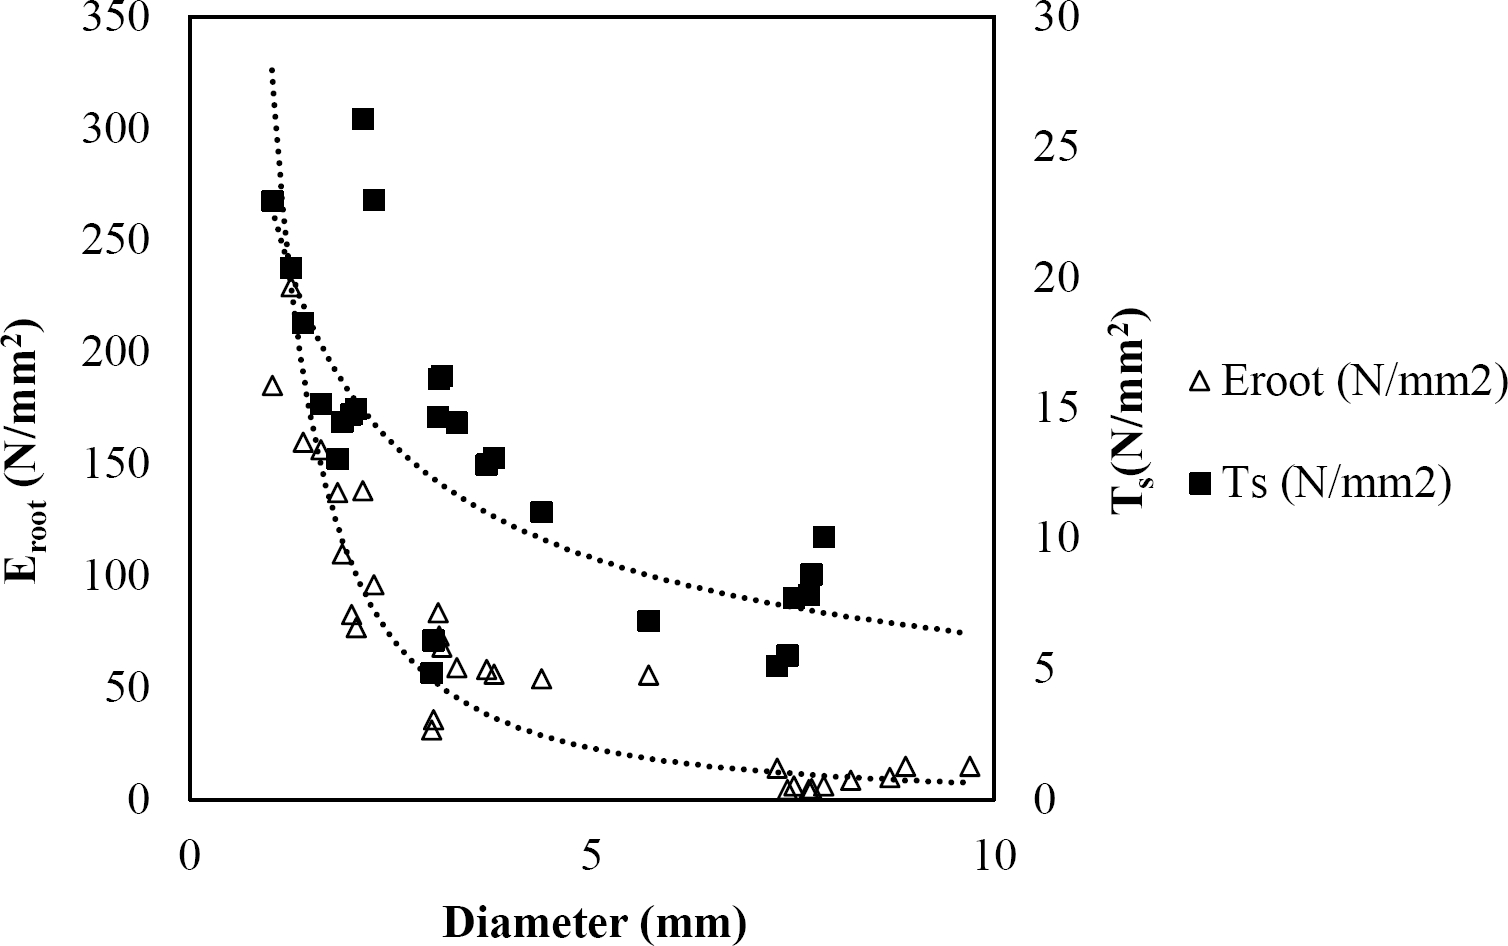
Figure 1 Relationship between diameter of roots, tensile strength (Ts) and Modulus of elasticity (Eroot) for Acacia farnesiana.
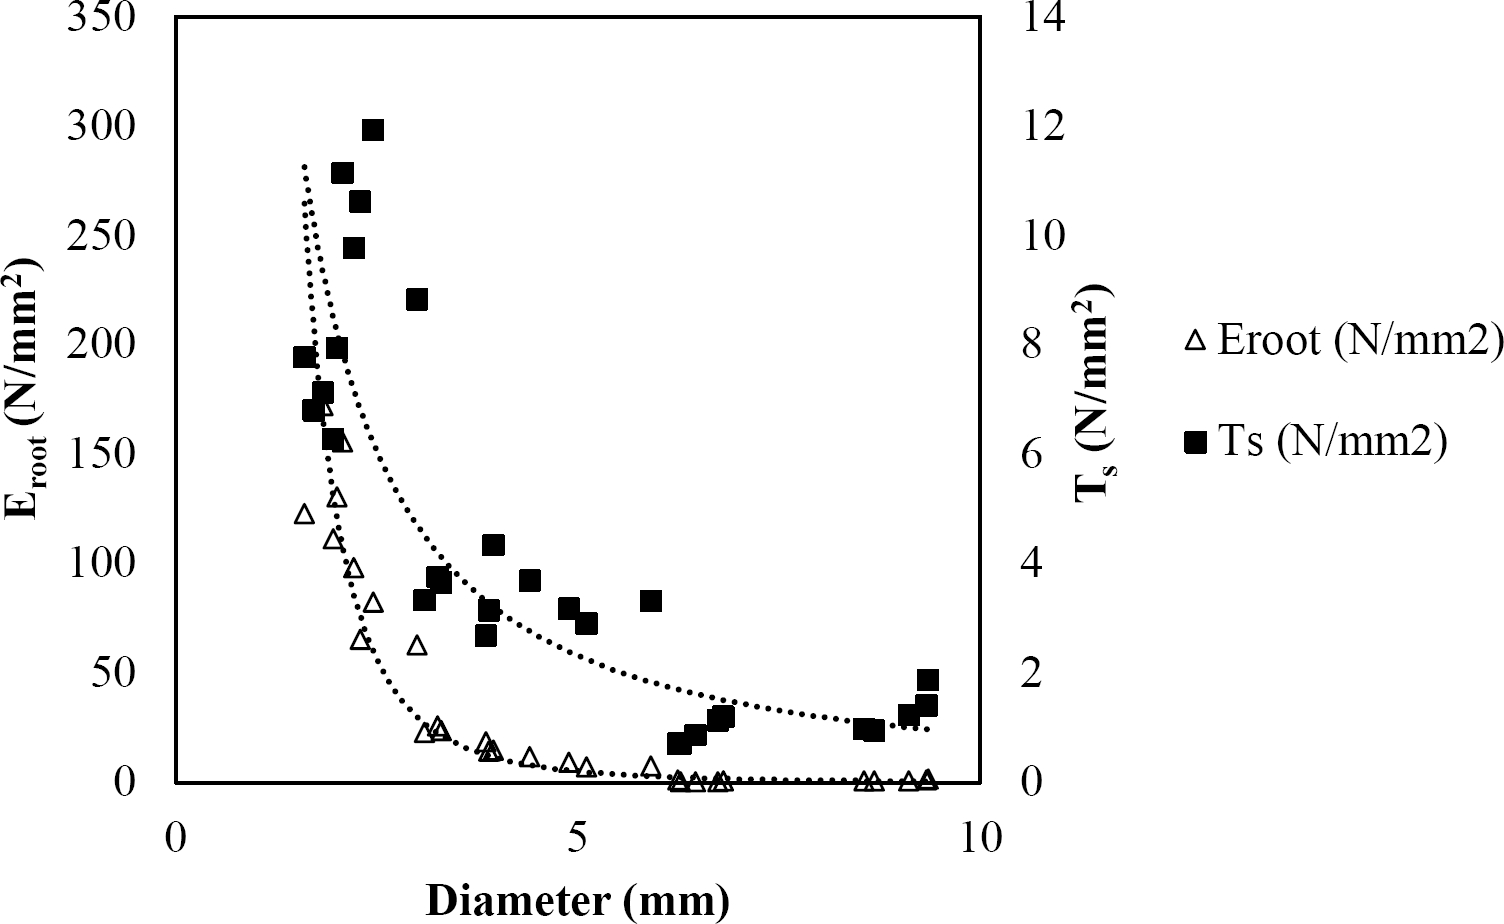
Figure 2 Relationship between diameter of roots, tensile strength (Ts) and Modulus of elasticity (Eroot) for Cordia boissieri.
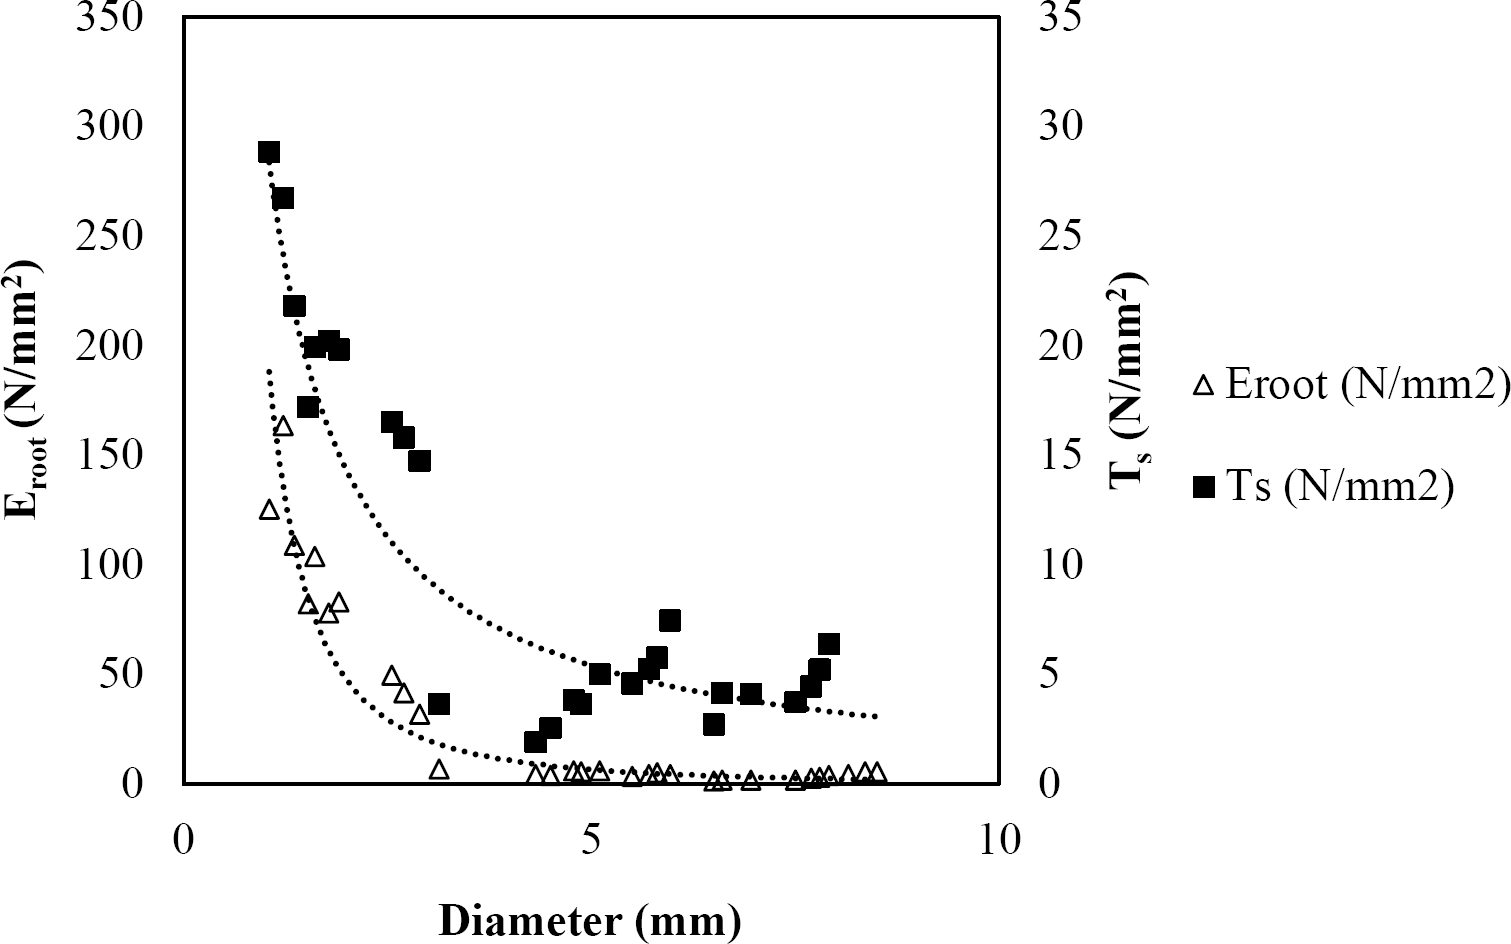
Figure 3 Relationship between diameter of roots, tensile strength (Ts) and Modulus of elasticity (Eroot) for Havardia pallens.
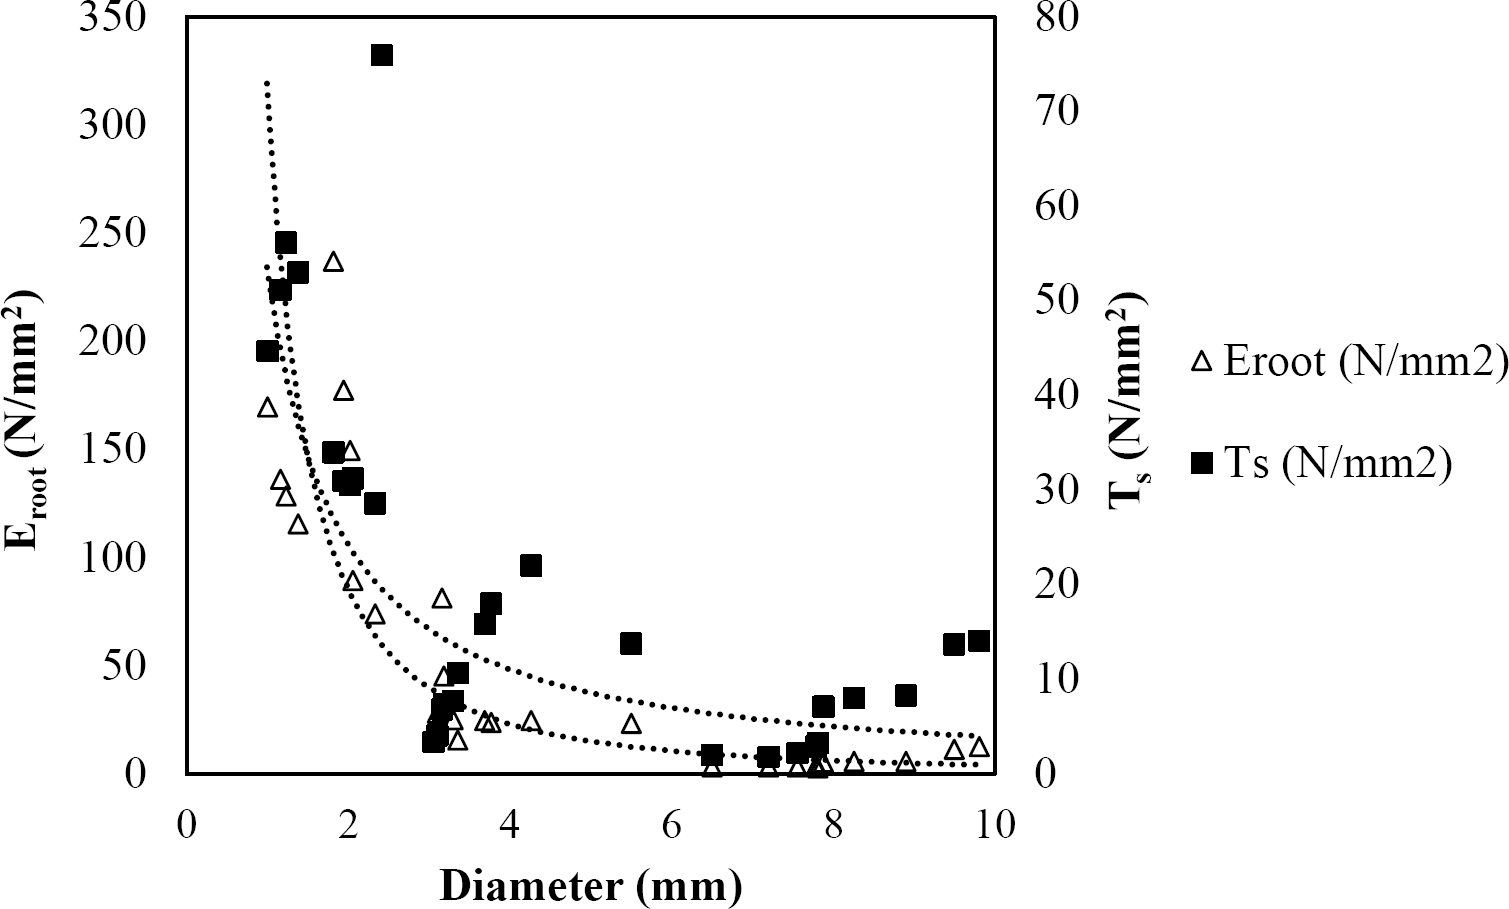
Figure 4 Relationship between diameter of roots, tensile strength (Ts) and Modulus of elasticity (Eroot) for Acacia rigidula.
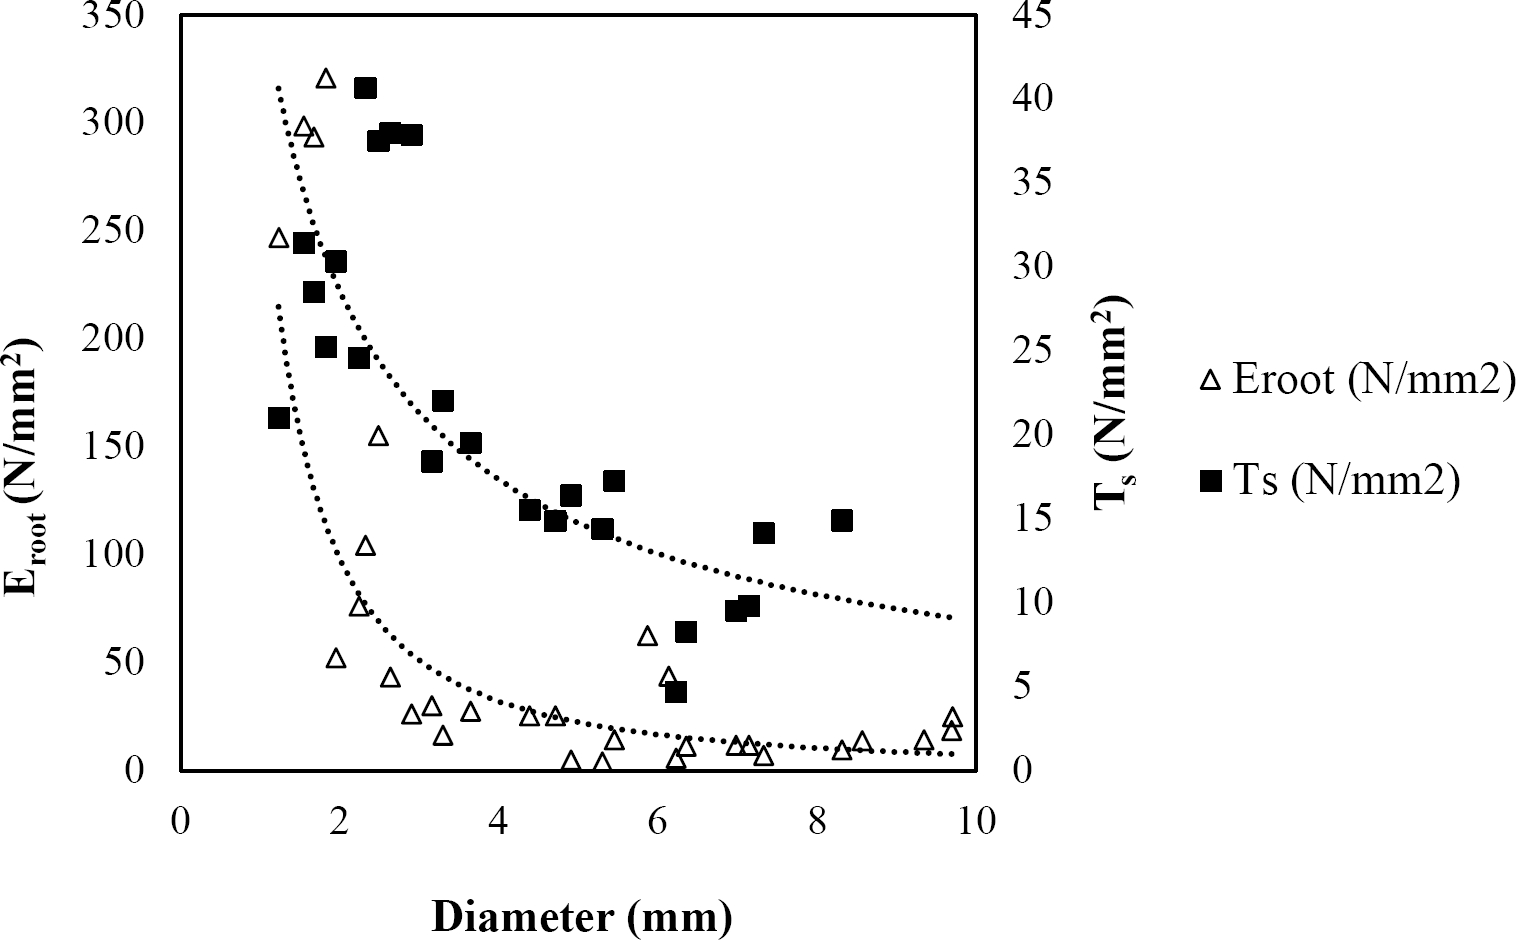
Figure 5 Relationship between diameter of roots, tensile strength (Ts) and Modulus of elasticity (Eroot) for Acacia berlandieri.
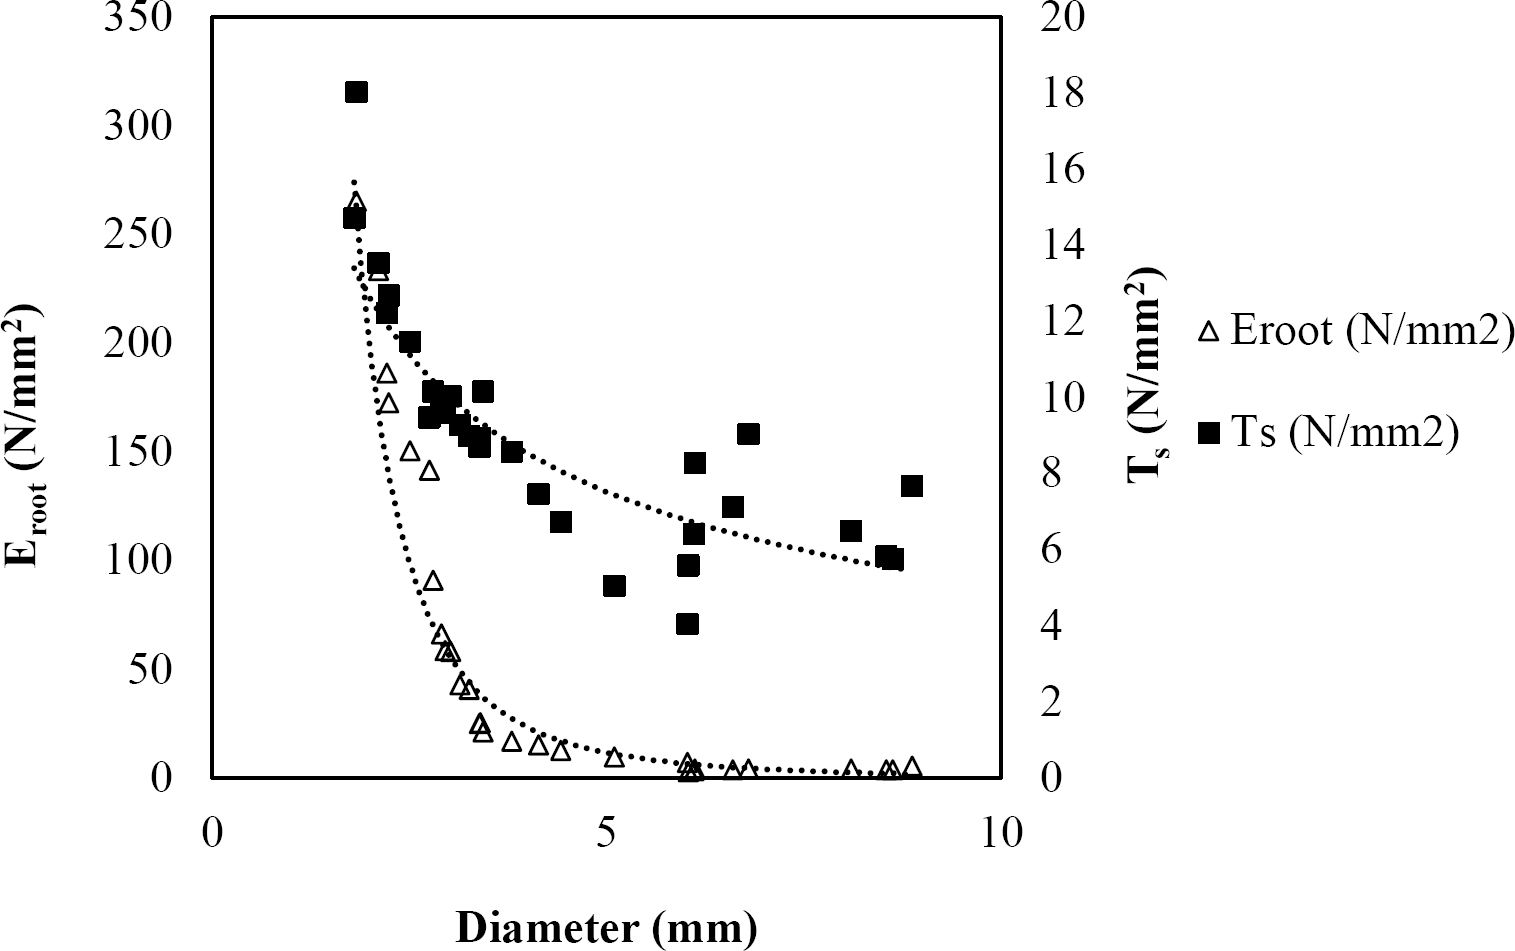
Figure 6 Relationship between diameter of roots, tensile strength (Ts) and Modulus of elasticity (Eroot) for Arbutus xalapensis.
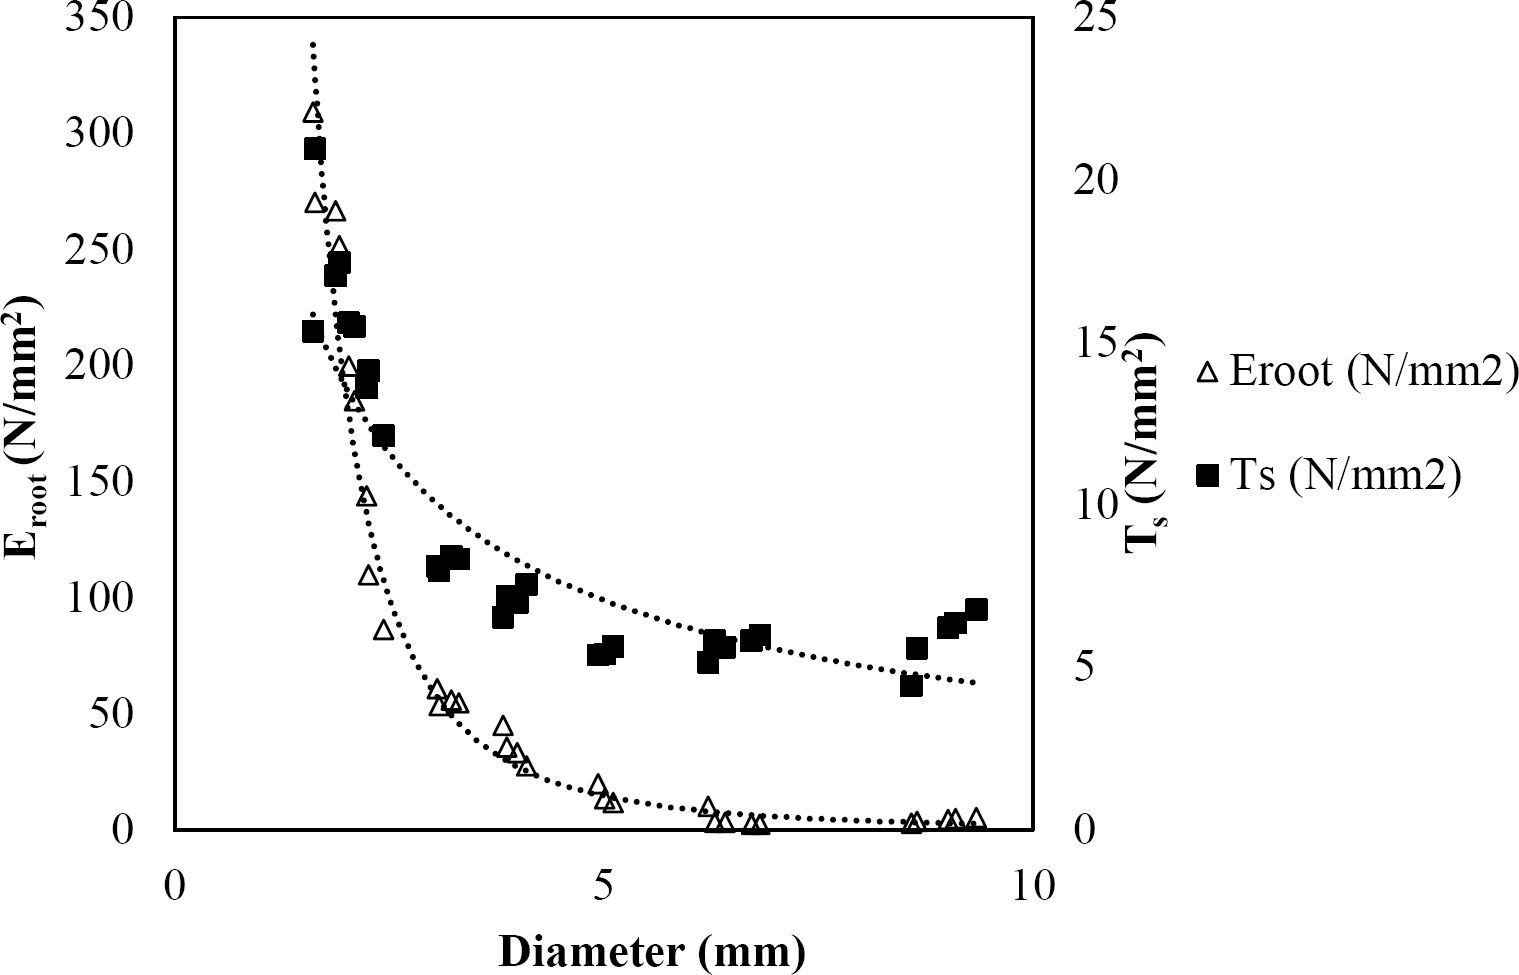
Figure 7 Relationship between diameter of roots, tensile strength (Ts) and Modulus of elasticity (Eroot) for Pinus pseudostrobus.
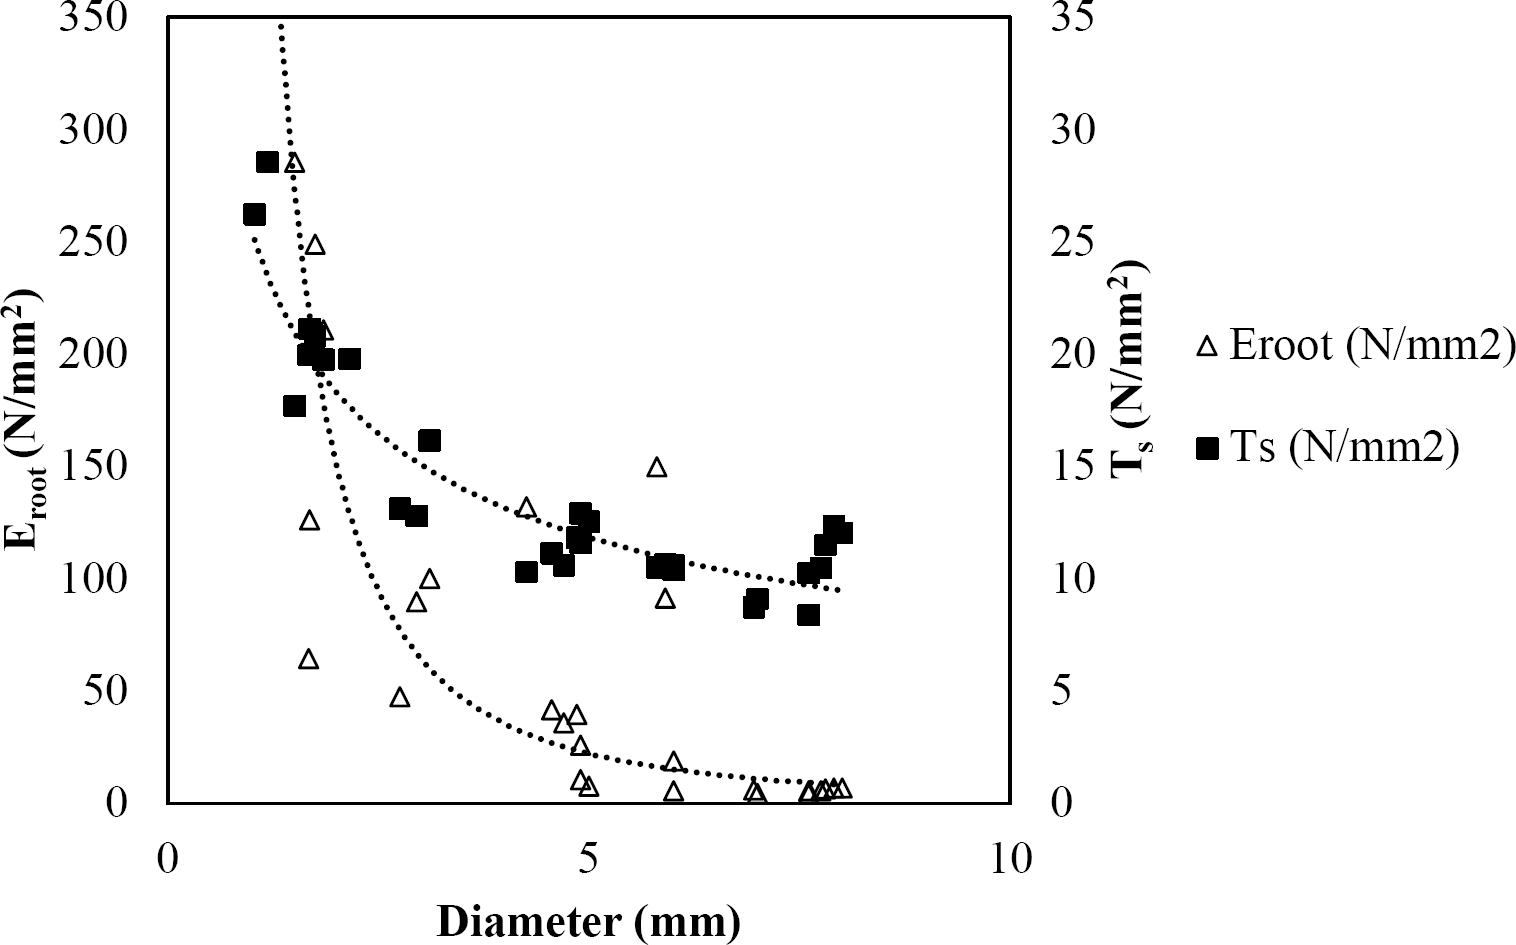
Figure 8 Relationship between diameter of roots, tensile strength (Ts) and Modulus of elasticity (Eroot) for Quercus canbyi.
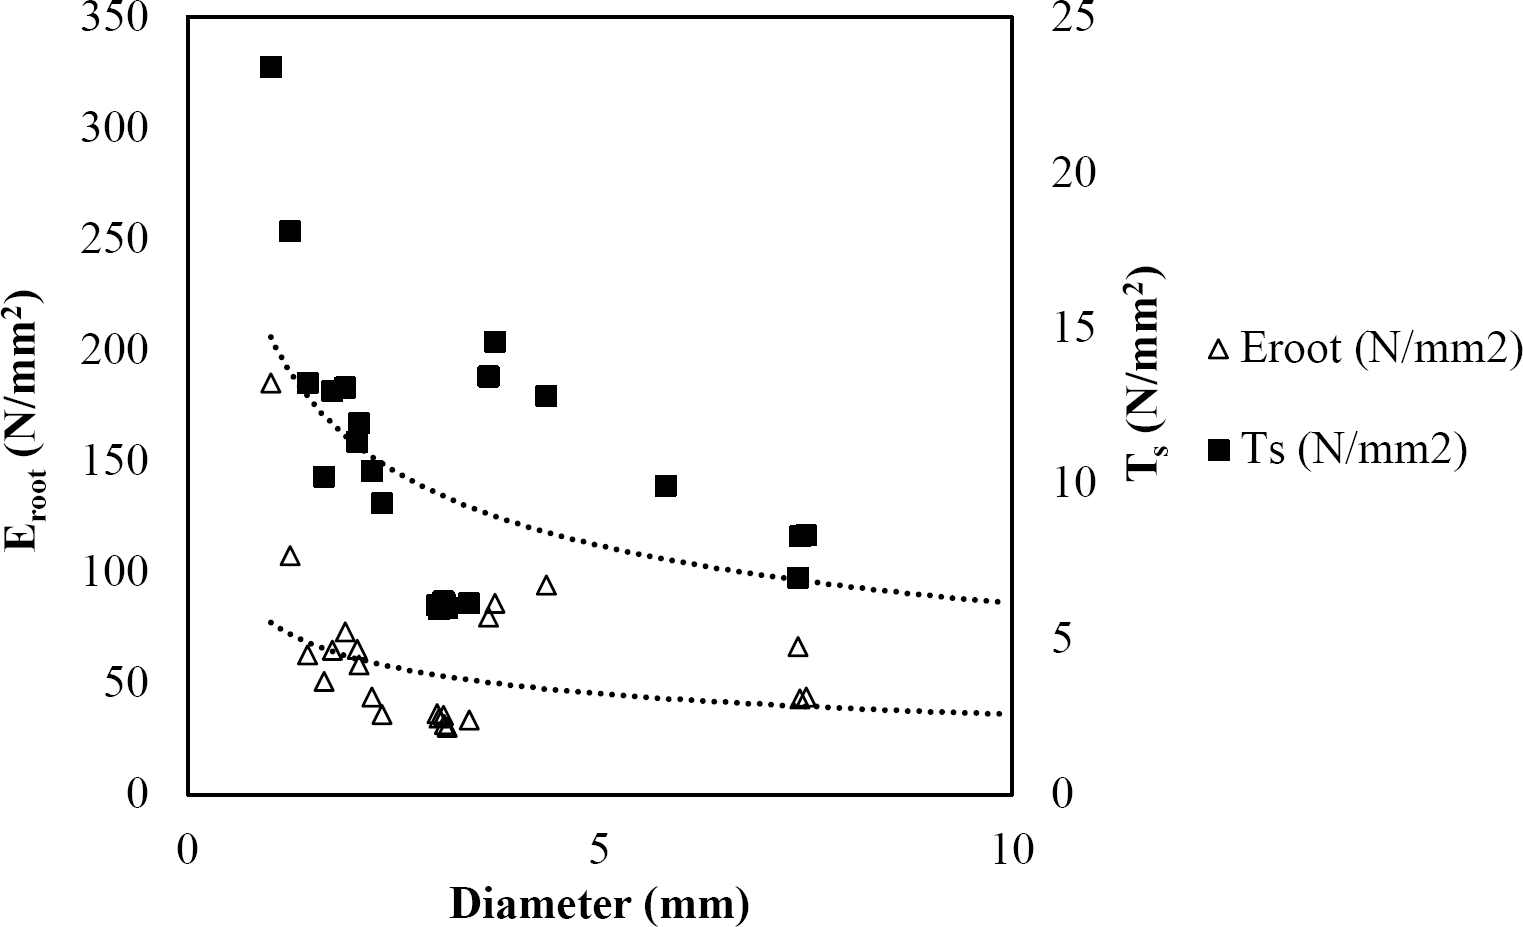
Figure 9 Relationship between diameter of roots, tensile strength (Ts) and Modulus of elasticity (Eroot) for Quercus polymorpha.
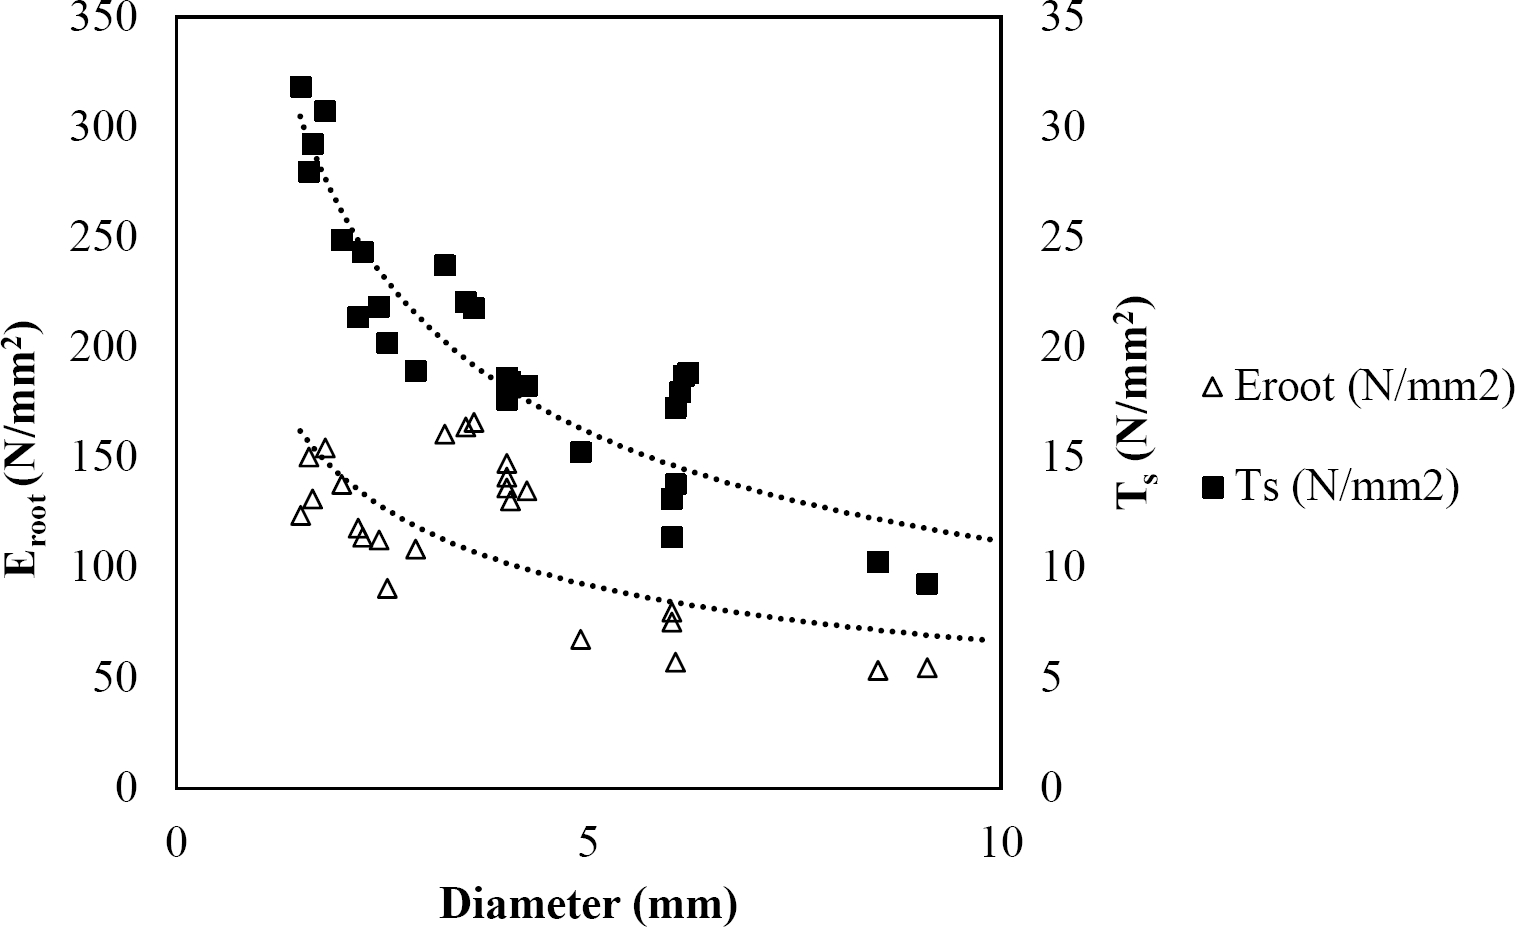
Figure 10 Relationship between diameter of roots, tensile strength (Ts) and Modulus of elasticity (Eroot) for Quercus rysophylla.
The tensile strength calculated for the roots of the Tamaulipan thornscrub species ranged by diametric category in values of 1.11 N/mm2 in C. boissieri in diameters of 6-10 mm (Category III) to 43.63 N/mm2 in A. rigidula with diameters of 0.1-2.9 mm (Category I) (Figure 11). Likewise, the tensile strength calculated for the roots of the species of the Pine-Oak forest varied from 7.79 N/mm2 for P. pseudostrobus in diameters of 6-10 mm (Category III) to 25.12 N/mm2 in the species Q. rysophylla with diameters of 0.1-2.9 mm (Category I) (Figure 12). In general, of the 10 species analyzed, the tensile force ranged in values of 1.11 N/mm2 in C. boissieri with diameters of 6-10 mm (Category III) to 43.63 N/mm2 A. rigidula in diameters of 0.1-2.9 mm (Category I); both values of Tamaulipan thornscrub (Figure 11).
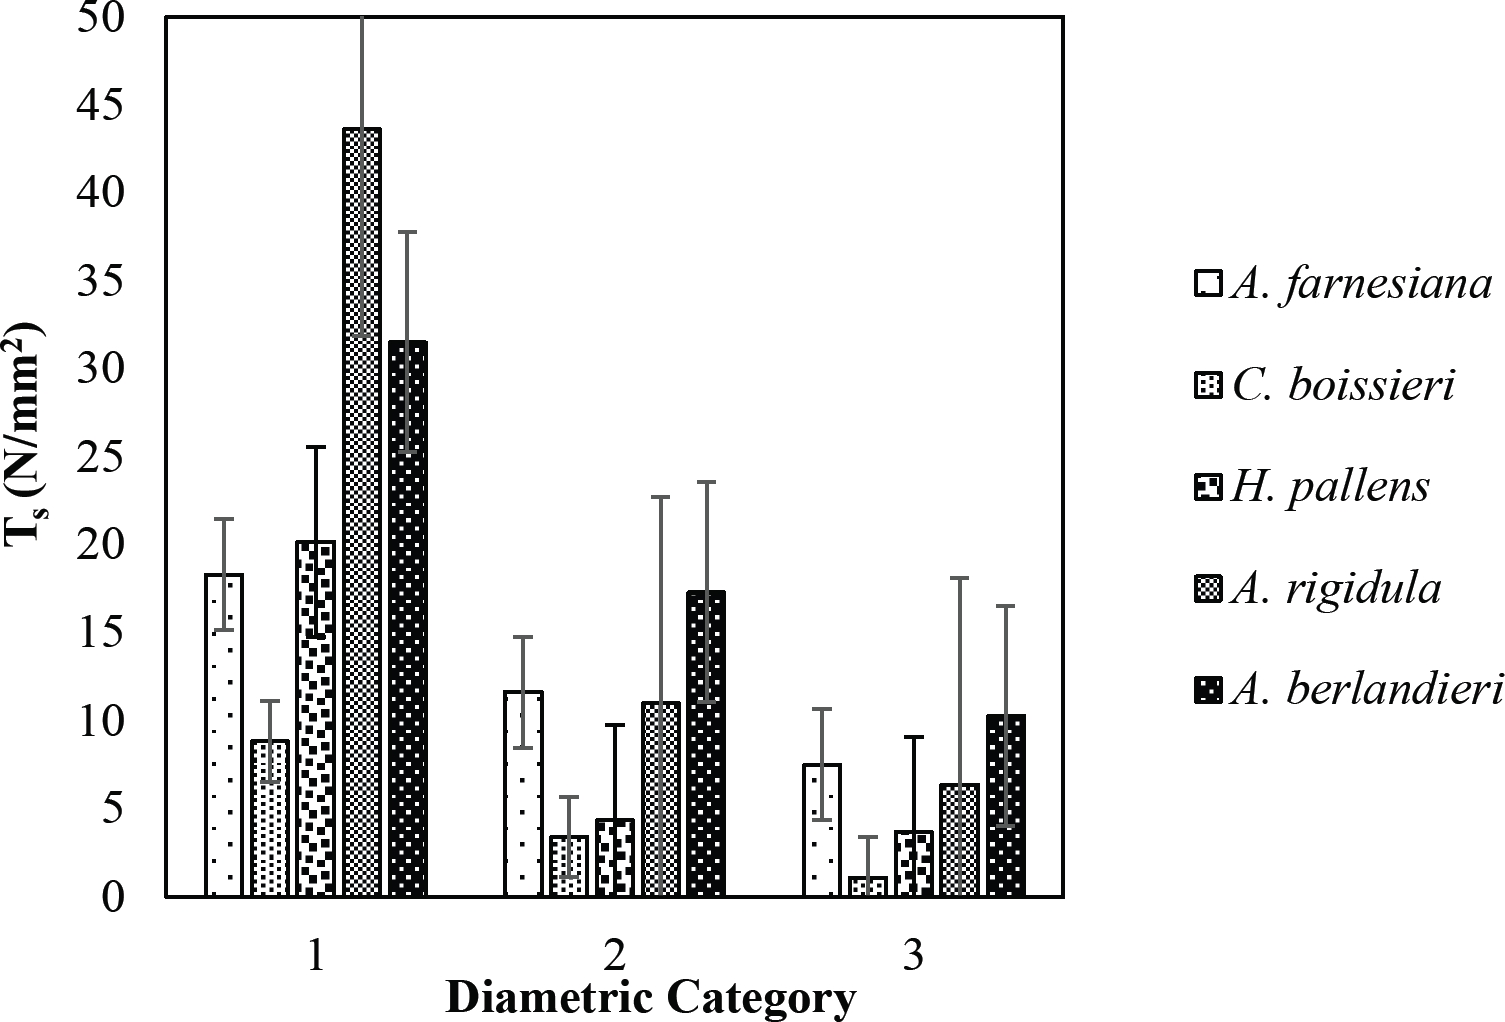
Figure 11 Relationship between diametric category and tensile strength (Ts) of species for Tamaulipan thornscrub area.
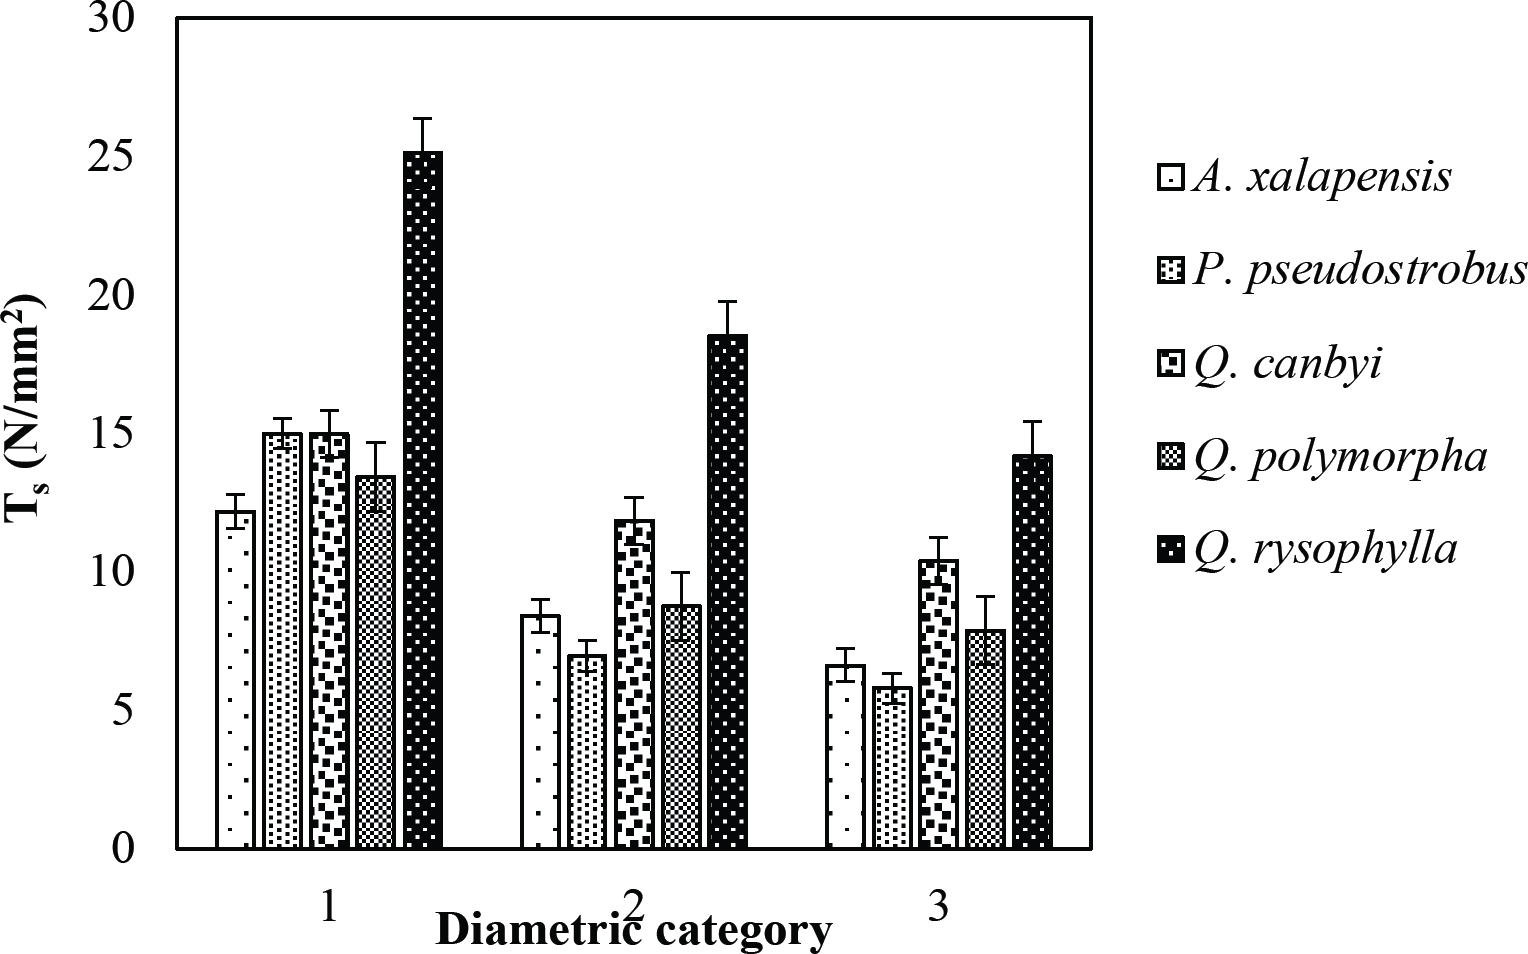
Figure 12 Relationship between diametric category and tensile strength (Ts) of species for Pine-Oak forest area.
The modulus of elasticity showed for the roots of Tamaulipan thornscrub species varied by diametric category in values of 12.63 N/mm2 in C. boissieri with diameters of 6-10 mm (Category III) to 242.70 N/mm2 in A. berlandieri in diameters of 0.1-2.9 mm (Figure 13). On the other hand, the modulus of elasticity calculated for the roots of the species of Pine-Oak forest ranged from 12.64 N/mm2 in Q. canbyi with diameters of 6-10 mm (Category III) to 227.47 N/mm2 in Q. canbyi with diameters of 0.1-2.9 mm (Category I) (Figure 14). However, of the 10 species analyzed, the modulus of elasticity varied from 12.63 N/mm2 in C. boissieri with diameters of 6-10 mm (Category III) to 242.70 N/mm2 in A. berlandieri with diameters of 0.1-2.9 mm (Category I); both values for the Tamaulipan thornscrub.
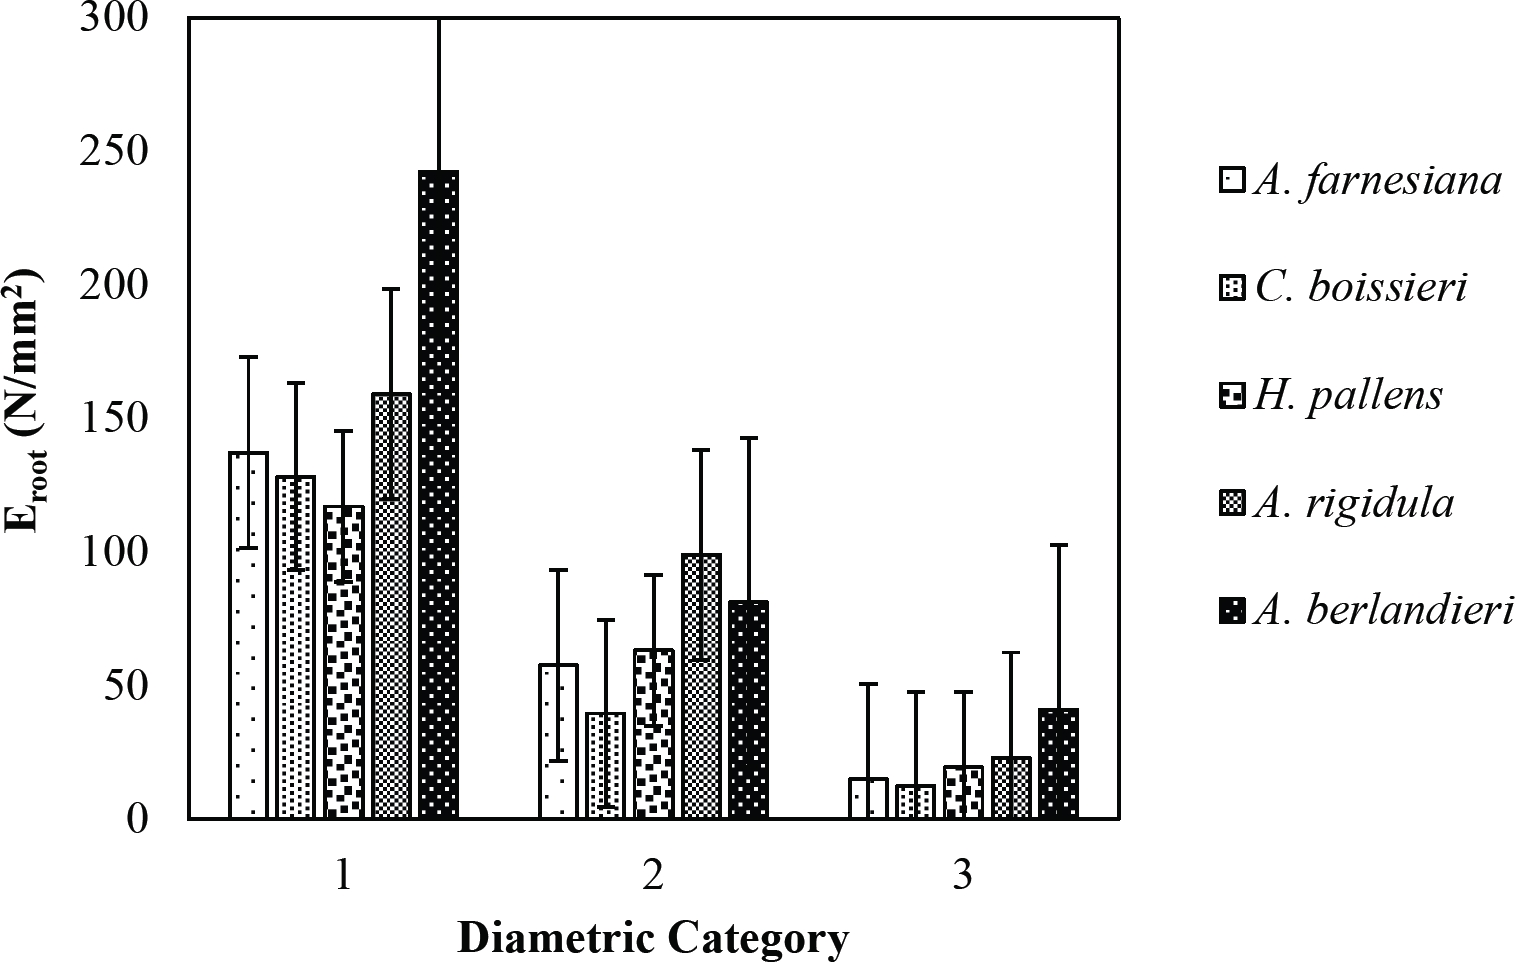
Figure 13 Relationship between diametric category and modulus of elasticity (Eroot) of species for Tamaulipan thornscrub area.
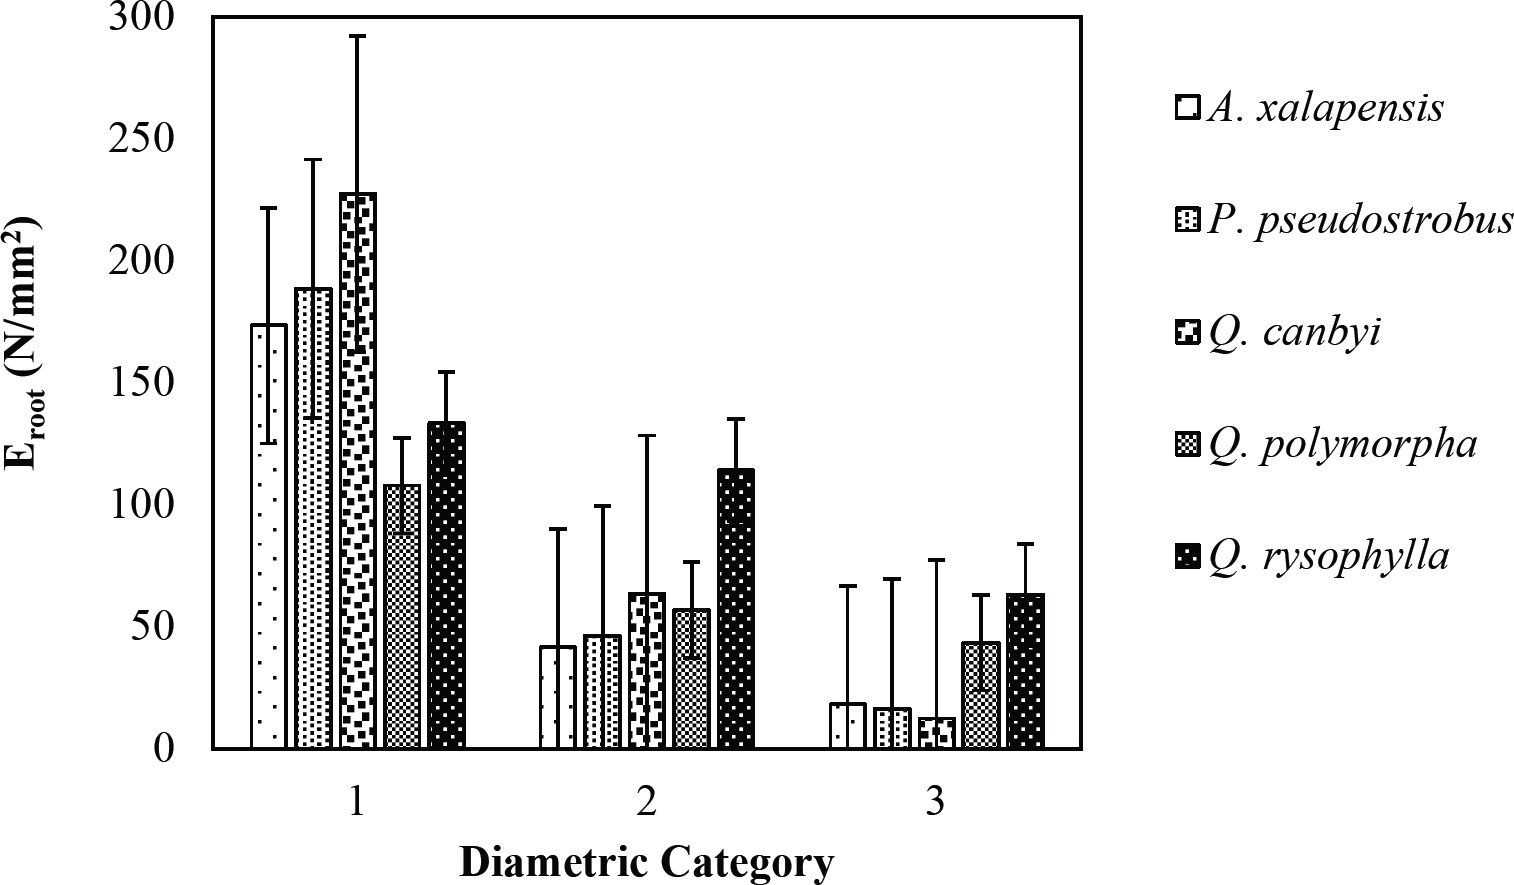
Figure 14 Relationship between diametric category and modulus of elasticity (Eroot) of species for Pine-Oak forest area.
The relationship between diameter of roots and Modulus of elasticity (Eroot) are shown in figures 1 to 10. The relationship found was also negative for all species tested showing highly significant values p < 0.01 (**). Power regression equation fitted the results as follows: Acacia farnesiana (y = 336.97x−1.666, R² = 0.8337, F = 128.534**), Cordia boissieri (y = 1347.5x−3.463, R² = 0.9026, F = 362.147**), Havardia pallens (y = 208.76x−2.132, R² = 0.8862, F = 172.455**), Acacia rigidula (y = 313.14x−1.877, R² = 0.7895, F = 93.722**), Acacia berlandieri (y = 299.87x−1.609, R² = 0.6217, F = 37.996**), Arbutus xalapensis (y = 1672.7x−3.078, R² = 0.927, F = 186.401**), Pinus pseudostrobus (y = 1266.8x−2.773, R² = 0.9398, F = 310.871**), Quercus canbyi (y = 643.31x−2.091, R² = 0.7242, F = 77.741**), Quercus polymorpha (y = 18.883x−0.32, R² = 0.2166, F = 2.994**), and Quercus rysophylla (y = 196.09x−0.469, R² = 0.4493, F = 18.424**).
Discussion
All studied species showed a negative trend regarding tensile strength and diameter that agrees with several studies (Operstein & Frydman 2000, Mattia et al. 2005, Bischetti et al. 2009, Tosi 2007, Sánchez-Castillo et al. 2017), where they show that tensile strength of the root (Ts) decreases with increasing root diameter. In general, tensile strength for the species studied can be accurately predicted based on their root diameter, with the exception of Q. polymorpha. The absence of a high (R² = 0.4405) between tensile strength and root diameter for Q. polymorpha is not surprising, given the number of factors that in addition to the root diameter, are controlling the tension force (Ts), since variations in the age of the root (Genet et al. 2005), growth rate, soil texture, and nutrient status, may be responsible for variability in tensile strength (Pollen & Simon 2005), but in the case of this study it is attributed to the low thickness of soil at the sampling site.
However, in the specific case of Q. polymorpha, the thickness of the root bark can also explain the poor correlation between tensile strength and root diameter for the species mentioned.
In this study, root diameter and maximum force to root breakage showed a relationship where thinner diameters required less forces to breakage. So, the thinner diameters have the greater tensile strength. The results obtained are in line with the findings of several researchers (Gray & Sotir 1996, Bischetti et al. 2009, Tosi 2007, Burylo et al. 2011, Sánchez-Castillo et al. 2017).
The values of mechanical properties, in this case tensile strength and modulus of elasticity, could be influenced by the combination of species-specific differences, specimens, and site-specific conditions. There are a few local variables that often control the mechanical properties, which are affected not only by species and diameter differences, but also by other factors like soil depth. Therefore, a true comparison among studied species requires similar or equal local conditions.
As reported by Gray & Sotir (1996), the tensile strength values of hardwood species vary approximately from 8 to 80 N/mm2 with diameters from 2 to 15 mm. For the species analyzed in this study, tensile strength ranged from 4.45 to 22.12 N/mm2 with diameters from 0.99 to 9.91 mm. Sánchez-Castillo et al. (2017) showed that tensile strength decreases with increasing diameter and the relationship between these two variables follows a negative potencial power function. When a soil shears, the fine and thinner roots that have high tensile strength would slip while thicker roots with lower tensile strength would break (Mickovski et al. 2007). This could be explained according to Genet et al. (2005), who found that this high tensile strength of the thinner roots is contributed by a higher cellulose content.
These influences can also be observed on tensile strength - diameter relationships, and although they show a trend, a relatively poor fitting model for Q. polymorpha (R2 = 0.4404) can be observed and attributed to a low n. This was expected so, given the numerous factors different from diameter controlling Ts, such as variance in soil depth. Similar low fitting results were found on previous studies and were suggested as variations in root age (Genet et al. 2005), growth rate, nutrient status (Pollen & Simon 2005), climate and time of sampling (Operstein & Frydman 2000). Root water content is not an influential factor for Ts according to the results presented by Pollen (2007), Tosi (2007) and Sánchez-Castillo et al. (2017). The relationship between diameter of roots and tensile strength (Ts) in all studied species was found to be negative, indicating that roots with smaller diameters have larger tensile strengths. It was also confirmed that the power law equation can model the relationship between the mechanical properties and the diameter of the roots of different studied species. The order of more important species among the studied species according to their mechanical properties was found as: Acacia berlandieri > Quercus rysophylla> Pinus pseudostrobus.
The best trees to be implemented in soil bioengineering management in urbanized slopes of the Sierra Madre Oriental are the species of the Tamaulipan thornscrub, specifically Acacia berlandieri and Acacia rigidula (for the lower elevation zones) and for the Pine-Oak forest the Quercus rysophylla (for the high elevation parts). Due to the geotechnical situation of the Sierra Madre Oriental, the slopes are affected by sediment-related disasters, especially during the hurricane season. For this reason, it is important to start taking control measures that are environmentally-friendly and best suited for the preservation of the slopes over time.


 nova página do texto(beta)


