


Serviços Personalizados
Journal
Artigo
 texto em
  Inglês (pdf)
 Artigo em XML
 Referências do artigo
 Enviar este artigo por email
Indicadores
-
 Citado por SciELO
 -
 Acessos
Links relacionados
-
 Similares em
SciELO
Similares em
SciELO
Compartilhar

 Permalink
Tecnología y ciencias del agua
versão On-line ISSN 2007-2422
Tecnol. cienc. agua vol.10 no.3 Jiutepec Mai./Jun. 2019 Epub 21-Abr-2021
https://doi.org/10.24850/j-tyca-2019-03-11
Notes
Modeling water availability in the Zirahuén Lake Basin
2
 http://orcid.org/0000-0001-6045-1661
3
http://orcid.org/0000-0001-9490-9650
1Universidad de Ciencias y Artes de Chiapas, Tuxtla Gutiérrez, Chiapas, México, mauricio.jose@unicach.mx
2Universidad Autónoma Chapingo, km. 38.5 Carretera México-Texcoco, Chapingo, Texcoco, Estado de México, vpradoh@chapingo.mx
3Instituto Tecnológico del Valle de Morelia, carretera Morelia-Salamanca km. 6.5, Morelia, Michoacán, México, aromero@itvallemorelia.edu.mx
4Benemérita Universidad Autónoma de Puebla, Puebla de los Ángeles, Puebla, México, delfino_reyes2001@yahoo.com.mx
5Consejo Nacional de Ciencia y Tecnología-Universidad Nacional Autónoma de México, Ciudad de México, México, fpascualr@iies.unam.mx
In water management, it is essential to know the water availability within the hydrological planning and management units. To improve the knowledge of hydrological cycle variables in the Zirahuén Lake Basin we used the Soil-Water-Balance (SWB) spatiotemporal simulation model supported by the hydrodynamic characteristics of the soil and land cover, together with daily climatological information. Our results showed how land use influences runoff and recharge of aquifers reflecting in water availability estimates, which showed an important setback with an emphasis during the 2009-2015 period. When comparing our results with the official records reported in 2016, we found that the latter figures underestimated the groundwater index (GI) by 14.64% and the relative water availability index (RWAI) by 150% relative to the results of our study. We concluded that, to improve the reliability and management of water in the basin, it is recommend verifying our results by implementing strategies to monitor the quantity, quality, and temporality of water.
Keywords Water Management; Runoff; Groundwater; Water balance; Water use
En la gestión del agua es fundamental conocer la disponibilidad hídrica al interior de las unidades de planeación y manejo hidrológico. En la cuenca del lago de Zirahuén, para mejorar el conocimiento de las variables del ciclo hidrológico, se empleó el modelo de simulación espaciotemporal en cuencas Soil-Water-Balance (SWB), apoyado en las características hidrodinámicas del suelo y cobertura, en conjunto con información climatológica diaria. Los resultados mostraron la influencia del uso del suelo en los escurrimientos y la recarga de acuíferos, que se reflejaron en la disponibilidad hídrica, la cual mostró retrocesos importantes con énfasis en el periodo 2009-2015. Al analizar los resultados con respecto a lo reportado en 2016, se encontró que el Índice de Aguas Subterráneas (IDAS) ha sido subestimado en 14.64%, en tanto que la Disponibilidad Relativa (DR) se ha subestimado por el 150% con respecto a los valores encontrados en este estudio. Finalmente, para mejorar la confiabilidad y la gestión del agua, se recomienda implementar estrategias de monitoreo de la cantidad, calidad y temporalidad del agua para verificar los resultados obtenidos.
Palabras clave gestión del agua; escurrimiento; agua subterránea; balance hídrico; uso del agua
Introduction
Water and its availability are the base for development of societies, although its distribution lacks a relationship with population growth and expansion, and with economic development (Shiklomanov, 1998). In Mexico, renewable water availability is in an inverse proportion with socioeconomic level (Conagua, 2016a), which generates high-demand zones having no trustworthy information regarding the functioning of the water cycle.
The water balance (WB) is the result of the evaluation of the factors involved in the water cycle, for which methods have been developed for different observation scales (Sokolov & Chapman, 1974; Xu & Singh, 1998). The soil-water balance (SWB) model (Dripps & Bradbury, 2007; Westenbroek, Kelson, Dripps, Hunt, & Bradbury, 2010) estimates the components of the water balance at a daily level (Thornthwaite & Mather, 1957) taking advantage of geographic information systems. It calculates the water balance at the basin scale using five required variables: 1) Precipitation and temperature, 2) soil use and vegetation, 3) hydrological soil group, 4) flow direction, and 5) water retention capability of soil. The runoff values are calculated by means of the runoff curve numbers of the National Resources Conservation Service (NRCS, 1986). The method has been successfully used for regional groundwater recharge evaluation in the Lake Michigan and Wisconsin basins (Tillman, Gangopadhyay, & Pruitt, 2016).
The joint analysis of the water balance components and the involved water demand allow to know water availability (Touhami et al., 2014), which in Mexico is estimated by the Mexican official norm NOM-011-Conagua-2015 (Conagua, 2015) and is only existing from 2014 to the present with lack of data for several time periods. In order to improve the management of water and due to the lack of information through time, the simulation models allow improving the knowledge of the water balance (and its availability) in basins. Because of that, the objectives of our work were to apply the SWB model for estimating water availability in the Zirahuén Lake Basin at different times, and to analyze the availability indexes relative to the reported official records for 2016.
Materials and methods
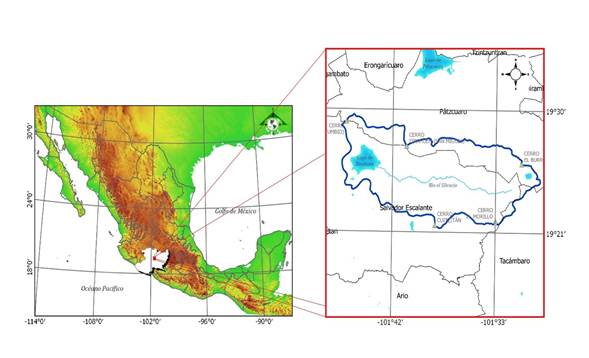
The study was made using the geospatial information of the Zirahuén Lake Basin (19°21'09" and 19°29'50" N, and 101°29'11" and 101°46'21" W) in the state of Michoacán de Ocampo (Figure 1) within the Tarasca Neovolcanic Physiographic Province (INEGI, 2001).
Information was taken from the 1:50,000 scale topographic map (INEGI, 2014) to generate a digital elevation model (DEM) at a 100 m spatial resolution. In the process of information conditioning, the land cover and land use classes (Table 1) were converted to ASCII raster format data matrices. A database from The National Commission of Water (Conagua) with daily information of temperature and precipitation was used converting values to English units of measurement.
Table 1 Synthesis of the used information.
| Type | Format | Version | Scale |
| Topographic | Vector | Series III | 1:50,000 |
| Soil | Vector | Series II | 1:250,000 |
| Basin limits | Vector | 2nd edition | 1:50,000 |
| Soil use and soil cover | Vector | Series I, II, II, IV, V | 1:250,000 |
| Climatological data | Table | 2016 | N/A |
The evaluation of the spatiotemporal variations in the water balance was made for the years 1972, 1980, 1992, 2000, 2003, 2009, and 2015 based on the publication date of each land use and land cover series and the availability of daily climatological data. The evapotranspiration was estimated using data of maximum and minimum temperatures (Hargreaves & Samani, 1985) taking into consideration the meteorological information in the daily records.
To calculate the water availability (surface and groundwater), the Water Rights Public Record (REPDA) database was used (Conagua, 2016c) that only contains data of discharge volumes from the year 2000 onwards, because of which the calculations were made for a similar period. For the natural discharge of groundwater, the same value (0.3 Mm3) of the ‘Nueva Italia’ polygon was used because the basin’s area is within that polygon. Regarding the return volume of surface water, we assumed a conservative criterion considering that the lowest value found (2015) for the return volume (1.45 Mm3) was constant.
The groundwater index (GI) was calculated based on the results in the REPDA database and for the relative water availability index (RWAI) we used the data reported by Conagua (2016b) in the basin substituting the natural runoff value with the data found in this work.
In general, the GI and RWAI values were calculated as established in the NOM-011-Conagua-2015 for the year 2015 and compared with the official results reported for the beginning of 2016 (Conagua, 2016b).
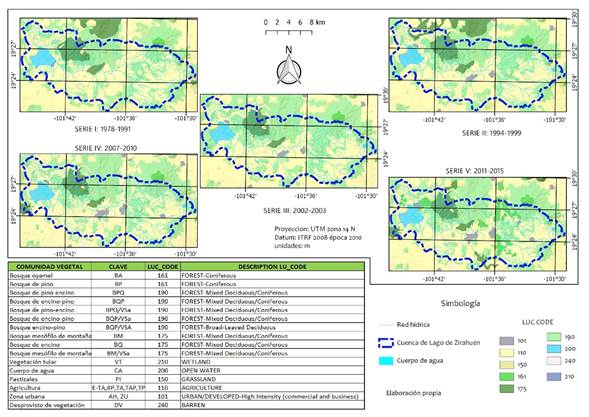
The land use and land cover classes were coded based on the reference values table of the SWB model (Westenbroek et al., 2010) to be converted to raster and to generate maps of land use change dynamics during the analyzed period (Figure 2).
Four soil groups were identified in the Series II 1:250,000 scale soil units and profile points (INEGI, 2004): Andosol, Leptosol, Luvisol, and Phaeozem. Three textural classes were detected by crossing the information from the soil units and soil profiles, one for each hydrological group (NRCS, 1986): Andosol with a sandy-loam texture in hydrological group A with a code value of 1, Leptosol with a clayey-sandy-loam texture in group C and code value 3, and Luvisol and Phaeozem with a clayey-loam texture in group D code 4.
The values of the components of soil texture were used to assign values based on the soil type tables (Thornthwaite & Mather, 1957). A 1.6 value was assigned to Andosols, 2.7 to Leptosols, and 3 to Luvisols and Phaeozem.
Results
The recharge depth per year (Figure 3), showed the highest values for the years 1992 and 2000 and the lowest recharge values for the years 2009 and 2015. The north-central part covered by forests had low recharge vales due to the steep slope present in the higher elevations.
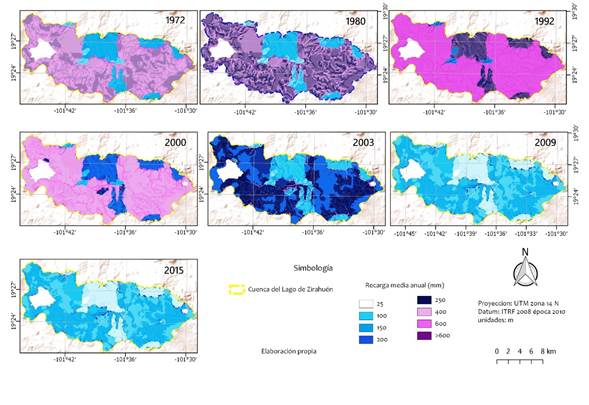
The precipitation values in 1972 were similar to those in 2015, but the recharge values were in the order of three-fold lower than in 1972 (Table 2), displaying the effects of land use change.
Table 2 Components of the water balance in recharge depth per year (mm/y).
| Year | Precipitation | Recharge | Interception | Runoff | Potential evapotranspiration (PET) |
|---|---|---|---|---|---|
| 1972 | 999.00 | 178.82 | 26.92 | 484.12 | 1 238.25 |
| 1980 | 1 219.60 | 156.46 | 27.18 | 596.90 | 1 771.65 |
| 1992 | 1 922.10 | 415.80 | 32.51 | 935.23 | 1 560.07 |
| 2000 | 1 406.00 | 206.76 | 31.24 | 681.74 | 1 695.70 |
| 2003 | 1 071.80 | 107.70 | 44.45 | 519.68 | 1 555.50 |
| 2009 | 958.89 | 53.09 | 43.18 | 465.58 | 1 613.15 |
| 2015 | 999.50 | 45.21 | 41.40 | 487.43 | 1 636.27 |
The water availability in the basin (Table 3) is the result of the detailed analysis of the REPDA database. A 284% increase was observed in the demand of groundwater from 2009 to 2015 motivated by the volume of water required for agriculture, which in that period went from 0.1033 Mm3 to 0.3975 Mm3. Regarding the demand of surface water, the public supply experienced a 40% increase between 2009 and 2015. These results show there is an intensification of the pressure on water within the basin.
Table 3 Water availability in millions of cubic meters per year.
| Year | R | D1 | DH1 | R | D2 | DH2 |
|---|---|---|---|---|---|---|
| 2000 | 56.52 | 0.10 | 56.12 | 186.36 | 0.75 | 187.06 |
| 2003 | 29.44 | 0.19 | 28.95 | 142.06 | 2.19 | 141.32 |
| 2009 | 14.51 | 0.18 | 14.03 | 127.27 | 2.44 | 126.29 |
| 2015 | 12.36 | 0.75 | 11.31 | 133.25 | 3.18 | 131.52 |
Abbreviations: R, recharge; D1, demand on groundwater extraction; DH1, groundwater availability; R, runoff; D2, demand on surface extraction; DH2, surface water availability.
Discussion
We explained the observed differences in the recharge depth per year by the soil use changes (Figure 2) occurred in the forest, grasslands, and cropland areas, which affected the recharge rates. It has been found that land use changes from forest to agriculture have an effect on soil and water conservation, as well as causing a decrease in the infiltration rates (Sun et al., 2018). In degraded basins, crop rotation applied as a corrective measure reduces soil erosion by up to 69% (Abdelwahab, Bingner, Milillo, & Gentile, 2014); otherwise, the conversion from forest cover to croplands (agriculture and foraging) causes a depletion of the organic carbon in mineral soils and of carbon in rootlets (Mendoza-Vega, Karltun, & Olsson, 2003). Land use change in the scenario of climate change decreases the annual runoff discharge by 19% and the maximum summer flow by up to 45% (Pijl, Brauer, Sofia, Teuling, & Tarolli, 2018).
The ‘Nueva Italia’ aquifer has a GI value of 0.82 and is classified within the availability zone 4, with enough volume to satisfy the demand of water occurred during 2016 (Conagua, 2016b). The calculations based on the simulation (2015) resulted in GI values of 0.94, 14.16% more than the official estimates for the total aquifer. Analyzing the granted water volumes for the 2000-2015 time period (Table 3), there was a linear trend with a negative slope that indicates a decrease along time in the amount of available water from the aquifer.
Regarding surface water, the results from the simulation displayed a decreasing trend with a minimum in 2009 despite the apparent recovery occurred during the year 2015; the values were less than those for 2000 and 2003. The official figures show a RWAI value of 0.92 within the availability zone 1; substituting the runoff volumes resulting from the SWB model (Table 3) the obtained RWAI was 2.32, which is over 150% more than the official calculations, thus placing it within availability zone 2, in which there is enough available volume to satisfy the present needs and a margin for future demand.
Our calculated runoff values (133.246 Mm3 in 2015) are far larger than the estimations made by Conagua (52.16 Mm3) in the determination of water availability, the capacity of the basin having been underestimated; therefore, the water availability is 78.755 Mm3. These differences are mainly due to the method used to estimate the runoff: Conagua uses the rational method with annual results, while the SWB model uses the runoff curve numbers in a geospatial solution taking into account the particular topography and land cover class, obtaining daily water balance results. The differences in the time lapse of the calculations allow a higher sensitivity of the results. Yet, in both processes, the information about the amount of water is obtained without considering the quality of water.
Although we used a more detailed modeling, the scope of our work has not been verified by gauging because, until today, there is a void of information in that regard. Likewise, the information about the quality and temporal distribution of water is insufficient. The SWB model has proven its usefulness in the simulation of the water cycle with relevant results in the U.S.A. (Tillman et al., 2016; Zhang, Felzer, & Troy, 2016), having a variation of ±33 mm per year in the estimation of the recharge, and a high confidence level has been found in the results of the model at the regional scale when using data at a monthly and yearly resolution (Han et al., 2018). The studies about the application of the SWB model account for its usefulness as a tool to support the processes of water management within basins.
Conclusions
The use of the SWB model allowed estimating the water balance with a good approximation of the groundwater and surface water flows. As a result of taking into consideration the biophysical characteristics of the basin and the precipitation at a daily temporal resolution, the analysis regarding water availability allowed adjusting the GI values 14.92% above the official figures and the RWAI values at over 150% higher than the official reports. Although the literature reports the usefulness of the SWB model in the estimation of recharge, our results show the urgent need to implement gauging instrumentation in the Zirahuén Lake Basin, and also of strategies for the monitoring of the quantity, quality, and temporality of water in order to improve the process of its management.
Acknowledgements
We acknowledge Project 6331 of the Institute of Engineering of UNAM and Project PDCPN-2015-640. We thank Rosalva Mendoza Ramírez for her aid in the development and review of the results, and the support given by the Institute of Engineering of UNAM.
REFERENCES
Abdelwahab, O. M. M., Bingner, R. L., Milillo, F., & Gentile, F. (2014). Effectiveness of alternative management scenarios on the sediment load in a Mediterranean agricultural watershed. Journal of Agricultural Engineering, 45(3), 125. DOI: 10.4081/jae.2014.430 [ Links ]
Conagua, Comisión Nacional del Agua. (2015). NOM-011-COAGUA-2015, Conservación del Recurso Agua. México, DF, México: Comisión Nacional del Agua. [ Links ]
Conagua, Comisión Nacional del Agua. (2016a). Estadísticas del agua en México, edición 2016. Reporte. México, DF, México: Comisión Nacional del Agua . [ Links ]
Conagua, Comisión Nacional del Agua. (2016b). Acuerdo por el que se dan a conocer las zonas de disponibilidad que corresponden a las cuencas y acuíferos del país para el ejercicio fiscal 2016. México, DF, México: Comisión Nacional del Agua . [ Links ]
Conagua, Comisión Nacional del Agua. (2016c). Registro Público de Derecho del Agua (Repda). México, DF, México: Comisión Nacional del Agua . [ Links ]
Dripps, W. R., & Bradbury, K. R. (2007). A simple daily soil-water balance model for estimating the spatial and temporal distribution of groundwater recharge in temperate humid areas. Hydrogeology Journal, 15(3), 433-444. DOI: 10.1007/s10040-007-0160-6 [ Links ]
Han, W. S., Graham, J. P., Choung, S., Park, E., Choi, W., & Kim, Y. S. (2018). Local-scale variability in groundwater resources: Cedar Creek Watershed, Wisconsin, USA. Journal of Hydro-Environment Research, 20(April), 38-51. DOI: 10.1016/j.jher.2018.04.007 [ Links ]
Hargreaves, G., & Samani, Z. (1985). Reference crop evapotranspiration from temperature. Applied Engineering in Agriculture, 1(2), 96-99. DOI: 10.13031/2013.26773 [ Links ]
INEGI, Instituto Nacional de Estadística y Geografía. (2001). Conjunto de datos vectoriales fisiográficos. Escala 1:1,000,000. Serie I. Aguascalientes, México: Instituto Nacional de Estadística y Geografía. [ Links ]
INEGI, Instituto Nacional de Estadística y Geografía. (2004). Guía para la interpretación de cartografía: Edafología. Aguascalientes, México: Instituto Nacional de Estadística y Geografía . [ Links ]
INEGI, Instituto Nacional de Estadística y Geografía. (2014). Conjunto de datos vectoriales topográficos. Escala 1:50,000. Serie III. Aguascalientes, México: Instituto Nacional de Estadística y Geografía . [ Links ]
Mendoza-Vega, J., Karltun, E., & Olsson, M. (2003). Estimations of amounts of soil organic carbon and fine root carbon in land use and land cover classes, and soil types of Chiapas highlands, Mexico. Forest Ecology and Management, 177(1-3), 191-206. DOI: 10.1016/S0378-1127(02)00439-5 [ Links ]
NRCS, Natural Resource Conservation Service. (1986). Urban Hydrology for Small Watersheds TR-55. USDA Natural Resource Conservation Service Conservation, Engeneering Division Technical Release 55. Recuperado de https://doi.org/Technical Release 55 [ Links ]
Pijl, A., Brauer, C. C., Sofia, G., Teuling, A. J., & Tarolli, P. (2018). Hydrologic impacts of changing land use and climate in the Veneto lowlands of Italy. Anthropocene, 22, 20-30. DOI: 10.1016/j.ancene.2018.04.001 [ Links ]
Shiklomanov, I. A. (1998). World water resources- A new appraisal and assessment for the 21st century. Report. DOI: 10.4314/wsa.v30i4.5101 [ Links ]
Sokolov, A., & Chapman, V. (1974). Methods for water balance computations. An international guide for research and practice. The UNESCO Press, 23. DOI: 10.1017/CBO9781107415324.004. [ Links ]
Sun, D., Yang, H., Guan, D., Yang, M., Wu, J., Yuan, F., Jin, C., Wang, A., & Zhang, Y. (2018). The effects of land use change on soil infiltration capacity in China: A meta-analysis. Science of the Total Environment, 626, 1394-1401. DOI: 10.1016/j.scitotenv.2018.01.104 [ Links ]
Thornthwaite, C. W., & Mather, J. R. (1957). Instructions and tables for computing potential evapotranspiration and water balance. Publications in Climatology, 10(3), 185-311. [ Links ]
Tillman, F. D., Gangopadhyay, S., & Pruitt, T. (2016). Changes in groundwater recharge under projected climate in the upper Colorado River basin. Geophysical Research Letters, 6968-6974. DOI: 10.1002/2016GL069714 [ Links ]
Touhami, I., Andreu, J. M., Chirino, E., Sánchez, J. R., Pulido-Bosch, A., Martínez-Santos, P., Moutahir, H., & Bellot, J. (2014). Performances comparées de modéles de bilan hydrique des sols pour le calcul de la recharge d’aquifères en conditions semi-arides. Hydrological Sciences Journal, 59(1), 193-203. DOI: 10.1080/02626667.2013.802094 [ Links ]
Westenbroek, M. S., Kelson, V. A., Dripps, W. R., Hunt, R. J., & Bradbury, K. R. (2010). SWB - A modified Thornthwaite-mather soil-water-balance code for estimating groundwater recharge. US Geological Survey Techniques and Methods, 6-A31. DOI: 10.1017/CBO9781107415324.004 [ Links ]
Xu, C., & Singh, V. P. (1998). A review on monthly water balance models for water resources investigations. Water Resources Management, 12(1), 31-50. [ Links ]
Zhang, J., Felzer, B. S., & Troy, T. J. (2016). Extreme precipitation drives groundwater recharge: The Northern High Plains Aquifer, central United States, 1950-2010. Hydrological Processes, 30(14), 2533-2545. DOI: 10.1002/hyp.10809 [ Links ]
Received: August 28, 2017; Accepted: November 13, 2018
 Este es un artículo publicado en acceso abierto bajo una licencia
Creative Commons
Este es un artículo publicado en acceso abierto bajo una licencia
Creative Commons
