


 nova página do texto(beta)
 Inglês (pdf)
 Artigo em XML
 Referências do artigo
 Enviar este artigo por email
 Citado por SciELO
  Similares em
SciELO
Similares em
SciELO 
 Permalink
Introduction
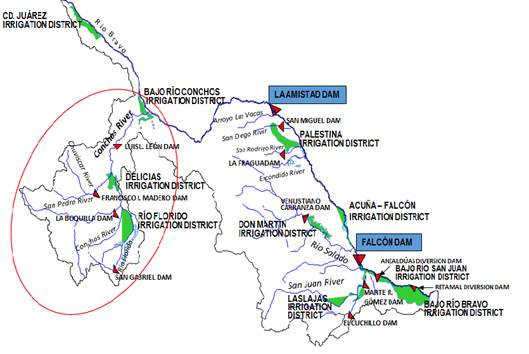
The United States and Mexico share one of the largest basins in North America: the Rio Bravo basin (as known in Mexico) or the Rio Grande basin (as known in the United States). The total area of this basin is 444,560 km2, 229,796 of which are in the territory of the United States and 214,764 in Mexico. Part of the main stream of the Bravo River is also the border between the two countries, with a length of 2,000 km, along which major population centers are located. The basin is characterized by semiarid conditions with a very high climate variability and recurrent droughts.
Due to its demographic and economic development, intensive water use in the basin has led to a condition of water stress (Aparicio, Ortega, Hidalgo, & Aldama, 2009). In addition, the expected effects of climate change will produce a decrease of available water volumes because the negative anomaly of the precipitation, which, together with demographic and economic trends, stands as one of the major future challenges in water management in this international basin. In fact, in recent decades, Mexico has faced increasing difficulties to meet water rights on its territory and, as consequence, to deliver the total volume committed to the United States.
In 1944, both countries signed the Distribution of International Waters Treaty between the United States of Mexico and the United States of America (Mexico-USA, 1944, February 3). Under the Treaty, Mexico receives water from the United States from the Colorado River basin and, in return, shares water with the United States from the Rio Grande basin. Volumes from the Rio Grande basin owned by the United States, with origin in the USA or in the Mexican basin, are stored in the international Amistad and Falcon dams, in which each country has a useful capacity assigned.
The Treaty’s provisions for the distribution of water from the Rio Grande basin establish that all waters draining inside the territory of the United States belong to that country, and Mexico, by its part, is committed to sharing with the US part of the waters draining from its territory to the international mainstream. The volume committed by Mexico is of at least 431.72 million cubic meters on an annual average basis, in cycles which are counted every five years, which means that Mexico must provide the United States with a minimum volume of 2.1586 x 10⁹ cubic meters every five-year cycle. In recognition of the high climatic variability in the region, Mexico can cover that volume in any order within the five-year period.
The Treaty also provides alternatives for cases of extraordinary precipitation or drought. In the case of extraordinary rainfall, the Treaty states that whenever the capacities assigned to the United States in the international dams were filled, all debits shall be considered fulfilled and the water accounting cycle is terminated, and a new one begins. For this reason, there have been treaty cycles with a duration of less than five years.
On the opposite situation, that of drought, when the committed volume of water delivery of the Mexican basin could be not delivered to the United States in a cycle of five years, the Treaty provides that: “in the event of extraordinary drought or serious accident to the hydraulic systems [in the Mexican tributaries] any deficiencies existing at the end of the aforesaid five-year cycle shall be made up in the following five-year cycle”, with water from the same tributaries considered in the Treaty.
For implementing the Treaty and overseeing the fulfilment of obligations, both countries created a binational institution with international character, named the International Boundary and Water Commission (IBWC), which is also in charge of the resolution of conflicts that may arise as result of the Treaty and its provisions (Article 2 of the Treaty). Another key aspect of the Treaty is the possibility of sign "acts" that establish the agreements reached within the IBWC, which, if not challenged by any of the governments within thirty days, become binding (Article 25 of the Treaty). This mechanism has greatly facilitated the water management between the two countries, especially in conditions of water scarcity.
The construction of the Amistad and Falcon international dams, in 1953, gave start to the water delivery scheme in five-year cycles. The first four cycles, from 1953 to 1972, ended with small deficits, that were covered by Mexico. Once the operation of the hydraulic infrastructure had been well established, during the following twenty years there were no major difficulties in delivering water from Mexico to the United States. However, since the 1992-1997 cycle, important deficits have been occurring recurrently. That cycle, for example, ended with a deficit of 1.262 billion cubic meters, equivalent to 58% of the total, and the 1997-2001 cycle ended with an even greater deficit of 1.935 billion cubic meters, nearly 90% of the total five-year contribution.
Deficits in delivering water from Mexico to the United States during recent five-year cycles have caused major conflicts between communities of both countries as well as between local, state and national authorities, which have required the increasingly frequent intervention of the US Department of State and the Secretariat of Foreign Affairs of Mexico (i.e. Texas Center for Water Policy, 2002 and Rubinstein, 2015). In 2005, Texan farmers sued the Mexican government, within the framework of International Centre for Settlement of Investment Disputes (ICSID), for alleged NAFTA violations (ICSID, 2007), in relation with the last drought and deficit delivery. The complaint did not proceed, but it is a clear indication of the level that the water dispute between Texas and Mexico has reached. So far, these conflicts have been resolved through the participation of society, governments, and binational institutions that both countries have created to address issues of binational interest on their borders (Martinez-Austria, Derbez, & Giner, 2013; Chavez, 1999).
However, the difficulty of water allocation continues to grow. Even without climate change, considering only population growth in the region, the volume of renewable water per capita in the Mexican side of the basin is now just 1,063 m3/person/year, placing it on the edge of extreme scarcity (Conagua, 2014).
Moreover, under the Treaty, Mexican contributions to the United States cannot come from any of the tributaries of the Rio Grande, but only from the Conchos, San Diego, San Rodrigo, Escondido, and Salado rivers or from the Arroyo de las Vacas Streem. Of these tributaries, the Conchos River delivers 87% of the total water availability. Hence its importance for both, social development of the downstream Mexican basin, and for complying with the water contributions to the United States.
On the other hand, the Conchos River basin is characterized by the periodic occurrence of droughts and high climate variability. Unfortunately, the history of droughts in Mexico has very little information from those recorded in the northern region of Mexico (i.e. Florescano, 2000; Ortega Gaucin, 2013), due mainly to the fact that these territories were found depopulated or with small populations up until the late nineteenth century, when the first large urban settlements were developed. However, it is possible to reconstruct droughts over long periods of time using proxy data, such as the study of tree rings.
For the state of Chihuahua, where the Conchos River basin is located, Cerano-Paredes et al (2009) used a series of tree rings from the natural reserve known as Cerro El Mohinora located in the basin of the Florido River, a tributary of the Conchos River in the upper area of Chihuahua, on the border with the states of Sinaloa and Durango. This is the region of the basin where most of the precipitation occurs. With this technique, Cerano-Paredes et al (2009) reconstructed the series of precipitation of the past 350 years. They found intense drought during the 1698-1718, 1785-1786, 1798, 1807, 1908, 1935, 1970 and 1994-2005 periods. The stages of more intense droughts on record coincide with historical data chronicled from their effects on the society of the time.
Data analysis and methodology
While proxy series analysis allows observe trends in a very long term, this type of analysis does not permit sufficiently accurate analysis of rainfall trends and variability, especially in a climate that may have changed in recent decades. Additionally, the series of tree rings studied by Cerano-Paredes et al (2009) correspond to the region with the highest precipitation in the basin, and are hardly representative of the rest, which is a markedly arid zone. In this case, the direct study of historical series in various areas of the basin is required.
For a study of recent historical rainfall trends in the basin, the Standardized Precipitation Index (SPI) is being used, which is a method used and recommended by various renowned meteorological and research centres (Hayes, Svoboda, Wall, & Widhal, 2011). According to the observed SPI value, the actual precipitation could be characterized, as shown in Table 1, from extremely wet (SPI ≥ 2) to extremely dry (SPI ≤ -2).
The SPI can be calculated in different periods, the most frequently used are one, three, six, and twelve months. Each of these periods have a different physical meaning. SPI values of one and three months reflect the condition of rainfall in very short periods. They can be used to identify the onset of drought, or to determine the effects of a significant deficit in short periods; for example, during the planting season or the flowering of crops. Caution is needed in the interpretation of these parameters in regions where low rainfall is normal during the dry season. The SPI at six months is significant to identify variations in precipitation between stations, and SPI for twelve months can be used to identify droughts of long duration. Moreover, if an SPI value of drought occurs during the rainy season, it can be a signal of a period of drought that will have important impacts on society.
Table 1 Standardized Precipitation Index and wet or dry conditions (WMO, 2012).
| Standardized Precipitation Index | Wet or dry conditions |
|---|---|
| 2.0 and more | Extremely wet |
| 1.5 to 1.99 | Very wet |
| 1.0 to 1.49 | Moderately wet |
| -0.99 to 0.99 | Near normal |
| -1.0 to -1.49 | Moderately dry |
| -1.5 to -1.99 | Severely dry |
| -2 and less | Extremely dry |
In this paper, we use the SPI trend analysis to study the recent precipitation tendency, and determine if there are signals of climate change effects on the basin, as the general circulation models suggests for the region.
Once the recent trends of precipitation are determined, it is necessary to establish possible future scenarios. Complex systems, such as a drainage basin, are subject to high uncertainty, so one of the most widely applied techniques for modelling the future are dynamic simulators, which allow to study and predict the behaviour of the system under different possible scenarios (Simonovic, 2009). There are several computer systems designed specifically for systems simulation. In this research, Vensim has been used, which is one of the most widely used software for the modelling of complex systems, in general, and for water resources management in particular (i.e. Goncalves & Giorgetti, 2013 and Abadi Khalegh, Shamsai, & Goharnejad, 2015).
The dynamic simulation model will be used to assess the change over time of the water balance as it is affected by changes in the governing variables, mainly population, temperature, and water supply and demand. In order to compare with endorsed data, the water balance will be calculated using the official procedure set by the National Water Commission of Mexico, that is the Mexican Official Standard NOM-011-Conagua-2015, that establishes the specifications and method for determining the annual average water availability (Comisión Nacional del Agua, 2015). According to this standard, the average annual availability is given by the equation:
Where Dm is the average annual surface water availability in the basin, Ve is the average annual runoff volume of the basin toward downstream, and Vc is the volume committed downstream.
The Ve volume is calculated by the following equation:
Where:
Vaa |
Average annual runoff volume from the catchment upstream |
Vn |
Annual average volume of natural runoff in the basin |
Vr |
Annual volume of returns of the various water uses |
Vi |
Volume of water imported from other basins |
Vex |
Annual volume of water exported from the basin to other basins |
Da |
Annual volume of surface water consumption, i. e. water demand for different uses |
Vev |
Annual volume of evaporation from reservoirs |
Vd |
Annual average volume variation of reservoir storage |
This equation, seemingly simple, becomes complicated when variation over time is analysed, because the variables are interrelated, and their determination is not simple. For example, urban water demand will depend on changes in population over time, and the agricultural water demand depends on temperature and the kind of crop, which affects the water requirements of crops.
Study area
The Conchos River basin is located almost entirely in the state of Chihuahua, except a very small fraction in the upper basin, which belongs to the state of Durango. Most of its population lives in urban areas; according to the population census of 2010, only 17% is located in rural villages.
The state of Chihuahua, with a population of over 3 million, has 43 municipalities within the Conchos River basin, where a population of 1.7 million is located, with growth rates shown in Table 2. These high historical growth rates will be maintained in the coming decades. Figure 2 shows the estimated population growth in the basin until 2030, using estimations of the CONAPO (National Commission of Population) when population in the Conchos River basin will reach 1.86 million. Nevertheless, the rate of population growth is declining, which is taken into account in the simulation model.
Precipitation in the basin is very variable, reaching 700 mm per year on average in the upper part of the basin, 350 mm per year in the middle, and only 250 mm at the lower region. Hence, this basin is located in a semiarid region; the main runoffs occur in the upper area, in the mountains that surround it.
Table 2 Population growth rates/by year (%) (inter-census average) of Rio Bravo and Conchos Basins (calculated with INEGI census data).
| 1995 | 2000 | 2005 | 2010 | |
|---|---|---|---|---|
| Rio Bravo Basin | 3.18 | 2.08 | 1.45 | 0.96 |
| Conchos River Basin | 1.89 | 0.70 | 1.42 | 1.63 |
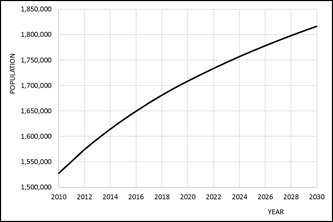
Figure 2 Projections of the population living in the Conchos River Basin (data from the National Population Commission CONAPO).
The Conchos River basin has a total area of 65,770 km2, and is composed by the sub-basins of the Florido, Parral, Ballymena, San Pedro, and Chuviscar rivers, besides its own basin (Conagua, 2011). A major water infrastructure has been built in the Conchos River and its tributaries, including large dams with a total storage capacity of 3.87 billion cubic meters, apart from other small dams and levees.
The main water use is agriculture. There are four irrigation districts in the basin, covering an irrigable area of 128,137 hectares, rarely cultivated in full. In the 2013-2014 agricultural cycle, for example, only 58% of the total area (Conagua, 2015) was planted. Ninety percent of the volume of water consumed in the basin is for agricultural use..
Results and Discussion
Precipitation trends
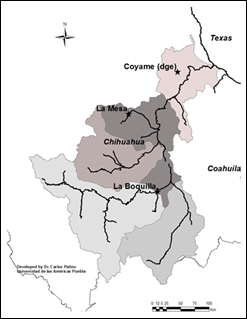
In trend analysis of precipitation, data from meteorological stations located in the basin must be used. In the Conchos River basin, several stations are located, however, many of them have stopped operating for several years, others have long historical periods but with poor quality, and others have a period of registration too short for an analysis of variability. However, as one of Mexico's largest basins with water infrastructure, it was possible to have enough information stations in the upper, middle and lower part of the basin. Table 3 shows the stations used in the analysis and their graphical location in the basin can be seen in Figure 3.
Table 3 Climatological stations used in the study.
| Station number | Name | Date of operation start |
|---|---|---|
| 8037 | Coyame | 01/10/1964 |
| 8085 | La Boquilla | 01/06/1949 |
| 8270 | La Mesa | 01/11/1975 |
As mentioned above, to determine recent trends in precipitation, Standardized Precipitation Index values for 6, 9, and 12 months were calculated, as shown in Figures 4, 5, and 6.
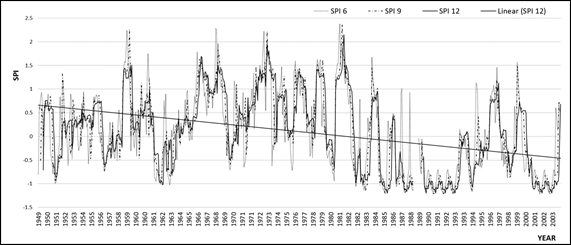
Figure 4 Standardized Precipitation Index (SPI) for 6, 9, and 12 months, La Boquilla station. SPI linear trend for 12 months is also shown.
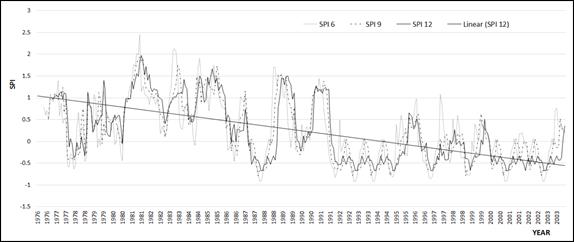
Figure 5 Standardized Precipitation Index (SPI) for 6, 9, and 12 months, La Mesa station. SPI linear trend for 12 months is also shown.
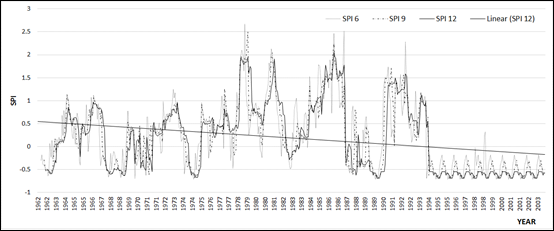
Figure 6 Standardized Precipitation Index (SPI) for 6, 9, and 12 months, Coyame station. SPI linear trend for 12 months is also shown.
Throughout the basin, especially since the nineties, a decrease in precipitation is observed. This trend is less pronounced in the upper part of the basin (La Boquilla station), and clearer and more significant in the middle (La Mesa station) and the lower area (Coyame station).
In addition, also since the nineties, a decrease is observed in climate variability, particularly in the lower part of the basin, the most arid zone. Thus, in the Coyame station, since 1994, SPI values are maintained in the range of dry or slightly dry, except for a rain event in 1998 that is recorded in the SPI 6. This behaviour contrasts with the precipitation variability observed in the 1975-1992 period, in which periods of high values of SPI alternated with other dry or slightly dry periods.
In the middle part of the basin, characterized by the La Mesa station, it is also observed a decreasing precipitation trend since l990. Since then, there have been no recorded SPI values above 1.5, as happened several times in the registry between 1980 and 1990. In fact, since 1990 the SPI 12 no reached values greater than 1, indicative of moderately humid climate, remaining since in then the range from 0.5 to -0.5; which also indicates a decrease of climate variability.
Finally, in the upper part of the basin, characterized by La Boquilla station, a decrease in precipitation is also observed since the nineties. At this station, located in the area of highest rainfall of the basin, the trend is less evident. However, it can be seen that while in the period from 1957 to 1985 several wet or moderately wet episodes were recorded, since 1985 no SPI-12 values greater than 1 have been observed, and prolonged periods of moderate drought were observed in the years 1989-1992 and 2000-2002.
In general, in all records analysed, the linear regression curve (which can only be considered as indicative of a trend) is clearly negative. In short, there is already an observable tendency to increased dryness in the basin.
Moreover, the decrease in rainfall variability is also a major problem for water management in the basin. This is because they have often been the extraordinary rains that have produced surpluses in the basin, spills, and transfers to the lower Rio Grande basin, which has allowed the fulfilment of the commitments of Mexico with the United States, provided in the 1944 Treaty.
These observed trends are in accordance with the provisions of climate change scenarios for the basin. Rivas Acosta, Güitron de los Reyes, & Ballinas González (2010) implemented a multi-model and downscaling analysis and conducted a detailed analysis of the Conchos River basin. As a result, they estimate that the decline in rainfall at the end of the century will be between 15 and 21% over that recorded historically until 2009, by the SRES A2 scenario.
Rivas Acosta, Güitron de los Reyes, & Ballinas González (2010) conducted an assessment of the expected variations in runoff for the Conchos River using the so-called indirect method recommended by the National Water Commission (Comisión Nacional del Agua, 2015). For the A2 scenario, they predict decreases in runoff between 23 and 27% by the end of the century, as shown in Figure 7. These estimates will be considered in the dynamic simulation model to calculate the decrease in water availability.
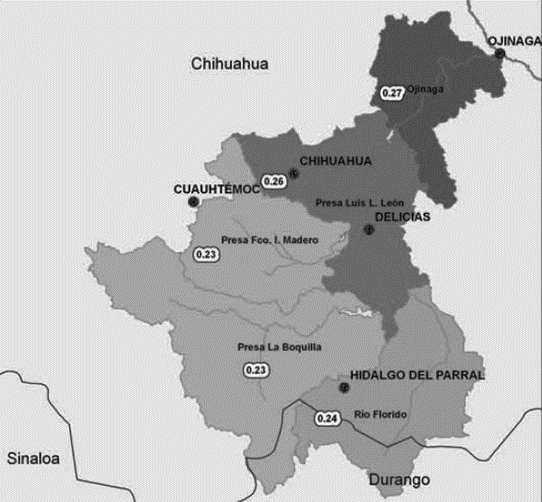
Figure 7 Changes expected in the natural availability in the Conchos River basin towards the end of the century, on the A2 scenario. Percent of decrease. (Rivas Acosta, Güitron de los Reyes, & Ballinas González, 2010).
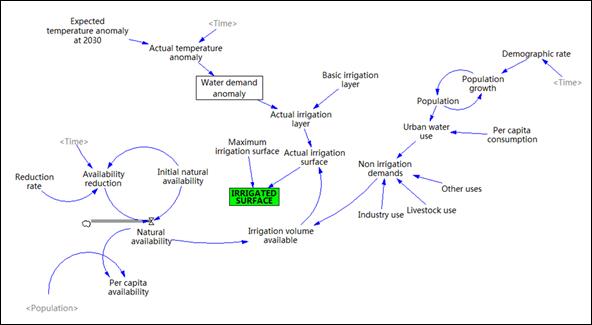
Dynamic Simulation Model
Figure 8 shows the dynamic simulation model in Vensim. The main water uses considered are agricultural demand, which is separated for each of the irrigation districts, and which will change due to the effects of climate change; and urban water demand, which will be modified mainly by population increase.
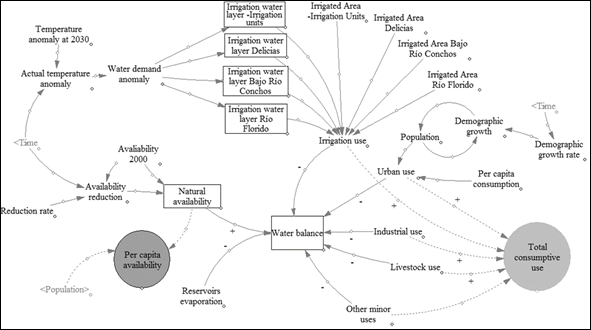
The basic information considered for modelling consisted on the water demands for different consumptive uses-agricultural, urban public, industrial, livestock and other minor uses-as well as population and surface irrigation data. This basic information was obtained from the study on water availability in the basin, published by the National Water Commission (Conagua, 2011). In the simulation model, the irrigation demands used were those reported by the National Water Commission in the agricultural statistics report (Conagua, 2015).
In the model, three scenarios were simulated, one without considering climate change and two others considering climate change under the A1B and A2 scenarios. In these scenarios we use the above mentioned results of Rivas Acosta, Güitron de los Reyes, & Ballinas González (2010) for changes in water availability; and RCP 6.0 and 8.5 for temperature scenarios, published by the National Institute of Ecology and Climate Change (INECC, 2016). The resulting changes in temperature, population, and natural availability due to climate change are shown in Table 4.
Table 4 Simulated scenarios with and without climate change effects.
| SCENARIO | Population increase 2010-2030 | Change in water availability 2010-2030 | Change in temperature (°C) 2010-2030 |
|---|---|---|---|
| BASELINE SCENARIO | 289,000 | 0 | 0 |
| SCENARIO 1 | 289,000 | -17% | +1.5 °C |
| SCENARIO 2 | 289,000 | -20% | +2 °C |
The increase in urban water demand is related directly to population growth. According to population projections, there will be a declining growth rate of 0.01 per year in 2010 to 0.006 in 2020. The model assumes that the population growth rate will stabilize, as of 2020, at 0.005 annually.
The increase in agricultural water demand due to climate change is calculated by considering the change in the consumptive use caused by the change in temperature. For this purpose, the Blaney-Criddle method is used, which was developed in the same climatic region in the United States, and has produced good results in Mexico. It is the method recommended by the Ministry of Agriculture of Mexico (Sagarpa-Colegio de Postgraduados, 2008).
The dynamic model was validated with the water balance data produced by the National Water Commission (Conagua, 2011). With a total availability in the basin of 2,254.9 Hm3, the difference between the dynamic model results and those calculated by Conagua in the water balance at the basin outlet is 36.8 Hm3, which is considered a good aproximation.
The first scenario, referred to as the "baseline scenario" in this paper, does not consider the effects of climate change, but only the effects of population growth. Subsequently, the results of two climate change scenarios were tested. In Scenario 1 a temperature increase of 1.5°C and a decrease in water availability of 17% between 2000 and 2030 were considered. The second scenario considered an increase in temperature of 2°C and a decreased water availability of 20% between 2000 and 2030.
Figure 9 shows the results of change in the total consumptive use in those three scenarios. The most important impact on water use in the basin is agriculture, which accounts for over 90% of the total, so the increase in water irrigation demand caused by climate change is very relevant. In the baseline scenario, however, in which only the population growth impact the water demand, increased consumptive use is much more moderate.
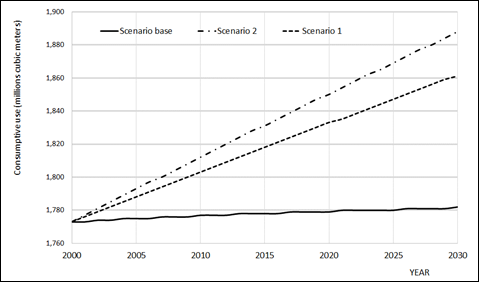
Figure 9 Change in total consumptive use in the basin under various scenarios, with and without climate change.
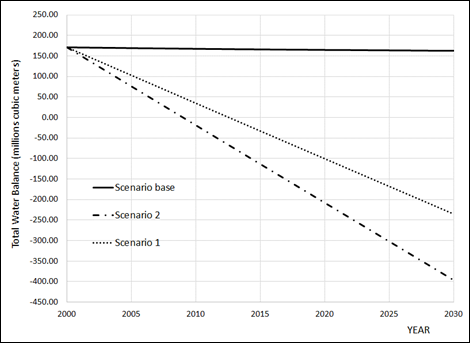
The water balance of the basin, meanwhile, would change dramatically in the coming years, becoming negative in eight years, in scenario 2, and in 13 years, in scenario 1, as shown in Figure 10. In the case of a scenario without climate change (baseline scenario), the water balance would decline slightly, which is almost not perceptible in the graph, as a result only of population increase.
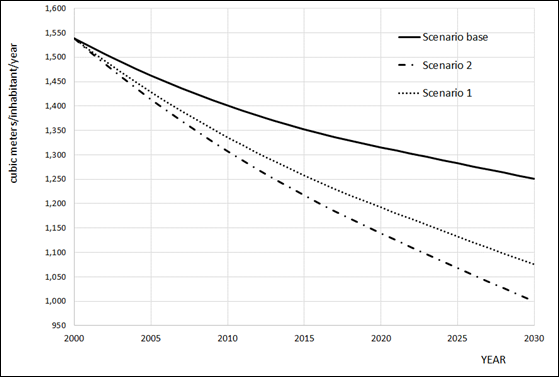
Figure 10 Change in the water balance in the basin under different scenarios, with and without climate change.
Finally, the water availability per inhabitant would exhibit the variation shown in Figure 11, approaching the condition of extreme scarcity at the end of the analysis period.
Sensitivity Analysis
As the previous results shown, the main driving forces of the system are those related with climate change. Both, the diminishing of the natural availability and the increase on irrigation water demand. As these parameters are scenarios dependent, it is important to study the system sensitivity in relation with them.
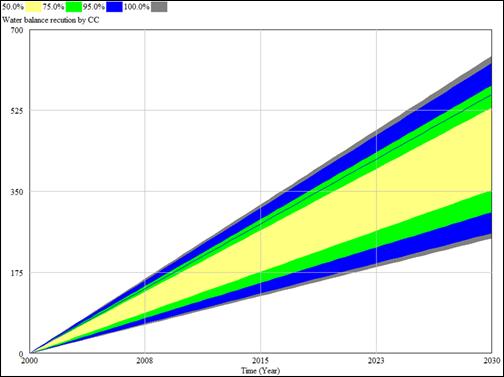
Hence, a Montecarlo analysis was performed, with the aim of analyse the system behaviour against variations of climate change variables. We use a range of water availability variation between -10 until -25%; and a range of temperature variation between +0.5 °C to 2.0 °C. A uniform probability distribution was used in the Montecarlo analysis.
The resulting sensitivity range is shown in figure 12, for the water balance reduction effect of climate change in the system. With a probability of 95%, the water balance will result reduced among 260 and 610 millions of cubic meters.
Adaptive dynamic model
It is evident that it is impossible the water management in the watershed with a negative water balance. Hence, we develop an adaptive dynamic model, through which we can calculate the farming surface land what could it be irrigated with the water available reduction and the demand increase due to climate change, under the scenarios described above.
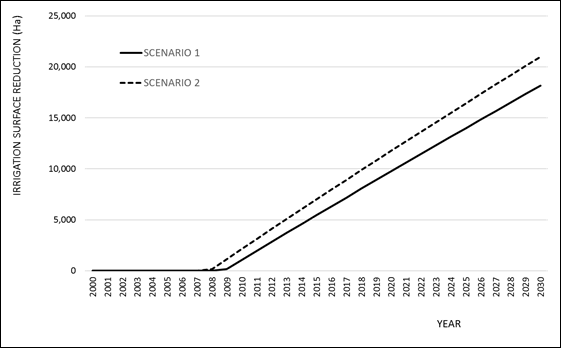
Figure 13 shows the adaptive dynamic model. In this case, the irrigation surface will change, adjusting the water availability. The rest of the water uses, because they are very small, will remain without any adjust. That is, the climate change adaptation must happen in the irrigation system.
The changes in the resulting irrigated land are presented in figure 14, under the three simulated scenarios. The irrigation surface reduction, at the end of the period analysed, could be among 18,160 Ha in the scenario 1, until 20,990 Ha in scenario 1. This means a reduction between 15.7% and 18.2% with respect to the total irrigation surface now a day.
Conclusions
The Conchos River basin contributes with 87% of the volume that Mexico must deliver to the United States under the Treaty of Water Distribution between the two countries. The hydraulic infrastructure built in the Conchos River basin uses virtually all the water in average years, and the fulfilment of Mexico’s commitments has been historically achieved with contributions from rainy years. Because of the great historical hydrological variability, this criterion had allowed compliance with the Treaty on the five-year cycles mentioned above. However, as shown in this text, precipitation in the basin is declining, most likely due to climate change. Another concern is that variability is decreasing, with fewer years of extreme high precipitation. Climate change models predict significant temperature increases in this region and decreases in natural water availability.
To estimate the future effects of population growth and climate change on the water balance, a dynamic simulation model was developed, which estimates the effects of these variables on the average water availability and water balance in the basin. In the two climate change scenarios, within 8 to 11 years, the water balance of the basin will become negative, i.e., it will not be possible to meet the demand of water allocated in the basin. As the adaptive dynamic model has shown, without adaptation measurements, the irrigation surface will be drastically reduced. In order for Mexico to meet the demands of its own water users in the basin as well as its commitments established in the Water Treaty with the United States, an extensive program of climate change adaptation must be designed and implemented immediately, based basically on irrigation efficiency, but considering also the care and rational use of water by the population in urban centers

