


 texto em
  Inglês (pdf)
 Artigo em XML
 Referências do artigo
 Enviar este artigo por email
 Citado por SciELO
  Similares em
SciELO
Similares em
SciELO 
 Permalink
Introduction
As urbanization increases rapidly along with population density, spatial planning issues become very important for the sustainable management of water resources. The quality of the living environment should be high, while the safety of the area should be guaranteed as well. One of the main problems that face urban hydrology is the accurate calculation of the urban water balance. To achieve such goal, the application of a reliable hydrological simulation model can help to predict the water balance after a rain storm event (Dey & Kamioka, 2007). For Dey and Kamioka (2007), the correct prediction of flood extents in urban catchments has become a challenging issue since traditional urban drainage models only consider the sewerage network that is able to correctly simulate the drainage system to the point at which there is no overflow from the network inlet or manhole. Therefore, when such overflows exist due to insufficient drainage capacity of downstream pipes or channels, it becomes difficult to reproduce the actual flood extents using these traditional one-phase simulation techniques. As a result, the correct flooding situation is rarely addressed by those traditional models. From a modeling perspective, this can be achieved using the urban water balance as the conceptual framework, where the inputs are rainfall, evapotranspiration, and the piped water supply, and the outputs are basin drainage and the change in storage in the natural components (soil and ground water aquifers) and the built components (pump stations and hydraulic structures) of the urban system (Mitchell, Deletic, Fletcher, Hatt, & McCarthy, 2007). One of the main problems with water balance in urban hydrology is the quantification of the recharge, since the sources and pathways for groundwater recharge in urban areas are more numerous and complex than in rural environments (Grimmond & Oke, 2002). Grimmond and Oke (2002) found that recharge in urban areas is now widely recognized to be usually as high or higher than in equivalent rural areas. Their research showed that holistic approaches are recommended for use whenever possible, for example by investigating the overall water balance or calibrating a groundwater flow model. On the morning of June 10, 2000, east Spain was affected by a rain storm event on the Mediterranean coast that usually presents short recurrence intervals, and which produced a significant increase in flow in the sub-basin of the Catalonian region (Amengual, Romero, Gómez, Martín, & Alonso, 2007). Amengual et al. (2007) applied and calibrated the HEC-HMS hydrologic model in the Llobregat River basin, with a drainage area of 5 040 km2, to study the watershed’s hydrological response to this flood event using rain gauge rainfall data. The results showed a reasonable reproduction of the observed discharge at the basin’s outlet and that the HEC-HMS appeared to be a suitable tool for the hydro-meteorological forecasting of flash floods in the Llobregat basin (Amengual et al., 2007). In the mainly urban, 370 km2 basin of Kifissos, located in Greece, a system for forecasting flood risk using an integrated hydro-meteorological system was applied. The results are encouraging for this initial operational stage, however, the authors indicated that integrated hydro-meteorological models are tools that have not yet matured (Koussis et al., 2003). The objective of this research is to apply the runoff model known as the Hydrologic Engineering Center’s Hydrological Modeling System (HEC-HMS) to Florida’s urban C-11 basin for seven events, to calibrate the model using the accumulated observed discharges as reference, and to validate the model with seven other events using the parameters obtained from the calibration.
Data description and HEC-HMS application
The South Florida Water Management District (SFWMD) is one of many institutes that focus on the management and protection of the water resources in the state of Florida, USA. Its mission is to find a good balance in the availability of their limited water resources, which affect more than 7.5 million people living in south Florida (Skinner, Bloetscher, & Pathak, 2009). SFWMD operates and maintains the C-11 basin’s water management system in the city of West Palm Beach, with an administrative surface area of approximately 251.22 km2 (Tillis & Swain, 1998). The C-11 basin is divided administratively in two sub-basins: C-11-East with 68 km2, which represents 27% of the total basin area, and C-11-West with 184 km2, which represents close to the 73% of the total basin area. The west side of the C-11 basin is bordered by Water Conservation Area 3A (WCA-3A) and the Everglades swamps, and the east side by the metropolitan areas of Fort Lauderdale along the Atlantic Ocean coastline (Tillis & Swain, 1998). Since 1985, the C-11 basin has experienced population growth; therefore, several new hydraulic structures have been created for the management of the basin, as shown in Figure 1 (Pathak, 2008).
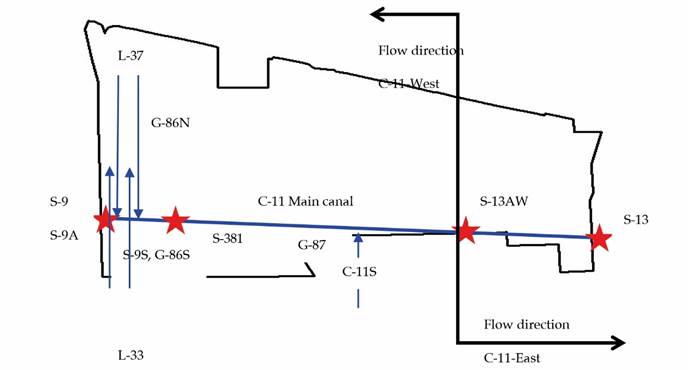
Figure 1 C-11 basin structures: C-11S, G-86N, G-86S, L-33, L-37, S-9N, S-9S canals. S-9, S-9A, and S-13 pump stations. S-381 and S-13 spillway. S-13AW culvert and flow directions.
South Florida has a relatively wet climate with an average annual rainfall accumulation of 1 321 mm (Skinner et al., 2009). According to Skinner et al. (2009), rainfall can vary significantly in the region due to weather extremes that range from intense droughts to hurricanes. These events impact heavily upon the required actions for water supply and flood protection. Actions to have control over such events have led to the development of a series of hydraulic structures in the C-11 watershed, which include drainage channels C-11, C-11S, L-33, and L-37, spillways S-381 and S-13, culverts S-13A (until April 29, 2008), S-13AW (since April 29, 2008), S-9XS, G-86N, G-86S, and G-87, and pump stations S-13, S-9, and S-9A (Pathak, 2011). Specifically, the C-11-East sub-basin is drained via the S-13AW culvert structure and the S-13 structure, which contains a pump station. It is discharged via a spillway containing a vertical lift gate. The C-11-West basin is drained via pumps at S-9 and a pumping system at structure S-9A, consisting of two electric pumps and two diesel pumps (Pathak, 2011). The C-11 basin, canals, and control structures have three purposes: to provide flood protection and drainage for the watershed, supply water during low natural flow periods, and control and intercept seepage from WCA-3A (Pathak, 2011). To achieve these goals the following rules are applied for the management of the C-11 structures: In the C-11-West sub-basin, excess water is pumped using the S-9 pump station into the Everglades watershed WCA-3A, located west of C-11-West. When pumping stations S-9 and S-9A, located in the C-11-West sub-basin, reach their pumping capacity, additional excess water can be discharged from C-11-West to C-11-East by the S-13A (S-13AW) culvert station (Pathak, 2011). Excess water in the C-11-East sub-basin is discharged to the South Fork of the New River located east of C-11-East using the S-13 pumping station and spillway. In the L-33 canal, the rate of seepage from the Everglades to the C-11 canal is regulated by the stage held by the S-9XS pipe culvert. The flow direction in L-33 may be changed, either to the north through the C-11 basin or to the south through the C-9 basin, south of the C-11 basin, depending on the operation of S-9XS (Pathak, 2011). The S-13 spillway structure is operated to maintain an optimum headwater elevation of 0.5 m, when sufficient water is available to maintain this level (Manriquez, Wilsnack, & Li, 2009). The automatic controls on the spillway will function as follows: when the headwater elevation rises to an elevation of 0.6 m, the gate will open. When the headwater elevation falls or rises to an elevation of 0.51 m, the gate will stay as is. And when the headwater elevation falls to 0.49 m, the gates will close. In addition to maintaining optimum upstream freshwater control as described above, the automatic gate controls on this structure have an overriding control that closes the gates regardless of the upstream water level, in the rare event of a high flood tide, whenever the differential between the head and tail water pool elevations reaches 0.07 m (Pathak, 2011). During this operation, when the upstream float sensor indicates that the gate should open, the gate opens a minimum of 0.8 m. If this opening results in a headwater stage below the gate close level, as it often does, the gate will begin to close and the normal automatic operation will take control. The S-13 pump station is operated whenever the water level in the C-11 canal, west of the structure, exceeds the optimum elevation of 0.76 m above mean sea level and the water level east of there is less than 2.43 m above mean sea level. In addition, the pumps are used when excessive rainfall and/or high tides are predicted, which could compromise gravity operation. G-86S stop logs are normally set with a crest elevation of 1.67 m (Pathak, 2011). The stop logs are removed during periods of heavy rainfall when the stage in the U.S. 27 drainage ditch (which is located at the West Hollywood Lakes development near the drainage divide to the C-9 basin) rises above 1.67 m. These are replaced when the stage at West Hollywood Lakes drops below 1.67 m. S-9XS stop logs are set to a crest elevation of 1.83 m. When flood conditions in the C-11 basin are not present, the stop logs may be removed when the threshold of 2.12 m is exceeded at S-9XS (Pathak, 2011).
HEC-HMS was designed to simulate the precipitation-runoff processes in dendritic basin systems (USACE, 2009) with an integrated work environment including a database, data entry utilities, computation engine, and results reporting tools (Scharffenberg, 2001). The auxiliary HEC-GeoHMS program allows for the integration of GIS with the HEC-HMS basin model, which uses spatial analysis for the development of hydrologic parameters and enables the use of radar rainfall and other advanced techniques for modeling a basin at the grid level (USACE, 2009). HEC-HMS is designed to be applicable for a wide range of geographic areas for solving a broad range of problems, such as: large river basin water supply, flood hydrology, and small urban or natural basin runoff (USACE, 2009). HEC-HMS can be applied to a variety of basins having different shapes, sizes, and characteristics. The graphical user interface makes the program user-friendly and is available in the public domain. HEC-HMS can be a very helpful tool for the estimation of urban flooding, flood frequencies, flood-loss reduction, flood warning systems, reservoir design, and other environmental studies (Shamsi, 1997). Figure 2 shows the administrative (black) and natural (red) boundaries as well as the main streams (blue) in the C-11 basin, applying the usual methodology for basin delineation using HEC-GeoHMS.
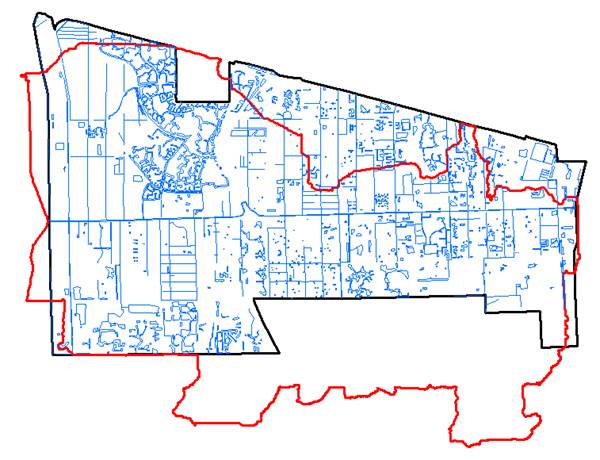
Figure 2 Florida’s C-11 basin: administrative (black) and natural (red) borders and the main streams (blue).
The parameters for the model were calculated for the final schematization of the HEC-HMS in the Florida C-11 basin. For the calculation of the curve number (CN), first the land cover types were classified into four categories: water, medium residential, forest, and agricultural. Then, the soil table from the map of soils was obtained and populated with soil codes A-B-C-D, for every soil type, and then the percent of every soil type was divided by the basin area (Merwade, 2007). The curve number (CN), the initial abstraction (Ia), and the time of concentration (Tc) were obtained from the SCS TR55 (Cronshey, Roberts, & Miller, 1985). The percent of impervious area (PctA) was determined as 70% of the urban area in each sub-basin. The reservoir storage coefficient (SC), which represents the storage effect of the stream channel, is calculated from an observed flood hydrograph of the basin. SC is graphically computed as the ratio of volume under the hydrograph after the second inflection point, under the recession curve, to the value of the flow at the point of inflection (POI) (USACE, 2009). The recession baseflow is designed to approximate the typical behavior observed in basins when channel flows recede exponentially after an event. HEC-HMS requires storage-elevation curves for the hydraulic structures defined in the model. These curves were calculated based on the cross-section information of the structures and the upstream canal lengths, which were used to calculate the volume as a function of height.
Time-series of precipitation, groundwater and flow data events for the calibration and validation of the model were provided by the SFWMD for seven events for calibration and seven events for validation.
The simulated and observed accumulated discharges for the seven events were compared using R-squared linear regression and the Nash-Sutcliffe model of efficiency (Nash & Sutcliffe, 1970) given by Equation (1):
Results and discussion
The calibration was conducted to achieve an R-squared linear regression coefficient closer to 1 for the total observed versus simulated accumulated discharges for each event in the C-11 basin (accounting for both C-11-East and C-11-West sub-basins). The two HEC-HMS parameters selected for the calibration are the baseflow and the storage coefficient. The baseflow is used to produce a water contribution in order to achieve the water balance when the basin is in normal conditions. The storage coefficient was selected for calibration since 1) it is the only parameter that is not determined based on physical principles and the data available and 2) the modeled water balance error statistics exhibit strong sensitivity to variations in this parameter. Calibration and validation were plotted with a 45° line for every period (two) in the seven events, between the observed and simulated accumulated discharges in the C-11-West sub-basin, the C-11-East sub-basin, and the entire C-11 basin (Figure 3, Figure 4).
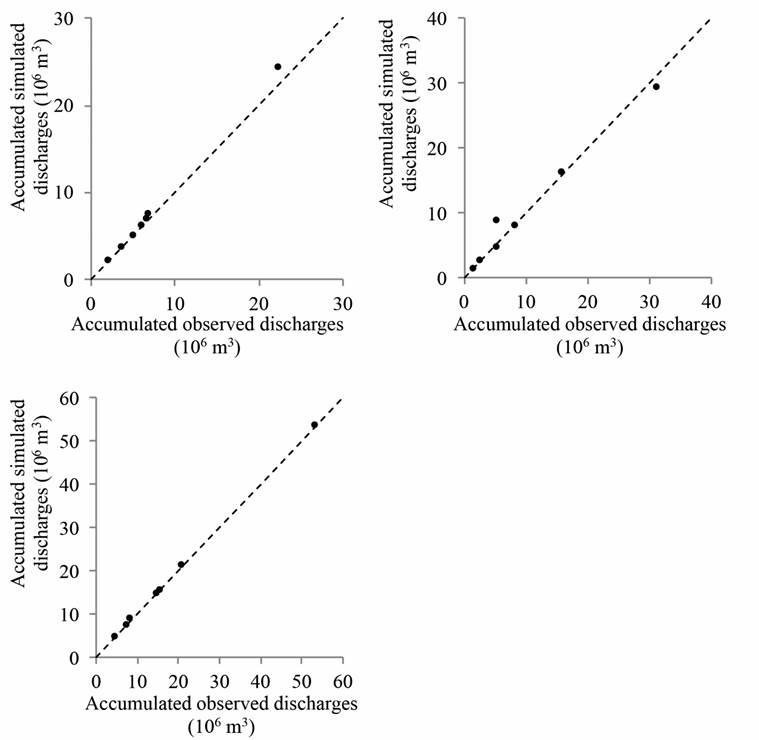
Figure 3 Observed and simulated accumulated flows with a 45? line for the calibration of the seven events: sub-basin C-11-West (upper left), sub-basin C-11-East (upper right), and the entire C-11 hydrographic watershed (lower left).
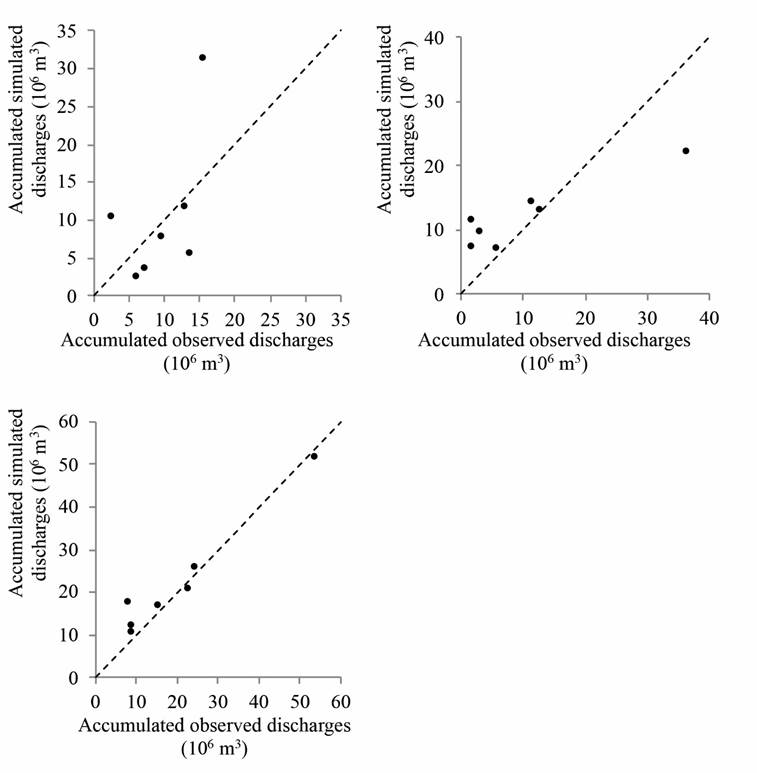
Figure 4 Observed and simulated accumulated flows with a 45? line for the validation of the seven events: sub-basin C-11-West (upper left), sub-basin C-11-East (upper right), and the entire C-11 hydrographic basin (lower left).
R-squared linear regression and Nash-Sutcliffe were calculated for the calibration and validation of the model, between the observed and simulated accumulated discharges for the seven events (two periods) in the C11-West sub-basin, the C-11-East sub-basin, and the entire C-11 basin. The results are summarized in Table 1a and Table 1b.
Conclusions
The HEC-HMS model was calibrated and its accumulated discharge simulations were validated based on two seven-sample time events in the C-11 basin in south Florida. The model reproduced the water balance of the basin, but not the exact timing of the flows at the S-9/S9A or S-13 structures. The cause of this mismatch is due to: 1) the operation of the structures not always following the criteria set for the pump operation, which could cause a major discrepancy between observed and simulated flows as well as between the stages, and 2) the lack of precise data about the geometry of the C-11 canal cross sections. The pumping at the S-9/S9A and S-13 structures is controlled by the elevation-volume relationships and the flow rate in the canal. Therefore, inaccurate data about the canal’s cross section would impact the triggering of the pumps. In addition, the subjective operation of the pumps cannot be related to the physical processes that result in pumped flows, which in some of the events exceeded the accumulated rainfall in the basin. The calibration of the HEC-HMS during the seven events showed that the storage coefficient parameter was strongly consistent for the HEC-HMS initial working conditions, dry, wet, and normal conditions in C-11-West, with small variations in C-11-East across the seven events. The baseflow fraction was moderately consistent with the basin conditions throughout the seven events in the C-11-West and C-11-East sub-basins. The R-squared linear regression for the calibration between the observed and simulated accumulated discharges for the seven events are: 0.99 in the C-11-West sub-basin, 0.98 in the C-11-East sub-basin, and 0.99 in the entire C-11 basin. The Nash-Sutcliffe model of efficiency for the calibration between the observed and simulated accumulated discharges for the seven events are: 0.98 in the C-11-West sub-basin, 0.97 in the C-11-East sub-basin, and 0.99 in the entire C-11 basin. Therefore, the calibrated model analysis exhibited strong agreement between observed and simulated accumulated discharges, and based on the model’s calibration performance, we conclude that it is possible to use the two HEC-HMS parameters that were selected, namely, the storage coefficient and fraction of baseflow, to represent the response of the basin to rainfall and initial conditions.
The R-squared linear regression for the validation of the observed versus simulated accumulated discharges for the seven events are: 0.57 in the C-11-West sub-basin, 0.86 in the C-11-East sub-basin, and 0.95 in the entire C-11 basin. The Nash-Sutcliffe model of efficiency for the validation of the observed versus simulated accumulated discharges for the seven events are: -2.1 in the C-11-West sub-basin, 0.57 in the C-11-East sub-basin, and 0.92 in the entire C-11 basin. In terms of validation, the application of HEC-HMS shows that the simulation of the total water balance in the Florida C-11 basin was highly accurate, but not so precise for the C-11-East and C-11-West basins separately. The source of this mismatch could be due to the lack of precise information about the groundwater table, seepage contributions in the western part of the basin, tidal effects on the eastern boundaries, and the lack of accurate information about the canal geometries, in order to derive more accurate elevation-volume relationships at the structures, and the accurate schedule of the pump operations at the beginning of every simulated event. The proper assessment of the variables listed above can improve the capacity of the HEC-HMS as a reliable model to obtain highly accurate water balance in urban hydrology. Also, with the use of the model, a new pump schedule can be obtained to save energy, given that every one of the simulations always had pumps in reserve. In addition to the results obtained from simulating the accumulated discharges, the delineation of Florida C-11 was tested, the HEC-HMS was designed to simulate dendritic precipitation-runoff processes with only one outlet and one flow direction. The changes were made in the original model, which divides the basin into two sub-basins with two opposite outlets, demonstrating that the HEC-HMS can be used for a wider hydrologic scenario than what was initially assumed for the model. Based on this, the delineation of the Florida C-11 basin showed significant differences between the administrative and natural borders of the basin. Due to the demands for proper governance of all the water systems that affect the population living in urban areas, and the impact on socio-economic and environmental issues, a hydrological simulation model can be used as an important environmental tool for efficiently managing all aspects of the urban water system, such as sanitation, water supply, and flood protection.

