


 nova página do texto(beta)
 Inglês (pdf)
 Artigo em XML
 Referências do artigo
 Enviar este artigo por email
 Citado por SciELO
  Similares em
SciELO
Similares em
SciELO 
 Permalink
Introduction
The genus Origanum and Thymus belong to the Menthae tribe in the Lamiaceae family. For centuries, many species of this family have traditionally been collected and used for treating various ailments. Nowadays, this species arose interest in the cosmetic, pharmaceutical, and food industry, due to their antimicrobial, antioxidant, and antitumor properties [1-4]. The evaluation of the chemical composition EOs (essential oils) profiles is crucial in determining the components responsible for their chemical and biological activity. The constituents of essential oil of these spices include oxygenated monoterpenes, monoterpene hydrocarbons, oxygenated sesquiterpenes, sesquiterpene, hydrocarbons, and others. These entire compounds have been identified by gas chromatography-mass spectrometry (GC-MS). Gas chromatography (GC) coupled with mass spectrometry is the most common technique for the identification of these volatile plant oils. The chromatographic retention profile for molecules can be measured using different parameters which include: retention time, linear-temperature programmed retention index, Lee retention index, boiling point correlation, equivalent chain length, Kovats retention distance, and the most popular one the Kovats retention index (KRI) [5,6]. The KRI represents a relative retention parameter normalized concerning n-alkane series as a standard.
Most of the Origanum species are locally distributed within the Mediterranean region where they grow in mountainous areas on an island, and because of that, the rate of endemism is high (about 70 %). However, O. vulgare is characterized by the largest distribution and can be found throughout the Mediterranean region, in most parts of the Euro-Siberian and the Iran-Turanian regions [5]. Apart from that, O. vulgare is the most variable species of the genus. Furthermore, O. heracleoticum is endemic to the Mediterranean area [6].
The Mediterranean region can be described as the center of the genus Thymus, however, the species are widespread worldwide in temperate areas. Due to the diversity and plasticity of these plants and their geographical range, they differ concerning their morphological features and metabolism, which influences their chemical constitution. Within individual species, particularly T. vulgaris and T. serpyllum, there are chemical variations that are characterized by different plant oil compositions, usually without any morphological differences [7].
Quantitative structure-chromatographic retention relationship (QSRR) describes the chemical structure as per their physicochemical or biological properties. The chemical structure is modelled by molecular descriptors, and a goal to obtain a statistically significant relationship is obtained by investigating a large set of the property parameters. GC-MS data are widely used in QSRR models, due to the ease to obtain a large number of quantitatively comparable, reproducible and precise retention data for large sets of the analytes. Lately, numerous publications are related to the QSRR analysis [5-12]. QSRR models are based on the experimental value of the retention index and provide a promising faster way for predicting the retention index of EOs using the descriptors derived solely from the molecular structure- QSRRs and retention prediction in general have numerous applications. From identification of the most informative structural molecular descriptors with respect to retention mechanisms, prediction of retention for new EOs whose experimental data are undetermined, up to comparison of different chromatographic columns and determination of physical properties (lipophilicity, dissociation constants, relative bioactivities).
In this study, we used the artificial neural network (ANN) was known for its excellent predictability in our previous investigations and through the published literature [13,14].
This work aimed to establish a validation model for prediction of Kovats retention indices of essential oils compounds from O. heracleoticum, O. vulgare, T. vulgaris and T. serpyllum trough QSRR models, genetic algorithm (GA) and the ANN technique.
Experimental
Plant material
Two Origanum species: O. heracleoticum and O. vulgare, as well as two Thymus species: T. vulgaris and T. serpyllum were used in this study. Voucher specimens (IC1312, IC1212, IC1112, and IC1012) were confirmed and deposited at the Institute of Medicinal Plant Research “Dr Josif Pančić” from Belgrade, Serbia.
Essential oil extraction
Prior to extraction, plant material was air dried, packed in paper bags and kept in a dark and cool place. EO’s were extracted from dried and grinded plant materials (100 g) by hydro-distillation using Clevenger type apparatus for 4 h. The extracted EO’s were separated and dried over anhydrous sodium sulfate, stored in sealed dark vials and kept under refrigeration at 4 °C. The yield of each EO was expressed as a volume percent (% v/w), calculated relative to 100 g of dried plant material. Identification of essential oil components (EOC’s) was done by gas chromatography (GC-FID) and mass spectrometry (GC-MS) analysis.
Essential oil analysis
Gas chromatography analysis of the essential oils were carried out on an HP-5890 Series II GC apparatus [Hewlett-Packard, Waldbronn (Germany)], equipped with the split-splitless injector and automatic liquid sampler (ALS), attached to HP-5 column (25 m × 0.32 mm i.d. and 0.52 μm film thickness) and fitted with a flame ionization detector (FID). Carrier gas was H2 (1 ml/min), with a split ratio of 1:30, injector temperature was 250 °C, detector temperature 300 °C, while column temperature was linearly programmed from 40 to 260 °C with a rate of change of the 4 °C/min, and then kept isothermally at 260 °C for 10 min. Solutions of essential oil in ethanol (10 mg/ml) were consecutively injected in an amount of 1μl. Area percent reports, obtained as result of standard processing of chromatograms, were used as a base for the quantification analysis.
The same analytical conditions as those mentioned for GC-FID were employed for GC-MS analysis, along with column HP-5MS (30 m × 0.25 mm i.d. and 0.25 μm film thickness), using HP G 1800C Series II GCD system [HewlettPackard, Palo Alto, CA (USA)]. Helium was used as carrier gas (1.8 ml/min). The transfer line was heated at 260 °C. The mass spectra were obtained in EI mode, with an ionization voltage of 70 electron volt (eV); in the range from 40 to 450 m/z. The amount of the injected sample, dissolved in ethanol (10 mg/ml) was 0.2 μl. The components of the essential oil were identified by comparison of their mass spectra to those from Wiley 275 and NIST/NBS (NIST-National Institute of Standards and Technology / NBS-National Bureau of Standards) libraries, using different search engines. Identification of the compounds was achieved by comparing their Kovats retention indices and mass spectra with those reported in the literature [15] and supplemented by the Automated Mass Spectral Deconvolution and Identification System software (AMDIS ver. 2.1), GC-MS library [16]. The experimental values for Kovats retention indices were determined using calibrated Automated Mass Spectral Deconvolution and Identification System Software (AMDIS ver. 2.1), GCMS library [16], and also compared to those from available literature [15] and used as additional tool to approve MS findings. The proportion of the essential oil constituents were expressed as percentages obtained by peak area normalization, all the relative response factors were entered as one.
QSRR analysis
The molecular structures data set was presented using .smi files, obtained from the PubChem database. The calculation of specified molecular descriptors of each compound in the datasets was done by PaDel-descriptor software [17]. This program gives a huge amount of data for each observed compound, and it is necessary to select the most relevant molecular descriptors for Kovats retention indices prediction by using a genetic algorithm (GA) and factor analysis [18]. GA is a stochastic optimization method inspired by evolution theory [19,20]. Each gene of the population, defined by a "chromosome", represented a subset of the descriptors. The number of elements on each “chromosome” (i. e., observed chemical compounds) was equal to the number of the molecular descriptors obtained in the PaDel-descriptor. The population of the first GA generation was selected randomly. Each gene gained a value of 1 if its corresponding descriptor was included in the subset; otherwise, it gained zero value. In this work, it was used to select the most appropriate molecular descriptors for developing the reliable Kovats retention indices predictive models for compounds in O. heracleoticum, O. vulgare, T. vulgaris, and T. serpyllum essential oil, obtained by GC-MS analysis. The correlation between the descriptors was examined and collinear descriptors were detected using correlation analysis. Statistical investigation of the data has been performed mainly by the Statistica 10 software [21].
Artificial neural network (ANN)
The four multi-layer perceptron (MLP) architecture were used to build ANN models for the prediction of Kovats retention indices for GC-MS data, which is a well-known and proven mathematical tool, quite capable of approximating nonlinear functions [22]. Broyden-Fletcher-Goldfarb-Shanno (BFGS) algorithm was used for ANN modelling. All data points were randomly used to train and develop the ANN; 70 % of data points for training, 15 % of the data for validations, and 15 % of data for testing the process [23,24]. The optimization process was performed based on validation error minimization. ANN calculations were performed with Statistica10 [21].
Global sensitivity analysis
Yoon’s interpretation method was used to determine the relative influence of molecular descriptors on Kovats retention indices [25]. This method was applied based on the weight coefficients of the developed ANN.
Results and discussion
According to our previous study [29] in the O. heracleoticum, O. vulgare, T. vulgaris and T. serpyllum essential oils 68 compounds were detected, which represented 97.26-98.32 % of total oil composition, GC-MS and GC-FID chromatograms are given in supplementary material.
The dominant class in all samples was oxygenated monoterpenes (from 48.37 to 73.65 % depending on the sample). On average, the most dominant was carvacrol with 34.74 % on average (ranged between 5.56 and 16.57 % in T. serpyllum and T. vulgaris, respectively, and 58.84 and 69.98 % in O. vulgare and O. heracleoticum, respectively), followed by their isomer thymol with 21.02 % on average (ranged from 1.62-4.76 % in Origanum, and 34.48 and 43.23 % in Thymus). These results are in correspondence with numerous previous research [2,26,27,28]. Furthermore, p-cymene was present in high amount, with 20.29 % on average (ranged between 7.7 and 34.84 %), while γ-terpinene was present with significantly lower content, 4.67 % on average,[29].
It is interesting to note that molecular orbitals of p-cymene, carvacrol and thymol, are located on the benzene rings, in the case of thymol and carvacrol molecules the highest occupied molecular orbital (HOMO) also includes oxygen atoms. Furthermore, the difference in activities between thymol and carvacrol resides in the hydroxyl group position relative to the larger aliphatic chain. Thymol has the hydroxyl group in meta position while carvacrol contains the hydroxyl group in the ortho position [31]. Indeed, a pair of molecules with a high disparity index indicates that the molecular structures are likely similar, however, the activities differ significantly [32]. These compounds (molecular descriptors) may be useful for target identification of essential oils or their major components in antimicrobial/drug development [31].
QSRR models
The PaDel-descriptor software was used in this investigation, for calculation and the identification of the structural descriptors which represents the chemical structures in O. heracleoticum, O. vulgare, T. vulgaris and T. serpyllum, which were identified by GC-MS, as mentioned in the previous section. Prior the GA calculation, the factor analysis was performed to eliminate the descriptors with equal or almost equal correlations, and only one of the inter-correlated descriptors remained in the GA calculation. As a result of this preliminary consideration, only cca., 400 descriptors remained for GA calculation. GA was used to select the most appropriate molecular descriptors for Kovats retention indices prediction, and the selection of the most relevant descriptors was realized using the evolution simulation [33,34]. The number of the elements was kept relatively low to maintain a small subset of descriptors [35]. As a result, the probability of generating zero for a gene was set at least 60% greater than the probability of generating the value of 1. The used operators were crossover and mutation. The probability of application of these operators was varied linearly with generation renewal (0.5 % for mutation and 90 % for a crossover). A population size of 100 individuals was chosen for GA, and evolution was allowed over 50 generations. The evolution of the generations was stopped when 90 % of the generations took the same fitness. As a result, the eight most significant molecular descriptors selected by GA were:
o Barysz matrix descriptors
 VE2 DzZ - Average coefficient sum of the last eigenvector from Barysz matrix / weighted by atomic number,
 - VR1 Dzi - Randic-like eigenvector-based index from Barysz matrix / weighted by first ionization potential),
o 2D Autocorrelation descriptors
- AATSC6v - Average centered Broto-Moreau autocorrelation - lag 6 / weighted by van der Waals volumes,
- AATSC3c - Average centered Broto-Moreau autocorrelation - lag 3 / weighted by charges,
- AATSC1e - Average centered Broto-Moreau autocorrelation - lag 1 / weighted by Sanderson electronegativities,
- MATS7s - Moran autocorrelation - lag 7 / weighted by I-state,
- AATSC5s - Average centered Broto-Moreau autocorrelation - lag 5 / weighted by I-state,
- ATSC5i - Average centered Broto-Moreau autocorrelation - lag 5 / weighted by first ionization potential),
The molecular descriptors were presented in Supplementary Table 1.
Table 1 The correlation coefficient matrix for the selected descriptors by GA.
| AATSC3c | AATSC6v | AATSC1e | AATSC5s | MATS7s | VE2 DzZ | VR1 Dzi | |
|---|---|---|---|---|---|---|---|
| ATSC5i | 0.100 | 0.066 | -0.059 | 0.128 | 0.105 | -0.064 | 0.025 |
| p=0.416 | p=0.595 | p=0.636 | p=0.300 | p=0.392 | p=0.605 | p=0.837 | |
| AATSC3c | -0.116 | 0.037 | -0.073 | 0.195 | 0.060 | 0.074 | |
| p=0.346 | p=0.763 | p=0.553 | p=0.115 | p=0.630 | p=0.546 | ||
| AATSC6v | -0.160 | -0.180 | -0.133 | -0.152 | 0.141 | ||
| p=0.191 | p=0.142 | p=0.278 | p=0.138 | p=0.253 | |||
| AATSC1e | 0.080 | -0.020 | -0.150 | 0.037 | |||
| p=0.519 | p=0.872 | p=0.223 | p=0.767 | ||||
| AATSC5s | -0.007 | -0.053 | 0.010 | ||||
| p=0.954 | p=0.669 | p=0.939 | |||||
| MATS7s | -0.199 | 0.162 | |||||
| p=0.104 | p=0.131 | ||||||
| VE2 DzZ | -0.138 | ||||||
| p=0.150 |
Essential oils are a complex mixture of volatile, low molecular weight organic compounds. Correlations between the GC retention indices of these compounds and their molecular structures can provide very important information about the effects and the possible mechanisms of absorption and elution [36]. However, molecular size is an important descriptor as most physicochemical properties and many biological properties are strongly size-related. The empirical success of the van der Waals radius concept gives a good starting point for a computational approach, even if in an exact quantum chemical description, the electron cloud has no well-defined boundary surface [37]. According to this, it can be said that molecular descriptors covering different information of molecular structures. Furthermore, the modeling and prediction of the physicochemical properties of organic compounds is an important objective in many scientific fields [38].
Separation of compounds in GC-MS and their Kovats retention indices is linked to affinity towards mobile and stationary phase. The affinity and solubility of separated molecules directly depend on their chemical structure and physicochemical properties, which could be expressed by molecular descriptors.
Eight molecular descriptors were utilized for predictions of Kovats retention indices in the four ANN models, and their values were presented in Supplementary Table 1.
The Barysz matrix descriptors were derived from weighted molecular graphs. The applied weighting schemes are based on atomic mass, atomic van der Waals volume, Sanderson electronegativity, and atomic polarizability. The weighting scheme based on the atomic weight Z can be applied to derive the Barisz matrix, [35]. The 2D-autocorrelation descriptors in general explain how the values of certain functions, at intervals equal to the lag, are correlated. In the case of the descriptors used to develop the model, lag is the topological distance d and the atomic properties are the functions correlated. There are slight differences between the 2D-autocorrelation descriptors ATSd, MATd, GATSd; in general, they describe how the considered property is distributed along with the topological structure. The most important factor in interpreting them in the model is the topological distance once weighted equally [35].
According to Pearson’s correlation coefficients, there was a rather poor correlation between all autocorrelation descriptors (Table 1). Hence, utilized molecular descriptors were appropriate to predict Kovats retention indices of compounds in O. heracleoticum, O. vulgare, T. vulgaris, and T. serpyllum by four multivariate ANN models [39]. Detailed explanations about the descriptors were found in the Handbook of Molecular Descriptors [35]. These descriptors encode different aspects of the molecular structure and were applied to develop the QSRR models.
The calibration and predictive capability of a QSRR model should be tested through model validation. The most widely used squared correlation coefficient (r 2) can provide a reliable indication of the fit of the model, thus, it was employed to validate the calibration capability of a QSRR model.
Artificial neural network (ANN)
To explore the nonlinear relationship between Kovats retention indices and the descriptors selected by GA, ANN technique was used to build four predictive models. The following neural networks: MLP 8-7-1, MLP 8-7-1, MLP 8-10-1, and MLP 8-4-1 were constructed to predict the retention time of compounds isolated from Origanum heracleoticum, Origanum vulgare, Thymus vulgaris, and Thymus serpyllum essential oils, respectively. The ability to generalize the model was evaluated by the validation test set. The coefficients of determination during the training cycle were 0.830; 0.852; 0.922 and 0.815, respectively, indicating that these models could be used for the prediction of Kovats retention indices, due to low prediction error and high r 2. The statistical results of these four networks are shown in Table 2.
Table 2 ANN model summary (performance and errors), for training, testing and validation cycles, for prediction of Kovats retention indices of compounds isolated from O. heracleoticum, O. vulgare, T. vulgaris and T. serpyllum essential oils.
| Net. name | Performance | Error | Train. algorithm | Error function | Hidden activation | Output activation | ||||
|---|---|---|---|---|---|---|---|---|---|---|
| Train. | Test. | Valid. | Train. | Test. | Valid. | |||||
| MLP 8-7-1 | 0.830 | 0.906 | 0.933 | 6.8E+03 | 4.7E+03 | 6.2E+03 | BFGS 8 | SOS | Logistic | Logistic |
| MLP 8-7-1 | 0.852 | 1.000 | 1.000 | 5.2E+03 | 2.8E+03 | 2.7E+04 | BFGS 10 | SOS | Logistic | Tanh |
| MLP 8-10-1 | 0.922 | 0.859 | 0.985 | 4.0E+03 | 2.9E+03 | 1.4E+03 | BFGS 33 | SOS | Logistic | Logistic |
| MLP 8-4-1 | 0.815 | 0.849 | 0.913 | 7.2E+03 | 1.0E+04 | 5.7E+03 | BFGS 23 | SOS | Tanh | Tanh |
*Performance terms represent the coefficients of determination, while error terms indicate a lack of data for the ANN model.
The quality of the four models fit was tested in Table 3, with the lower χ2, MBE, RMSE, and MPE values showing the better fit to the experimental results [40].
Table 3 The "goodness of fit" tests for the developed ANN model.
| Network | χ 2 | RMSE | MBE | MPE |
|---|---|---|---|---|
| MLP 8-7-1 | 12793.488 | 111.872 | -9.440 | 7.380 |
| MLP 8-7-1 | 12462.578 | 110.330 | 4.151 | 7.555 |
| MLP 8-10-1 | 7431.659 | 85.434 | 10.014 | 5.281 |
| MLP 8-4-1 | 15030.285 | 121.537 | -16.855 | 8.066 |
χ 2 - reduced chi-square, MBE - mean bias error, RMSE - root mean square error, MPE - mean percentage error.
The ANN model had an insignificant lack of fit tests, which means the model satisfactorily predicted the Kovats retention indices of certain compounds in O. heracleoticum, O. vulgare, T. vulgaris and T. serpyllum essential oil obtained by GC-MS chromatography utilizing the genetic algorithm (GA) variable selection method.
The QSRR model was build according to ANN model of the GC-MS data, i. e., the Kovats index data in the range of 917.3-1674.2 for O. vulgare and T. vulgaris. The developed ANN model delivers the most precise results within the range in which it was build. Therefore, this model would accurately predict the new compounds (like: monoterpene hydrocarbons, oxygenated monoterpenes, sesquiterpene hydrocarbons, oxygenated sesquiterpenes and hydrocarbones), especially in the specified Kovats index range.
The predicted Kovats retention indices are presented in Supplementary Table 1, confirm the good quality of the constructed ANN, by showing the relationship between the predicted and experimental Kovats retention indices values. Graphical comparison between experimentally obtained Kovats retention indices of O. heracleoticum, O. vulgare, T. vulgaris and T. serpyllum essential oils composition (KRI a) and the retention time indices predicted by the four ANN models (KRI c . ) were presented in Fig. 1.
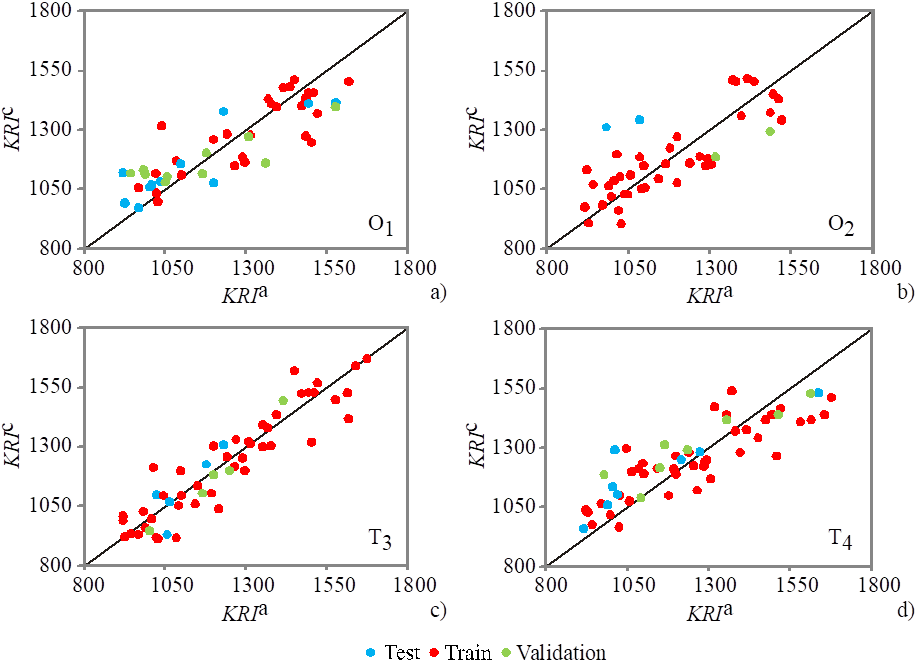
Fig. 1 Retention time indices of the (a) Origanum heracleoticum, (b) Origanum vulgare, (c) Thymus vulgaris and (d) Thymus serpyllum essential oils composition, from: experimentally obtained GC-MS data (KRI a) and predicted by the ANN (KRI c .).
Obtained results reveal the reliability of the ANN models for predicting the Kovats retention indices of compounds in O. heracleoticum, O. vulgare, T. vulgaris, and T. serpyllum essential oils obtained by GC-MS analysis.
Global sensitivity analysis- Yoon’s interpretation method
The influence of the eight most important input variables identified using a genetic algorithm on the Kovats retention indices was studied in this section. According to Fig. 2, AATSC6v was the most important molecular descriptor for chemical compounds in Origanum heracleoticum and Origanum vulgare, with a relative importance of 21.68 and 21.90 %, while the most important molecular descriptor for chemical compounds in Thymus vulgaris was MATS7s (relative importance of 22.44 %). Several molecular descriptors were of almost equal importance in the QSRR model for Thymus serpyllum: VE2 DzZ, AATSC6v, MATS7s, and VR1 Dzi, with a relative importance of 14.49; 14.37; 14.28, and 14.27 %.

Conclusion
Validation model for prediction of Kovats retention indices of essential oils compounds from O. heracleoticum, O. vulgare, T. vulgaris and T. serpyllum trough QSRR models, show eight molecular descriptors were suggested by a GA which were utilized as inputs for the ANN models. The results demonstrated that the ANN models were adequate in predicting the Kovats retention indices of the compounds in selected plant species. The coefficients of determination for the training cycle were close to 1, which is a good indication that these models could be used as a fast-mathematical tool for prediction of Kovats retention indices, due to low prediction error and moderately high r2. Suitable models with high statistical quality and low prediction errors were derived, and it could be further used for estimation of Kovats retention indices of newly detected compounds.

