1. Introduction
Inhibitors of histone deacetylase (HDACs) are an important and relatively new class of potential drugs for the treatment of hyper proliferative diseases, as is the case of cancer (1, 2, 3). This class of molecules bind directly to the HDAC active site and block substrate access, causing an accumulation of acetylated-histone. Suberoylanilide hydroxamic acid, (SAHA), commercially known as Vorinostat (©), is a drug used for the treatment of advanced cutaneous T-cell lymphoma 4. SAHA inhibits histone deacetylases classes I, II and IV involved in the deacetylation of core histones. In addition, histone acetylation interferes with the effects of positive charge of lysine residues and inhibits binding with the negatively charged DNA, thereby promoting chromatin relaxation and transcriptional activation 5. Other new proposed mechanisms to rationalize the activity of these drugs are DNA damage and delay in DNA-repair associated with cancer cells apoptosis (6, 7). SAHA at doses that inhibited growth of human prostate cancer xenografts caused no detectable toxicity in mice 8, so there is interest to develop SAHA analogues as new and improved anticancer agents 9. Analysis of the SAHA structure is used to define the pharmacophore model, comprising three elements: a) a Zn(II) coordinating (metal binding) group (MBG); b) a linker region (LM), and c) a terminal aromatic (capping) group (CG) (10, 11, 12), (Fig. 1).
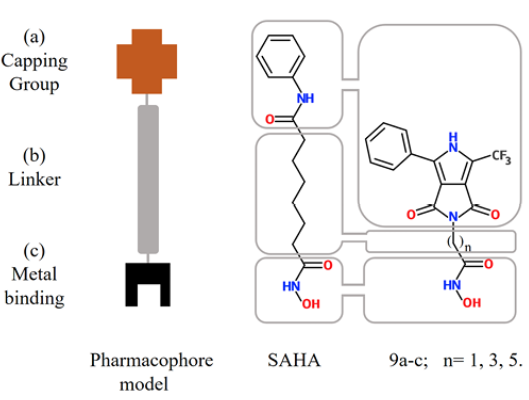
Fig. 1 Sections of the pharmacophore model in SAHA (center) and synthesized molecules in this work (right) 9a-c
Besides, our aim was to introduce a heterocyclic aromatic molecule rich in π-electron density and a trifluoromethyl group. For the former, we use the ubiquitous pyrrole system, because it can be found in drugs, such as atorvastatin, isamoltane, elopiprazole 13, 14, and molecules with biological relevance, as chlorophyll and the heme group 15, 16. On the other hand, the presence of the trifluoromethyl group, a bulky and highly electron-withdrawing group, which increases their chemical stability, due to the strong bonds it tends to form between C-F, can induce increased resistance to metabolic decomposition. Additionally, fluorine participates in hydrogen-bonding interactions with H-C only as acceptor but with a much lower energy that an O-H hydrogen bond 17. In this regard, molecules of pyrrole 18 and -CF319 moieties functionalized with hydroxamic acid have been reported (Fig. 2), which exhibits interesting selectivity as inhibitors of class IIa HDACs and HDAC1 respectively. However, to the best of our knowledge there is not yet anything reported about structures where these groups are present.
Computational techniques are applied in order to justify the HDAC inhibitors activity, using extensive databases 20 and experimental crystallographic structures to corroborate the action mechanism. If such information is not available, molecular docking results a good alternative to propose a binding mode. Molecular docking is a computational methodology that is useful to understand the molecular mechanisms of substances with biological activity. In addition, docking, evaluates the most probable ways in which a macromolecule may interact with a small molecule (ligand). In the process of evaluation, many poses are tested using a set of successive stochastic and evolutive algorithms. The score of each pose is given by the quantification of the energy of intermolecular interactions 21. Docking is useful as a tool to predict the binding mode of a ligand to a structurally-known protein, even when the ligand is not co-crystalized within the protein 22
Our main goal is to propose new molecules that are good candidates for drugs, which show improved pharmacological activity than the reference drug SAHA. To reach our goal, we analyze the improvement of activity by modifying the LM and CG moieties of the pharmacophore model (Fig. 1), i.e. we modified both the linker length and the capping group (Fig. 1). In this direction, novel analogues of SAHA were synthesized with a convenient protocol beginning with the availability of the starting materials 3 and 6a-c (Scheme 1), which can be both prepared from simple synthetic methodologies. The newly synthesized analogues are: 2-(1,3-dioxo)-4-phenyl-6-(trifluoromethyl)-3,5-dihydropyrrolo[3,4-c]pyrrol-2(1H)-yl-N-hydroxy acetamide (9a); 4-(1,3-dioxo)-4-phenyl-6-(trifluoromethyl)-3,5-dihydropyrrolo[3,4-c]pyrrol-2(1H)-yl-N-hydroxy butanamide (9b); and 6-(1,3-dioxo)-4-phenyl-6-(trifluoromethyl)-3,5-dihydropyrrolo[3,4-c]pyrrol-2(1H)-yl-N-hydroxy hexanamide (9c) (Scheme 1). To appraise the new molecules, we proceeded two-fold: a) theoretical-computational characterization using molecular docking and quantum chemical descriptors calculations and b) biological assays. Regarding the analogues of SAHA, 9a-c and their interactions with the biological target, we employed a docking methodology to assess the binding modes and the energetics involved in such couplings. Such docking analysis were performed with SAHA and the new pyrrolo[3,4-c]pyrrole hydroxamic acids using 5 different HDACs isoforms: HDAC2, HDAC4, HDAC6, HDAC7 and HDAC8. Furthermore, conceptual density functional theory (DFT) [23-27] reactivity descriptors were computed at a high level of theory, to improve rationalization of the docking results. Regarding the biological assays, the cytotoxic activity was evaluated for all compounds; the new analogue 9c is found to have increased antiproliferative effects than SAHA in MDA-MB-231 line cells as expected from the docking calculations. The potential mechanism of action of this analogue was studied in parallel with SAHA. We employed the MCF7 cell line, an estrogenic receptor positive control cell line, and the MDA-MB-231 line, a triple negative breast cell line with mesenchymal, invasive and luminal morphology. Accumulation of acetylated histone H3 was measured as evidence of inhibition of histone deacetylases by SAHA and three analogues. Different types of DNA damage by comet assay at the level of individual cells were analyzed.
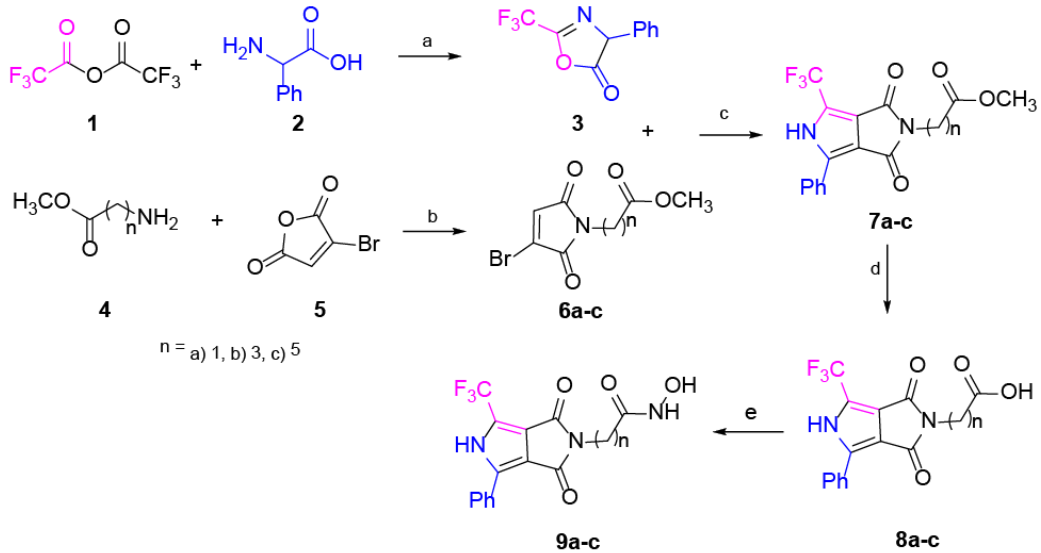
Scheme 1 Synthesis of compounds 9a-c. Reagents and conditions: (a) rt, 2.5 h, 95%. (b) AcOH, M.W., 115 °C, 3 h, 53-65%. (c) DBU, toluene, rt, 3 h, 51-63%. (d) HCl, dioxane, MW., 95 °C, 5 h, 71-92%. (e) NH2OH·HCl, CDI, THF, rt, 12 h, 58-75%
2.1 Methodology
2.1 Chemistry
Progress of reactions was monitored with analytical TLC (aluminum sheets, silica gel 60F/UV254) in 9:1 Hex/AcOEt system. Visualization was carried out with UV light and Iodine. All products were purified by column chromatography using silica gel (MN Kieselgel 60, 230-400 mesh) and mixtures of ethyl acetate and hexane as eluents. For reactions promoted by microwaves (MW), were performed on the equipment Discover® SP equipment using the reflux system. Melting points were determined on a digital Electrothermal 90100 melting point apparatus. 1H and 13C NMR spectra were recorded with a Bruker Ultrashield [500 MHz] spectrometer in CDCl3 or DMSO. High-resolution mass spectra (HRMS) were determined with electrospray ionization on a Bruker micrOTOF-Q II mass spectrometer.
Procedure for the synthesis of 4-phenyl-2-(trifluoromethyl) oxazol-5(2H)-one (3): A mixture of 2-phenylglicine (13.91 mmol) and trifluoracetic anhydride (20.88 mmol) were stirred at room temperature during 2.5h. Crude was neutralized with saturated solution of NaHCO3 (10 mL). Organic phase was washed with toluene (10 mL), then, it was dried using vacuum and product precipitates crystals. 20
General procedure for the synthesis of maleimides 6a-c: A mixture of bromomaleic anhydride 5 (3.49 mmol) and the corresponding amine hydrochloride 4a-c (5.23 mmol) were dissolved in AcOH (5 mL). The mixture was refluxed using MW for 3h. Solvent was removed adding 5 mL of toluene to the mixture and using vacuum, and repeating these 3 times. The crude was purified by column chromatography, dried under vacuum, quantified and characterized.
General procedure for the synthesis of pyrroles 7a-c: A mixture of the corresponding maleimide 6a-c (1.64 mmol) and 4-phenyl-2-(trifluoromethyl) oxazol-5(2H)-one (3.28 mmol) was dissolved in toluene. The mixture was stirred at room temperature and DBU (6.56 mmol) were added drop by drop, and was stirred for 3h. After this time, HCl 8M (0.1 mL) was added, the extraction of the organic phase and purification by column chromatography were carried out
General procedure for the synthesis of carboxylic acids 8a-c: A mixture of the corresponding pyrrole 7a-c (0.25 mmol) and HCl 1M (2.53 mmol) were dissolved in dioxane (5 mL) and this was refluxed using MW for 5 h. Crude was recrystallized to produce the carboxylic acid.
General procedure for the synthesis of pyrrolo[3,4-c]pyrrole hydroxamic acid derivatives 9a-c: These reactions were carried out under nitrogen and THF dry. A mixture of the corresponding carboxylic acid 8a-c (0.48 mmol) and carbonyl diimidazole (0.53 mmol) were dissolved in THF (7.5 mL). The reaction was stirred at room temperature for 1h. After, the hydroxylamine hydrochloride (0.72 mmol) was added and stirred for 12h at room temperature. For compounds 9a-c the purification was performed by recrystallization process.
2.2 Computational Studies
2.2.1 Molecular Docking.
The ligands 9a, 9b, 9c and SAHA (structures in Fig. 1) were initially modeled using the semiempirical AM1 method available in the Spartan´08 package 29. Molecular docking analysis was performed using the Molegro Virtual Docker software (MVD) 30. The aim was to calculate and compare the interaction of SAHA and the other three new pyrrolo[3,4-c]pyrrole hydroxamic acids in the binding site of the HDACs. The ligand structures were employed in their deprotonated forms only in the molecular docking studies. X-ray crystallographic structures were obtained from the Research Collaboratory for Structural Bioinformatics, (RSCB) protein data bank (PDB): HDAC2 (PDB: 4LXZ) 31 and HDAC8 (PDB: 1T69) 32 were found co-crystallized with SAHA, while HDAC4 (PDB: 2VQM) 33 and HDAC7 (PDB: 3C10) 34 were found complexed to different SAHA derivatives of the hydroxamic acid, and HDAC6 (PDB: 3PHD) 35 without ligands. Other human HDACs isoform-structures are still not available.
The HDACs isoforms were prepared for the molecular docking studies at pH=7, all the water molecules were removed. During all docking minimization processes, the protein structures were kept fixed, only allowing all the torsional bonds of ligands to relax during the interaction. After blind docking, where all cavities of the protein were taken as potential binding sites, we observed how the most promising poses occur in the active site. Although the binding cavity for HDACs (and exit channel for product release) is well-known, we performed this “blind” docking procedure to make sure that our docking methodology correctly reproduced the known binding cavity. We explored the effect of keeping the SAHA MBG and changing the LM longitude by varying the number of carbon atoms, these were n=1, 3 and 5. In addition, we evaluated a new capping group pyrrole pyrrolidinone with trifluoromethyl and benzene substitution at positions 4 and 6 on pyrrole, respectively.
2.2.2 DFT electronic properties
Thereafter, electronic structure properties for the 9a, 9b, 9c and SAHA free ligands (Fig. 1) were calculated reoptimizing their geometries at the DFT level of theory, using the PBE functional and the basis set 6-311++G(d,p), with the Gaussian09 software 36. True minima were obtained for all stationary points as confirmed by the harmonic analysis. Chemical descriptors were computed as χ=½ (I +A), η=I-A and ω = χ2/2η, where I and A are computed as the vertical ionization potential and electron affinity respectively of the species in question. They were obtained as the difference between the total energy of the cationic species (unrelaxed) and the optimized neutral molecule while A as the difference between the total energy of the optimized neutral molecule and its (unrelaxed) anion 37. χ is the electronegativity, η the absolute hardness and ω the electrophilicity.
3. Results and Discussion
3.1 Chemistry
The synthesis of the pyrrole cap derivatives 9a-c (Scheme 1) was accomplished by use of three related building blocks, namely the pyrrolo[3,4-c]pyrrole hydroxamic acid derivatives 7a-c which were synthesized according to the already reported procedure 38. The pyrrolo[3,4-c]pyrrole core was prepared by typical cycloaddition reaction between 3 and 6a-c in good yield. Saponification of the methyl ester followed by a standard peptide coupling reaction between the resulting acid and the hydroxylamine using CDI (carbonyldiimidazole) provided the corresponding hydroxamic acid 9a-c. The aim of the design is to analyze the effect of the -CF3 group 39, which is described as having a significant effect on biological activity. On the other hand, the core pyrrole is one of the most important heterocyclic compounds used as building blocks in the scaffold of numerous synthetic pharmaceutical agents and natural products. Details on the synthesis, isolation and characterization of compounds 9a-c can be found in the Experimental Section.
3.2 Computational
In order to characterize the HDACs binding mode of our three new pyrrolo[3,4-c]pyrrole hydroxamic acids, we found the optimal conditions for a refined docking process with a 0.2 Å grid resolution and a sphere with a radius of 12 Å, centered on the active site. During the process of evaluation, many poses were tested alternating the MolDock scoring function and the Simplex Evolution search genetic algorithm with a maximum number of 1500 iterations and a 50 poses population size. Binding energies obtained from the MolDock scoring function, are calculated using equation (1), for interactions between ligands and proteins,
The summation runs over all atoms, except hydrogens, in both the ligand and the protein. The EPLP term is the piecewise linear potential described on reference 30. The second term is a Coulombic potential to describe the electrostatic interactions between charged atoms. The root-mean-square deviation (RMSD) obtained for SAHA in HDAC8 was 1.05 Å (Fig. 3). The same conditions were employed for docking calculations of all the ligands.
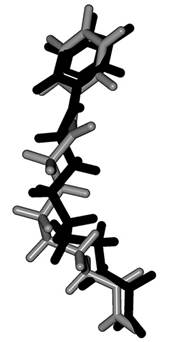
Fig. 3 The dark-colored ligand is the co-crystallized native ligand, and the other one is the highest ranked pose. The RMSD=1.05 Å
For detailed visualization of the probable binding mode of compound 9c, isoform HDAC8 was selected as a representative system model. Regarding the docking with such isoform, it was found that compound 9c binding is stronger than SAHA in the active site, it shows more hydrogen bond interactions. For instance, SAHA establishes a hydrogen donor bond with a nitrogen atom on the His 142 residue with a distance of 2.92 Å and an angle 97.55°, while compound 9c formed two donor hydrogen bonds. The fist one of such hydrogen bonds occurs between a nitrogen atom on residue His 142 with distance of 2.81 Å and angle 94.45°, the second one between a nitrogen atom on His 143 residue with a distance of 2.12 Å and an angle of 126.22°. The fact that 9c holds two hydrogen bond interactions instead of one, compared with SAHA, evinces that 9c achieves a stronger interaction with HDAC8. In addition, both SAHA and 9c, formed an acceptor hydrogen bond with hydroxyl group of residue Tyr 306, the values of distance and angle for SAHA are 1.60 Å and 107.05°, respectively. Regarding 9c, the hydrogen bond interaction with Tyr 306 exhibits values of distance and angle of 1.78 Å and 106.41°, respectively. Therefore, for the case of the Tyr 306 hydrogen bond interactions with both ligands are similar. Moreover, an additional acceptor hydrogen bond was found between a nitrogen atom of residue Lys 33 and the oxygen atom of 9c pyrrolidin-1,3-dione, the displayed distance was 2.64 Å and an angle of 149.53° (Fig. 4). Also, we found a candidate to a T-stacking interaction between 9c and the Phe 207 benzenes, such benzene moieties are separated from each other by 5.03 Å measured from the ring centers (Fig. 5).
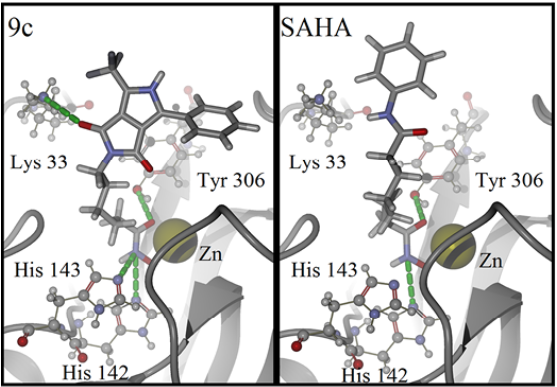
Fig. 4 Binding mode of compound 9c (left) and SAHA (right) in HDAC8 active site. Hydrogen bonds are represented by green dotted lines. Ligands are represented as stick models, amino acids and the zinc cofactor are represented with a sphere model, all colored by atom type. Oxygen atoms are colored in red, nitrogen atoms in blue, carbon atoms on dark gray, hydrogen atoms on gray and the zinc atom in yellow. The backbone is shown as a ribbon
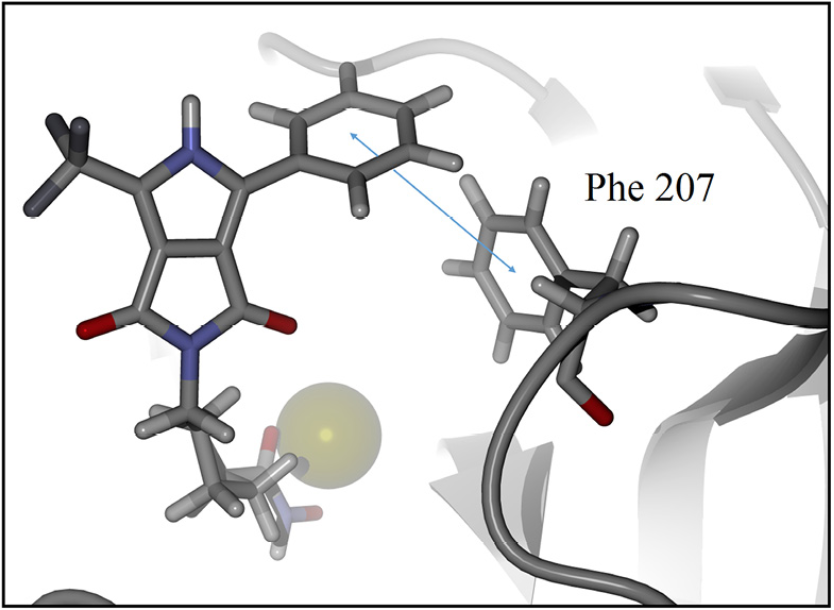
Fig. 5 Candidate to T-stacking interaction between 9c and phenylalanine residue in the HDAC8 active site. Ligand 9c and key residue are represented as a stick model, colored by atom type, zinc represented as sphere model and the backbone is shown as a ribbon. The blue arrow represents the measured distance, 5.03 Å
The binding energies of all molecules with each of HDAC isoforms were calculated and reported on Table 1. To analyze the cooperative or cumulative effect that is due to the presence and action of the five isoforms, we report an average binding energy in the last column.
Table 1 Calculated binding energies (kcal mol-1) for all compound-HDAC isoform complexes.
| Compound/Isoform | HDAC2 | HDAC4 | HDAC6 | HDAC7 | HDAC8 | Average |
| 9a | -93.31 | -98.77 | -85.62 | -93.58 | -68.94 | -88.04 |
| 9b | -77.46 | -89.52 | -103.45 | -111.42 | -95.65 | -95.50 |
| 9c | -135.93 | -70.80 | -100.63 | -123.75 | -93.12 | -104.85 |
| SAHA | -131.97 | -85.62 | -83.16 | -103.87 | -78.67 | -96.66 |
As it can be seen in Table 1, the highest average binding energy suggests that compound 9c is the most active molecule, with capacity to block the active sites of a variety of HDAC isoforms, followed by SAHA. n order to corroborate such results, biological tests were performed resulting in agreement with the theoretical predictions, where the most active molecule was found to be compound 9c. Besides, our results show that the binding modes of SAHA and 9c are very similar. Such binding modes for both molecules involve the hydroxamic group that appears very close to the zinc cofactor (Fig. 6). Several experimental and theoretical studies 10,40 bring to light that this is the strongest interaction, our results support that this mode of interaction is fundamental to the biological activity and should be preserved to improve the binding energy, and hopefully the anticancer activity. It is known, that SAHA and the new 9c inhibitor are not specific (selective) to any of the HDAC isoforms. For that reason, since we lack the precise information about which HDAC isoforms are binding to SAHA and derivatives, is why we are studying the binding modes and energetics on 5 available HDAC isoforms and also have computed the average interaction energy, (Table 1 and Figure 6), which clearly indicates that one of the inhibitors, 9c, would show improved binding over SAHA, which is confirmed by the experimental results.
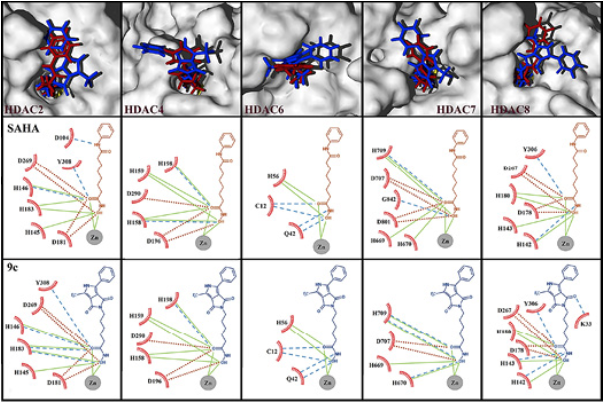
Fig. 6 Surfaces of 5 different HDACs isoforms with superposition of 9c (blue) and SAHA (red) docked. The view displayed is an inset of the active site, in all cases the hydroxamic group remains at the interior of the active sites and benzene rings remain outside. Bottom: Principal hydrogen bonds and electrostatic interactions taking place in such poses. Dashed lines in blue represent hydrogen bond interactions, continuous lines in green represent attractive electrostatic interactions and dot lines in red represent repulsive electrostatic interactions
The complete set of HDAC isoforms is still not available, therefore we cannot calculate the binding energy and study the total effect, and our results are therefore circumscribed to the 5 isoforms discussed in this paper.
In the HDAC2 isoform, SAHA establishes an extra donor hydrogen bond with an aspartate residue in comparison with 9c. However, 9c keeps two acceptor hydrogen bonds with a His 183 residue; the total interaction is stronger for 9c than SAHA. Only for the HDAC4 isoform, SAHA is better docked than 9c by an acceptor hydrogen bond with His 158. Regarding the HDAC6 isoform, hydrogen bonds and electrostatic interactions are similar for both ligands. For HDAC7 isoform SAHA displays repulsive electrostatic interactions with two aspartate residues, 707 and 801, while 9c only interacts with Asp 707. In the HDAC8 isoform, the ligand 9c holds an extra acceptor hydrogen bond with Lys 33 and another extra donor hydrogen bond with His 143 in comparison with SAHA binding mode.
To get information about how 9a and 9b compounds are biologically inactive, we calculated a hydrophobicity surface around the active site of HDAC8. We can observe how the middle section of the active site has a non-polar residue, Phe 152, such residue holds a non-effective interaction with the polar pyrrolidin-1,3-dione oxygen atom of 9a, the same non-effective interaction is displayed for 9b. A different case is observed for 9c, the size of the aliphatic chain situates the pyrrolidin-1,3-dione oxygen atom outside the tunnel of the active site and creates an effective hydrophilic interaction with the polar residue Lys 33 (Fig. 7). In addition, the phenylalanine residue is in the center of the active site in all the other HDAC isoforms.
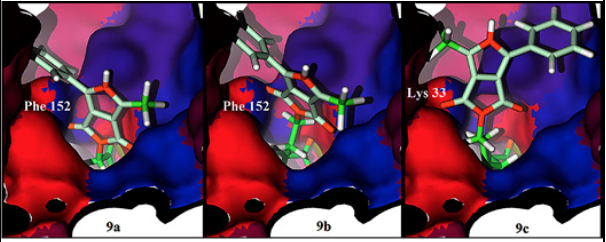
Fig. 7 Hydrophobicity surface of the HDAC8 active site with 9a (left), 9b (center) and 9c (right) docked. Oxygen and nitrogen atoms colored in orange, polar amino acids in red, non-polar amino acids in blue and violet, key residues Phe 152 in blue and Lys 33 in red.
To characterize the effect of changing the functional groups of the capping group in the improvement of the binding energy, DFT chemical descriptors were calculated at the PBE/6-311++G(d,p) level of theory and are reported in Table 2. It can be seen, from the analysis of the electronic affinity values, that the greatest correspond to the 9a and 9b compounds, being therefore the ones more eager to accept an additional electron. This behavior is at variance with 9c, which is the closest to the SAHA value, and found in the docking studies to be the best performer. SAHA has the smaller value of A of the four compounds and therefore it seems that both 9c and SAHA are the least capable to accept electrons during the binding process. For all other chemical DFT descriptors in Table 2, except for the case of hardness, we find that the closest values to SAHA are those of compound 9c. The greatest ionization potentials are those of the 9a and 9b compounds and the smaller 9c value is quite close to the SAHA value. This indicates a better capability to donate electrons of the two latter species; this will correspond with the fact that the binding mode of these compounds to the Zn cofactor in the HDAC active site is enhanced by the ability of 9c and SAHA to more easily donate electrons as compared to 9a and 9b. In Fig. 8 we show the trends of the main conceptual DFT global chemical descriptors for our new compounds and are compared to SAHA.
Table 2 DFT electronic properties for the 4 free hydroxamic acids. Theory level for optimized molecules is PBE/6-311++G(d,p)
| Ligands | I /eV | A/ eV | χ/ eV | η/ eV | ω/ eV |
| 9a | 7.82 | 1.16 | 4.49 | 6.66 | 1.51 |
| 9b | 9.06 | 1.29 | 5.18 | 7.77 | 1.72 |
| 9c | 7.63 | 1.07 | 4.35 | 6.56 | 1.44 |
| SAHA | 7.51 | 0.16 | 3.83 | 7.35 | 1.00 |
SAHA and 9c display the closest values for most descriptors. With this regard, our computational studies suggest that the best performance of the new hydroxamic acids in the HDAC active site turns out to be the one more similar to SAHA in its DFT chemical descriptor values. From values in Table 2 and Fig. 8, it seems that the interaction between the HDAC active site and the hydroxamic acid molecule is more efficient when the ligand is a better electron donor, consequently it seems that the HDAC active site behaves as a good electron acceptor.
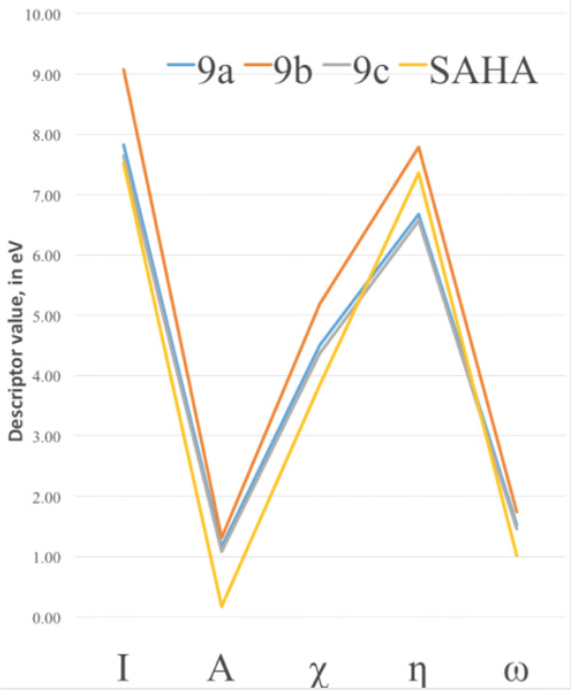
Fig. 8 DFT Electronic global descriptors: Ionization potential (I), Electron Affinity (A), Electronegativity (?), absolute hardness (?) and electrophilicity (?), calculated for SAHA and the new SAHA analogues
Such results evince that the electronic characteristics of the 9c analogue contribute to make it the molecule with the best binding energy, and are useful to understand the physicochemical properties behind the biological activity.
3.3 Biological studies
To further evaluate the efficiency of our new 9c inhibitor as predicted from the computational and docking analyses, we performed a number of biological tests: cytotoxic assay, histone H3 acetylation and DNA damage studies.
3.3.1 Cytoxicity assay of SAHA and analogues in two cells line
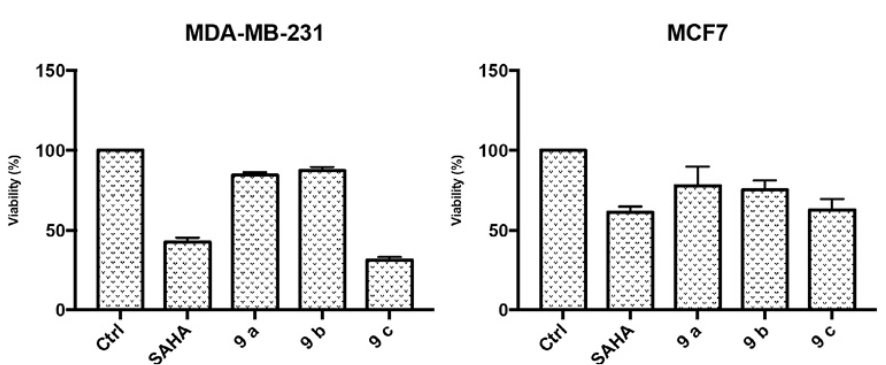
The anti-proliferative effect of SAHA was evaluated by the 3-(4,5-dimethylthiazol-2-yl)-2,5-diphenyltetrazolium bromide, (MTT), assay on MCF7 and MDA-MB-231 cell lines that were treated with different concentrations of SAHA (1, 2.5, 5 and 10 mmol/L) during 24, 48 and 72 h. In Table 3 it is shown that the IC50 value of 9c after 48 h is lower than the value displayed by SAHA. For this reason, compound 9c appears to be more potent than SAHA in a MDA-MB-231 cell line.
Table 3 IC50 of SAHA and 9c analogue (μM) in both cells lines at 48 h, each value represents the mean ? SD of three independent experiments.
| IC 50 SAHA (μM) | IC 50 9c (μM) | |
| MCF7 | 2.1? 0.3 | 7.6 ? 0.7 |
| MDA-MB-231 | 3.1? 0.3 | 1.6 ? 0.2 |
In Fig. 9 it is shown that SAHA and the 9c analogue reduce the percent of viable cells at IC50 concentration. The 9c analogue improves over SAHA particularly in the MDA-MB-231 cell line.
3.3.2 Histone (H3) Acetylation
Docking studies were performed on HDAC enzymes. The biological function of these enzymes is the deacetylation of histones. We analyze the level of histone acetylation in two cell lines. The acetylated histone H3 protein levels were increased in MCF7 by SAHA, 9b and 9c; in MDA-MB-231 cell lines by SAHA and 9c compound as compared to non-treated controls. Since histone deacetylation inhibition is a proposed mechanism of SAHA and derivatives, increase in histone acetylation H3 is consistent with our docking studies. HDACi binding was used to prove compounds with the HDAC pocket that correlated with the level of acetylated histone (Fig. 10). In addition, compounds displaying small level of binding energy did not show an increase in histone H3 acetylation, such as 9a and 9b, in both cell lines.
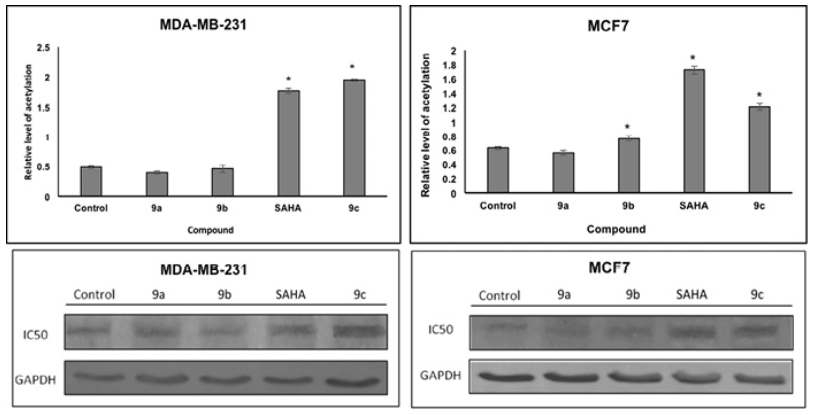
Fig. 10 Effects of SAHA and analogues (9a, 9b and 9c) on histone acetylation of two cell lines. Cells were treated with IC50 concentrations of SAHA for 48 h. Equal amounts of proteins were loaded. The graphs represent the mean ?SD of three independent experiments. Statistical difference for control p<0.05*
3.3.3 DNA damage
The 9c pyrrole derivative induced the highest level of DNA damage and oxidative DNA damage in the MDA-MB-231 cell line (Fig. 11a). In contrast, SAHA induced the highest DNA and Oxidative DNA damage in the MCF-7 cell line, as can be seen in Fig. 11b.
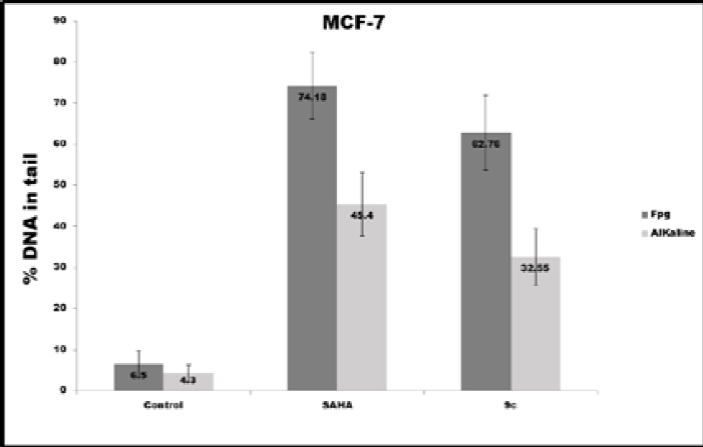
Fig. 11 DNA damage (alkaline) and oxidative DNA damage (Fpg) expressed in % DNA in tail induced in different conditions in both cell lines
We found that both compounds induced oxidative DNA damage as well as single and double breaks in DNA. Another report suggests that SAHA suppresses DNA DSB repair proteins such as RAD50 and MER11 in cancer cells [41]. This may be an explanation for DNA damage in cells treated with SAHA. Another factor that increases the susceptibility to DNA damage in cells treated with deacetylase inhibitor compounds; is the accumulation of histone acetylation which itself could alter chromatin structure. We propose that DNA damage itself is a relevant mechanism to induce cytotoxicity.
4. Conclusions
Our studies have expanded the in-silico design, synthesis and biological evaluation of SAHA analogues. The nuclei pyrrolo[3,4-c]pyrrole hydroxamic acid (9a-c) have been obtained by mild reaction conditions, these compounds were characterized by NMR spectroscopy and HRMS. Our results show that the new SAHA analogue 9c has better anticancer activity than SAHA in the MDA-MB-231 line cells, produces more H3 acetylation and induces more oxidative DNA damage in the MDA-MB-231 cell line. Such findings agree very well with our computational molecular docking and DFT study, which exhibited that the only molecule in this comparative study with capacity to improve SAHA activity like an HDAC inhibitor is 9c, in excellent agreement with the cytotoxic tests.
5. Experimental
5.1 Chemistry
4-Phenyl-2-(trifluoromethyl) oxazol-5(2H)-one (3).
Yield 95%, yellow solid, 1H NMR (500 MHz, CDCl3) δ: 8.43 (d, J = 7.5 Hz, 2H), 7.65 (t, J = 7 Hz, 1H), 7.54 (t, J = 7 Hz, 2H), 6.26 (s, 1H). 13C NMR (125 MHz, CDCl3) δ 162.7, 160.6, 134.0, 129.1, 129.1, 127.3, 123.7-117.0 (q, J = 280), 92.8 - 92.0 (q, J = 35.12).
Methyl 2-(3-bromo-2,5-dioxo-2,5-dihydro-1H-pyrrol-1-yl) acetate (6a).
Yield 53%, brown liquid, 1H NMR (500 MHz, CDCl3): δ 6.73 (s, 1H), 4.31 (s, 2H), 3.77 (s, 3H). 13C NMR (125 MHz, CDCl3): δ 167.5, 167.2, 164.1, 141.3, 127.2, 52.7, 39.1-39.2. HRMS (EI+): calcd for C7H6BrNO4 + [M + H]+, 246.9480; found, 246.9483.
Ethyl 4-(3-bromo-2,5-dioxo-2,5-dihydro-1H-pyrrol-1-yl) butanoate (6b).
Yield 63%, brown liquid, 1H NMR (500 MHz, CDCl3) δ: 6.64 (s, 1H), 4.13 (c, J = 7.1 Hz, 2H), 3.64-3.61 (m, J = 3.5 Hz, 2H), 2.32 (t, J = 7.3 Hz, 2H), 1.91-1.96 (q, J = 7Hz, 2H), 1.26 (t, J = 7.1 Hz, 3H). 13C NMR (125 MHz, CDCl3): δ 172.4, 168.4, 165.2, 140.9, 126.7, 60.6, 37.9, 31.4, 23.6, 14.1. HRMS (EI+): calcd for C9H10BrNO4 + [M + H]+, 274.9793; found, 274.9801.
Methyl 6-(3-bromo-2,5-dioxo-2,5-dihydro-1H-pyrrol-1-yl) hexanoate (6c).
Yield 65%; brown liquid, 1H NMR (500 MHz, CDCl3) δ 6.64 (s, 1H), 4.13 (c, J = 7.1 Hz, 2H), 3.64-3.61 (m, J = 3.5 Hz, 2H), 2.32 (t, J = 7.3 Hz, 2H), 1.91-1.96 (q, J = 7Hz, 2H), 1.26 (t, J = 7.1 Hz, 3H). 13C NMR (125 MHz, CDCl3): δ 172.4, 168.4, 165.2, 140.9, 126.7, 60.6, 37.9, 31.4, 23.6, 14.1. HRMS (EI+): calcd for C11H14BrNO4 + [M + H]+, 303.0106; found, 303.0111.
Methyl 2-(1,3-dioxo)-4-phenyl-6-(trifluoromethyl)-3,5-dihydropyrrolo[3,4-c]pyrrol-2(1H)-yl-acetate (7a).
Yield 51%; white powder, mp 205-206 °C, 1H NMR (500 MHz, CDCl3) δ: 10.12 (s, 1H), 7.96 (d, J = 6.7 Hz, 2H), 7.48-7.37 (m, 3H), 4.38 (s, 2H), 3.80 (s, 3H). 13C NMR (125 MHz, CDCl3) δ: 168.5, 162.7, 160.7, 133.8, 130.4, 129.2, 127.2, 127.2, 126.3, 122.2 -115.8 (q, J = 267.25 Hz), 121.7, 117.5-116.4 (q, J =43.5 Hz), 116.5, 115.8, 52.7, 39.1. HRMS (EI+): calcd for C16H11F3N2O4 + [M + H]+, 352.0671; found, 352.0675.
Ethyl 4-(1,3-dioxo)-4-phenyl-6-(trifluoromethyl)-3,5-dihydropyrrolo[3,4-c]pyrrol-2(1H)-yl-butanoate (7b).
Yield 53%; white powder, mp 153-154 °C, 1H NMR (500 MHz, CDCl3) δ: 10.71 (s, 1H), 8.07 (d, J = 8 Hz, 2H), 7.48-7.33 (m, 3H), 4.11 (c, J = 7 Hz, 2H), 3.67 (t, J = 7 Hz, 2H), 2.37 (t, J = 7.5 Hz, 2H), 2.03-1.91 (q, J = 7 Hz, 2H), 1.23 (t, J = 7 Hz, 3H). 13C NMR (125 MHz, CDCl3) δ: 173.3, 163.9, 162.1, 133.8, 130.1, 129.1, 127.6, 126.4, 122.4-115.9 (c, J = 267.25 Hz, 1C), 121.8, 117.3-116.2 (c, J = 43.5 Hz, 1C), 116.6, 60.7, 37.5, 31.7, 23.9, 14. HRMS (EI+): calcd for C18H15F3N2O4 + [M + H]+, 380.0984; found, 380.0989.
Methyl 6-(1,3-dioxo)-4-phenyl-6-(trifluoromethyl)-3,5-dihydropyrrolo[3,4-c]pyrrol-2(1H)-yl-hexanoate (7c).
Yield 63%, white powder, mp 148 °C, 1H NMR (500 MHz, CDCl3) δ: 10.67 (s, 1H), 8.08 (d, J = 7 Hz, 2H), 7.47-7.37 (m, 3H), 3.65 (s, 3H), 3.60 (t, J = 7 Hz, 2H), 2.30 (t, J = 7.5 Hz, 2H), 1.69-1.58 (m, 4H), 1.40-1.28 (q, J = 7.5, 2H). 13C NMR (125 MHz, CDCl3) δ: 174.5, 163.9, 162.1, 133.6, 130.2, 129.1, 127.7, 122.4-116 (c, J = 267.5), 122.1, 117.2-116.2 (c, J = 43.62), 116.9, 51.6, 38.1, 33.9, 28.2, 26.3, 24.4. HRMS (EI+): calcd for C20H19F3N2O4 + [M + H]+, 408.1297; found, 408.1301.
2-(1,3-Dioxo)-4-phenyl-6-(trifluoromethyl)-3,5-dihydropyrrolo[3,4-c]pyrrol-2(1H)-yl-acetic acid (8a).
Yield 71%, white powder, mp 204-206 °C, 1H NMR (500 MHz, CDCl3) δ: 10.12 (s, 1H), 7.96 (d, J = 6.7 Hz, 2H), 7.48-7.37 (m, 3H), 4.38 (s, 2H), 3.80 (s, 3H). 13C NMR (125 MHz, CDCl3) δ: 168.5, 162.7, 160.7, 133.8, 130.4, 129.2, 127.2, 127.2, 126.3, 122.2 -115.8 (c, J = 43.5 Hz), 121.7, 117.5-116.4 (c, J = 267.25 Hz), 116.5, 115.8, 52.7, 39.1.
4-(1,3-Dioxo)-4-phenyl-6-(trifluoromethyl)-3,5-dihydropyrrolo[3,4-c]pyrrol-2(1H)-yl-butanoic acid (8b).
Yield 90%, white powder, mp 205-207 °C, 1H NMR (500 MHz, DMSO) δ: 13.48 (s, 1H), 12.07 (s, 1H), 8.24 (d, J = 8 Hz, 2H), 7.55 (t, J = 7.5 Hz, 2H), 7.49 (t, J = 7 Hz, 1H), 3.55 (t, J = 6.5 Hz, 2H), 2.27 (t, J = 7 Hz, 2H), 1.81 (q, J = 7 Hz, 2H). 13C NMR (125 MHz, DMSO) δ: 174.3, 164, 161.8, 134.1, 130.3, 129.4, 128.4, 127.1, 123.1-116.7(c, J = 267), 122.3, 117, 116.6-115.6(c, J = 43), 37.6, 31.4, 23.8.
6-(1,3-Dioxo-4-phenyl-6-(trifluoromethyl)-3,5-dihydropyrrolo[3,4-c]pyrrol-2(1H)-yl)hexanoic acid (8c).
Yield 92%, white powder, mp 169-170 °C, 1H NMR (500 MHz, DMSO) δ: 13.49 (s, 1H), 11.98 (s, 1H), 8.24 (d, J = 7.5 Hz, 2H), 7.55 (t, J = 7.5 Hz, 2H), 7.48 (t, J = 7 Hz, 1H), 3.49 (t, J = 7.0 Hz, 2H), 2.20 (t, J = 7.5 Hz, 2H), 1.62-1.46 (m, 4H), 1.33-1.23 (q, J = 8.5, 2H). 13C NMR (125 MHz, DMSO) δ: 201.9, 174.8, 163.9, 161.8, 134.2, 130.3, 129.4, 128.4, 127.1, 123.1-116.7(c, J = 267), 122.2, 116.9, 116.7-115.7(c, J = 42.87), 37.9, 33.9, 28.2, 26.2, 24.5.
2-(1,3-Dioxo)-4-phenyl-6-(trifluoromethyl)-3,5-dihydropyrrolo[3,4-c]pyrrol-2(1H)-yl-N-hydroxyacetamide (9a).
Yield: 58%, white powder, mp 197-198 °C, 1H NMR (500 MHz, DMSO) δ: 10.80 (s, 1H), 10.46-9.32 (d, 1H), 8.96 (s, 1H), 8.23 (d, J = 6.5 Hz, 2H), 7.56 (d, J = 7.2 Hz, 2H), 7.53-7.47 (m, 1H), 4.35 (s, 2H). 13C NMR (125 MHz, DMSO) δ: 163.9, 163.1, 161, 134.9, 130.5, 129.4, 128.3, 127.2, 122.1 - 116.6 (c, J = 267 Hz), 121.7, 117.3 - 116.5 (c, J = 43.37), 117, 116.5, 52.8. HRMS (EI+): calcd for C15H11F3N3O4 + [M + H]+, 354.0696; found, 354.0759.
4-(1,3-Dioxo)-4-phenyl-6-(trifluoromethyl)-3,5-dihydropyrrolo[3,4-c]pyrrol-2(1H)-yl-N-hydroxybutanamide (9b).
Yield: 65%, white powder, mp 180-181 °C, 1H NMR (500 MHz, DMSO) δ: 10.37 (s, 1H), 9.80-9.00 (d, 1H), 8.66 (s, 1H), 8.24 (d, J = 8 Hz, 2H), 7.54 (t, J = 7.0 Hz, 2H), 7.47 (t, J = 7 Hz, 1H), 3.56-3.50 (m, 2H), 2.01 (t, J = 8 Hz, 2H), 1.79 (q, J = 6.5 Hz, 2H). 13C NMR (125 MHz, DMSO) δ: 168.8, 163.9, 161.8, 134.4, 130.2, 129.3, 128.7, 127.1, 123.2, 122.2-116.8 (c, J = 273.75), 117.0-116.0 (c, J = 42.75), 37.8, 30.3, 24.8. HRMS (EI+): calcd for C17H15F3N3O4 + [M + H]+, 382.1015; found, 382.0961.
6-(1,3-Dioxo)-4-phenyl-6-(trifluoromethyl)-3,5-dihydropyrrolo[3,4-c]pyrrol-2(1H)-yl-N-hydroxyhexanamide (9c).
Yield 75%, yellow powder, mp 95-96° C, 1H NMR (500 MHz, DMSO) δ: 10.37 (s, 1H), 9.80-9.00 (d, 1H), 8.66 (s, 1H), 8.24 (d, J = 8 Hz, 2H), 7.54 (t, J = 7.0 Hz, 2H), 7.47 (t, J = 7 Hz, 1H), 3.56-3.50 (m, 2H), 2.01 (t, J = 8 Hz, 2H), 1.79 (q, J = 6.5 Hz, 2H). 13C NMR (125 MHz, DMSO) δ: 168.8, 163.9, 161.8, 134.4, 130.2, 129.3, 128.7, 127.1, 123.2, 122.2-116.8 (c, J = 273.75), 117.0-116.0 (c, J = 42.75), 37.8, 30.3, 24.8. HRMS (EI+): calcd for C17H15F3N3O4 + [M + H]+, 410.1328; found, 410.1350.
5. 2 Biological assays.
5.2.1 Cytotoxicity assay
The cell viability effect of SAHA against different groups of cells was determined by using the MTT dye uptake method. 2 x 10³ cells were cultured in RPMI 1640 medium supplemented with 10% FBS in 96 well plates. SAHA and other compounds in concentrations: 1, 2.5, 5, and 10 µM were added and cells were incubated for 24, 48 and 72 h. Subsequently, 20 µL MTT solution (5mg/mL) was added to each well. After incubation for 4 h at 37°C, the supernatant was removed and 150 µL DMSO was added. When the blue crystals were dissolved, the optical density (OD) was detected by a microplater reader (Epoch Biotek). IC50 was taken as the concentration that induced 50% inhibition of cell proliferation.
5.2.2 Western blot analysis (Histone Acetylation)
Cell lysates were prepared by sonication in ice-cold lysis buffer containing 50 mM Tris-HCl, pH7.8, 0.25 M sucrose and 1 % (w/v) SDS (sodium dodecyl sulfate), 1 μg/ml pepstatin, 10 μg/ml leupeptin, 2 mM sodium orthovanate, 10 mM NaF, 5 mM EDTA, 5 mM N-ethylmaleimide (NEM), 40 μg/ml phenylmethylsulphonyl fluoride (PMSF), and 0.1 % Nonident-P40. Electrophoresis was performed on 30 μg of sample proteins loaded onto 12% SDS-polyacrylamide gel. Prestained molecular- mass markers were run on adjacent lanes. The gels run in duplicate were electroblotted and stained with Coomasie blue. Blots were probed with anti-H3 acetylated primary antibodies (1:1000). Horseradish peroxidase-conjugated goat anti-rabbit IgG (1:2000). Secondary IgG binding was visualized using an enhanced chemiluminescence Western blot analyzer (Amersham). Blot images were digitized (Chemidoc, Bio-Rad).
5.2.3 Comet assay
The comet assay protocol was modified to detect oxidized bases and to agree with the critical parameters of the proposed protocol 42. In brief, two duplicate comet slides were made for each treatment: one slide was treated with Fpg and the other served as a control. Aliquots of 10 μl with 20 000 cells were mixed with 90 μl of 0.7% agarose and the mixture was transferred onto a frosted slide, pre-coated with normal melting agarose (1%). A cover slip was added, and the slide was cooled on ice to harden the agarose. For positive controls the slides were treated with 50 μl of 2 x 10⁻⁵ M hydrogen peroxide for 5 minutes and then incubated at 4? C in fresh lysis light protected buffer (2.5 M NaCl, 0.1 M Na2 EDTA, 0.01 M Tris-HCl, 10 % DMSO and 1 % of Triton X-100, pH10) For enzyme treatment the slides were removed from lysis buffer and incubated with enzyme reaction buffer (40 mM Hepes, 0.1 KCl,0.5 mM EDTA and 0.2 mg/ml BSA, adjusted to pH 8 with KOH) for 10 minutes. Fpg enzyme (50 μl of 1:105 dilution) was added to the slides and incubated 35 min at 37?C. These slides were washed in enzyme reaction buffer without enzyme.
Slides with and without Fpg treatment were immersed in cold alkaline unwinding electrophoresis solution (0.3 M NaOH and 1 mM Na2EDTA in deionized water pH 13.5) for 30 minutes and subjected to electrophoresis for 30 min at 25 V constant voltage. All this procedure was carried out in dark. The slides were stained with DAPI and analyzed by free image analysis software (Auto Comet of Triket Corporation). The tail percentage was used as DNA damage parameter. The complete protocol for specific oxidative detection with Fpg enzymes was described in another publication 43.


 nova página do texto(beta)


