


 nova página do texto(beta)
 Inglês (pdf)
 Artigo em XML
 Referências do artigo
 Enviar este artigo por email
 Citado por SciELO
  Similares em
SciELO
Similares em
SciELO 
 Permalink
Introduction
Biopolymers from natural resources are considered an exciting alternative for the developing functional materials in emergent areas of human activity (Do Nascimento Marques et al., 2020). In this context, chitin is one of the most abundant polysaccharides in the biosphere. It is synthesized by many living organisms, mainly arthropods, mollusks, and the fungi kingdom (Peniche et al., 2008). Chitin naturally occurs in the endocuticle of the crustacean exoskeleton matrix, which is closely associated with proteins, pigments, and inorganic salts (Figure 1) (Pastor de Abram, 2004). Chemically, chitin is constituted by β-(1→4) glycosidic binding units of N-acetyl-ᴅ-glucosamine (Figure 2). This polysaccharide has exhibited interesting properties, such as antimicrobial activity, biodegradability, low immunogenicity, high insolubility, and low chemical reactivity (Ravi Kumar, 2000). Furthermore, a substantial amount of the produced chitin is deacetylated to obtain chitosan, thus improving its properties expanding its derivatization ability and applications.
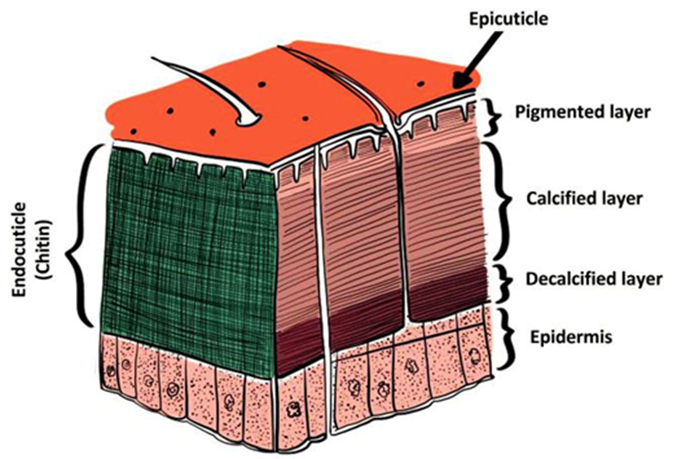
Figure 1 Scheme of the crustacean matrix microstructure, constituted by the epicuticle, the endocuticle, and the epidermis, with chitin localized into the endocuticle. Reprinting from Ref. Pastor de Abram (2004), Copyright 2004, with permission from Fondo Editorial de la Pontifica Universidad Catolica del Peru.
Figura 1 Esquema para la microestructura de la matriz de los crustáceos, la cual está constituida por la epicutícula, endocutícula y la epidermis. La quitina se encuentra en la endocutícula. Reimpreso de Pastor de Abram (2004), Copyright 2004, con permiso del Fondo Editorial de la Pontífica Universidad Católica del Perú.
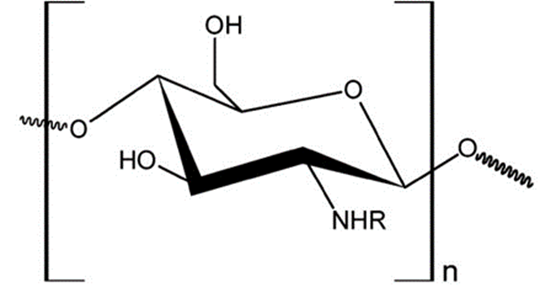
Chitosan (Cs) is a random copolymer constituted by β-(1→4) linked units of N-acetyl-ᴅ-glucosamine (acetylated units) and ᴅ-glucosamine (deacetylated units) (Figure 2). Commonly, this biopolymer is obtained by deacetylation of chitin, although it has also been found naturally in the cell wall of some fungal groups such as Zygomycetes (Ghormade et al., 2017). The investigation of chitosan in fields as biotechnology, biomedicine, and food industry has prominently heightened, owing to their properties like bio-compatibility, muchoadhesivity, non-toxicity, among others (Argüelles-Monal et al., 2018).
Traditionally, the large-scale production of chitin and chitosan is mainly from crustacean waste of the seafood industry (Dahmane et al., 2014; Joseph et al., 2021; Younes and Rinaudo, 2015). The isolation procedures include chemical and biological methods and other emerging approaches such as microwave-based (EL Knidri et al., 2019) and ultra-sound-based (Hou et al., 2020) methods. In this respect, the chemical method is a scalable and well-established protocol that involves the lixiviation of minerals, proteins, and pigments from the exoskeleton matrix (Joseph et al., 2021; Peniche et al., 2008; Younes and Rinaudo, 2015).
Various reports on chemical approaches to produce chitin and chitosan are available; however, no standard method is still established. Thus, the treatment must be tailored to the particular source of chitin, owing to their ultra-structure being strongly dependent on the species (Younes and Rinaudo, 2015). Consequently, selecting an appropriate treatment has a notable influence on the quality and physicochemical properties of the final product. The source-based substantial differences comprise the polymer chain length, the acetylation degree, and the distribution of the N-acetylated groups along the macromolecular chain (Joseph et al., 2021). Undoubtedly, understanding the chemical structure of these biopolymers is essential for estimating their functional properties and potential applications (Younes and Rinaudo, 2015). In recent decades, several investigations about the chemical obtaining and characterization of these polymers from different sources are reported (Dahmane et al., 2014; EL Knidri et al., 2019; Mohammed et al., 2013; Puvvada et al., 2012; Wang et al., 2013).
In this sense, the penaeid shrimp are a class of crustaceans with commercial importance in tropical and subtropical seas, reaching 1 Mt/yr of world catch (Rábago-Quiroz et al., 2019). The shrimp fishery represents one of the leading industries in Mexico, owing to the social and economic benefits involved. Precisely, the Pacific coast in the Gulf of California (Sonora and Sinaloa, Mexico) provides over 77% of the global shrimp production in Mexico (CONAPESCA (Comisión Nacional de Acuacultura y Pesca), 2018). The three main commercial species in this region are the blue shrimp Penaeus stylirostris (Stimpson, 1871), white shrimp Penaeus vannamei (Boone, 1931), and the brown shrimp Farfante-penaeus californiensis (Holmes, 1990; Rábago-Quiroz et al., 2019). The latter constitutes the most abundant species in the fishery by weight of the offshore catch (Meraz-Sánchez et al., 2013), whereby the exoskeleton waste represents a by-product of the seafood industry that could be a potential resource for chitin and chitosan. Despite the importance of this topic, to the best of our knowledge, there are no previous reports about physicochemical studies of the chitin and chitosan produced from this particular genus.
In this context, this work aims to develop a protocol to obtain chitin and chitosan from the exoskeleton of brown shrimp (Farfantepenaeus californiensis). This study also emphasized evaluating the fundamental physicochemical properties to understand the structure-function relationship of the chitosan obtained.
Materials and methods
Materials
The solvents and reagents used were analytical grade and acquired from FAGALAB (Mocorito, Sinaloa, Mexico). Unless otherwise stated, all experiments were carried out using Type 2 pure water (conductivity < 0.2 µs cm-1).
Preparation of the chitinous waste
A local seafood restaurant from Guaymas, Sonora, Mexico donated the raw shrimp shells at the beginning of the catch season (September-October) to guarantee the size of the crustacean as homogeneous as possible. The fishers of the Sea of Cortez coast directly provided the single species shrimp Farfantepenaeus californiensis to the establishment. The brown shrimp is the predominant species in bays and offshore of the Gulf of California region, which has distinctive and easily identifiable morphological characteristics (size, shape, and shell color) from other endemic species (Barbosa-Saldaña et al., 2012).
The fresh material was vigorously washed against tap water to eliminate the organic waste; later, the sample was stored at -20 °C until before processing (overnight), and finally, the frozen sample ground to homogenize using a conventional food processor (150 W).
Demineralization
Chitin isolation was according to the procedure reported by Beaney et al. (2005) with slight modifications. Briefly, the triturated residue was integrated with an HCl aqueous solution (1.8 M), with continual stirring at room temperature for 2 h, and the material washed against tap water to neutralize.
Deproteinization
The demineralized material was mixed with NaOH aqueous solution (15 wt%) using a 1:15 residue/solvent ratio; the mixture remained with continual stirring at 65 °C for 2 h, then the material washed against tap water to neutralize. Finally, the product was dispersed in a flat container and dried at 60 °C for 24 h.
Obtention of chitosan
The chitin deacetylation to produce chitosan was carried out by chemical method. To this end, the chitinous material was treated with a 50 wt% NaOH aqueous solution at 100 °C, under continual stirring for 2 h, then washed against tap water until neutral pH and finally dried in a conventional oven (IGS400 Heratherm, Thermo Scientific) at 60 °C for 24 h.
An exhaustive process of filtration achieved the chitosan purification. To this purpose, the sample dissolved in 0.3 M acetic acid aqueous (0.35 w/v %) was successively filtered through cellulose filter paper (particle retention ≥11 μm, Whatman®) and nitrocellulose membranes (pore size: 3 μm, 1.2 mm, 0.8 mm y 0.45 mm, MF-milliporeTM). Subsequently, it was precipitated by dropwise addition of 0.3 M ammonium hydroxide until pH~8. The precipitated material, carefully washed with water until no change in conductivity detected, was separated using a centrifuge (Thermo Scientific, Heraeus Megafuge 16). Finally, the product was freeze-dried (2.5L Benchtop Freeze Dryers, Labconco corporation) and stored at room temperature.
Proximal analysis
The quantification of protein content in the chitin and chitosan samples was according to the method proposed by Díaz-Rojas et al. (2006). This approach allows estimating protein and chitin from the total nitrogen content, knowing the composition of the other components in the sample. To this end, the total nitrogen content of the polymer samples was determined by the micro Kjeldahl method, and the official analytical methods used to estimate moisture (Method 991.01), minerals (Method 942.05), and lipids (Method 7.06) (Association of Official Analytical Chemists, 1990).
Briefly, the moisture content of the raw material and the chitosan sample was determined by heating in a conventional oven (IGS400 Heratherm, Thermo Scientific) at 100 °C for 24 h. The calculation of water content was by comparing the weight of the sample before and after the drying process. The estimation of the ash content was by the gravimetrical method using calcination in a conventional oven at 800 °C to obtain the ash (4 h), and then the sample kept in a desiccator for 24 h to obtain constant weight. The following equation calculated the ash content percentage:
Where m 0 is the mass of the dry sample (before the calcination process), and m 1 corresponds to the mass of the calcinated product, these procedures were carried out in triplicate.
ATR-FTIR spectroscopy
Fourier transform infrared (FTIR) spectra were analyzed using Thermo Scientific Nicolet iS-50 equipment (Madison, WI, USA). Samples were performed in attenuated total reflectance mode for 64 scans, using a resolution of 4 cm-1.
The estimation of the degree of acetylation (DA) in the chitosan sample was through infrared spectral analysis. To this purpose, the characteristic band located at 1320 cm-1 (amide III) was chosen to measure the DA, and the band at 1420 cm-1 (-OH group) was used as an internal reference, according to the correlation proposed by (Brugnerotto et al., (2001)
Where A 1320 and A 1420 correspond to the absorbance of the bands localized at 1320 y 1420 cm-1, respectively.
Nuclear magnetic resonance spectroscopy (1H-NMR)
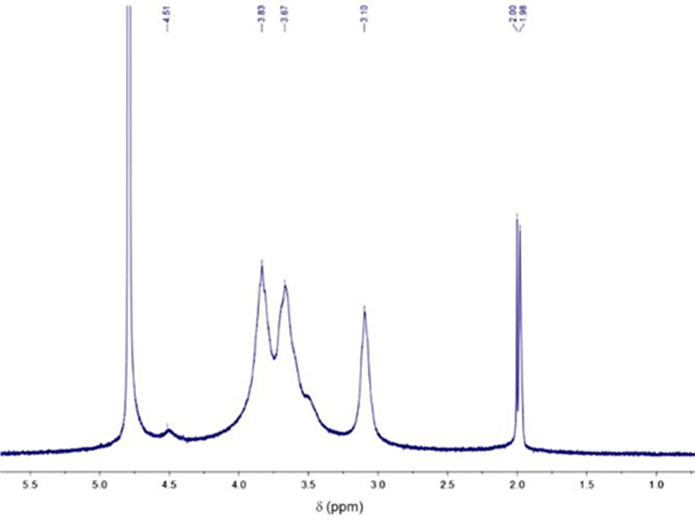
Recording of the high-resolution 1H-NMR spectros-copy data was on a Bruker Avance 400 equipment (400 MHz), analyzing the chitosan sample dissolved in D2O/DCl (8 mg mL-1) at 20 °C with MestreNova software (Santiago de Compostela). The proton chemical shift of residual water was chosen as a reference.
The degree of N-acetylation of the chitosan sample was determinate by 1H-NMR analysis. The measurement was carried out from the ratio between the signal of the C-H proton (3.10 ppm) of the N-ᴅ-glucosamine monomeric unit and the signal of the three N-acetyl protons (2.00 ppm) relative to the N-acetyl-ᴅ-glucosamine monomeric unit (Vårum et al., 1991). Then, the calculation of the DA percentage was by the following equation.
Viscosity-average molecular weight (M v )
The kinematic viscosity measurements were performed with an Ubbelohde capillary viscometer (diameter 0.58 mm) at 25 °C by quadruplicate. To this end, the chitosan sample was previously dissolved in the solvent 0.3 M AA + 0.2 M sodium acetate (1 mg mL-1) (Rinaudo et al., 1993). Then, the calculation of the viscosity-average molecular weight of pure chitosan was by the Mark-Houwink-Sakurada equation:
Where
Thermogravimetric analysis
Thermogravimetric analysis (TGA) was performed in TGA Pyris equipment (Perkin Elmer). The recording of samples were in palladium pans in a range of 25 °C to 600 °C at 10 °C min-1, under nitrogen flow (10 mL min-1). The analysis of the results were with the TA Universal Analysis software.
Results and discussion
Isolation of chitin
Figure 3 displays the procedure for the isolation of chitin and the preparation of chitosan. The treatment involves the reduction and homogenization of the particle size of the raw material (< 20 mm). This step is crucial to increase the sample's surface area and favors the subsequent lixiviation process of the proteins, minerals, and pigments (associated with the matrix of the crustacean exoskeleton).
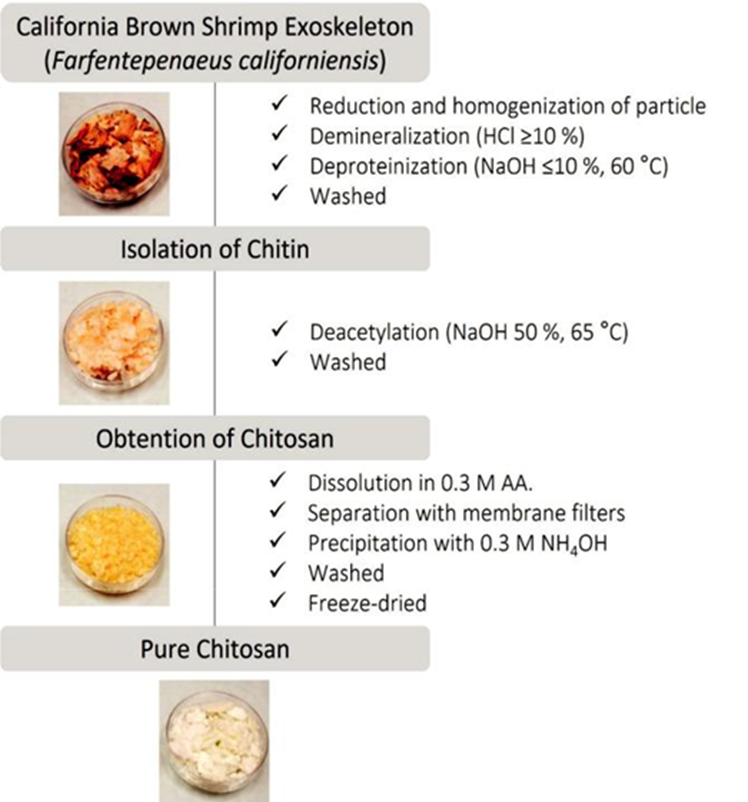
Demineralization decomposes the minerals in water-soluble inorganic salts (mainly calcium carbonates and phosphates). On the other hand, deproteinization involves disrupting chemical interactions into the chitin-proteins complex, which represents a more significant challenge to separate the undesirable substances (Younes and Rinaudo, 2015). Both treatments require rigorous washing of the product to eliminate as much residue as possible. In some investigations, the design of an inverted sequence for the waste removal process has been reported (Sierra et al., 2013), however, it is often recommended for chitin extraction from high protein raw materials (e.g., shrimp heads) (Beaney et al., 2005; Pastor de Abram, 2004).
The process conditions and the solvents used resulted appropriated to achieve chitin isolation, obtaining 33 % (dry mass) of yield by gravimetry. Previous work reports that the yield of chitin is strongly dependent on the biological origin of the raw material and the processing (Kurita, 2006). In this regard, Kurita et al. (Sannan et al., 1976) documented that the chitin content in the dried shrimp exoskeleton is closed to 30-35 %. Using a chemical protocol, Percot et al. (2003) obtained 20 % chitin from the Parapenaeopsis stylifera shrimp species exoskeleton; Abdou et al. (2008) isolated chitin from Penaeus aztecus and Penaeus durarum shrimp species and achieved 21.53 % y 23.72 %, respectively. In another study, Puvvada et al. (2012) report that 34 % of chitin yield was obtained from Penaeuscarinatus and Penaeus monodon shrimp exoskeleton, in the Suryalanka Coast (Guntur, India). On the other hand, Rødde et al. (2008) performed a systematic study about the dependence of the chitin properties on the seasonal variation, using shrimp shells of the deep-water Pandalus Borealis species; in this work, the chitin content from the shrimp waste was found between 17-20 % (dry weight), and no apparent seasonal differences were found. Accordingly, a comparative analysis suggests that the Farfantepenaeus californiensis brown shrimp species constitutes an economically feasible resource for the industrial-scale production of chitin.
The appearance of the raw material and the obtained products were compared visually. The evolution of the depigmentation and texture after each sample treatment is displayed in the illustrations of Figure 3. The dry sample of chitin had a pale pink- orange tone and flake-like shape. This coloration is typical of crustacean species’ inherent pigments and proteins. Basically, the pigments comprise carotenoids such as astaxanthin, lutein, canthaxanthin, β-carotene (Tanaka et al., 1976), representing an exciting by-product for the chitin and chitosan production industry. In some cases, a supplementary decolorization treatment after the deminer-alization/deproteinization process results in the removal of these pigments.
Preparation of chitosan
The chitin obtained was partially deacetylated via chemical treatment to produce chitosan. In this work, the deacetylation process was performed under concentrate alkaline conditions, accompanied by harsh thermal treatment. Some factors that influence the stringency of the process are: (i) the limited reactivity of acetamide groups (trans configuration); (ii) the occurrence of secondary hydrogen bonds between the carbonyl group and the amide group of the side chains; and (iii) the packing density that characterizes the crystal structure of chitin (Pastor de Abram, 2004).
On the other hand, the purification of the sample favors the elimination of residual substances emanating from the deacetylation reaction and homogenizes the product. Considering the dry mass of the exoskeleton, the yield of chitosan production was 23 %. This data is lower than the results obtained by other authors (Puvvada et al., 2012), which may be attributable to the sumptuous separation process involved. The freeze-dried chitosan showed an off-white with a slightly tan color and porous-like structure due to the natural drying process (Figure 3). The decolorization is typical of the deacetylation reaction since it involves removing or degrading a considerable amount of the inherent residual pigments of the raw material. In this sense, Beaney et al. (2005) performed a comparative study of two treatments (lactic acid fermentation and chemical method) to extract chitin from Nephrops norvegicus prawn shell; these autors report that the severe chemical treatment promotes the remotion or degradation of most of the inherent pigments.
On the other hand, the proximal analysis showed that the chitosan sample had 10.41±0.032 % moisture content, 0.11±0.042 % ash, and 12.65±0.948 % proteins. These results agree with those reported for products obtained from similar raw materials (Beaney et al., 2005; Sierra et al., 2013).
Spectroscopy characterization
FTIR and 1H-RMN spectroscopy elucidated the chemical identity of the samples. The FTIR spectra for the exoskeleton, chitin, and pure chitosan are shown in Figure 4. The un-purified chitosan sample displayed similar spectrum patterns with the purified samples (data not shown). Altogether, the chitin spectrum exhibits sharped absorption bands than the chitosan sample. These results can be attributed to the high crystallinity of the chitin sample compared with its deacetylated derivative (Rinaudo, 2006).
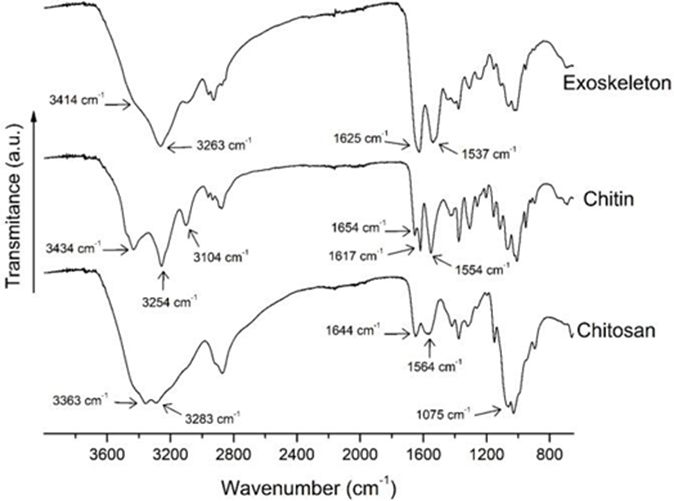
The chitin spectrum displays sharp bands at 3434 cm-1 (O-H group stretching vibration, intermolecular hydrogen interactions) and 3254 cm-1 (N-H vibration). The accurate position of the O-H vibration band is dependent on the hydrogen bond strength. The sharpness of these bands can be attributed to the concentration and ordered molecular conformation of the polysaccharide chains (Socrates, 2001). Likewise, the exoskeleton spectrum shows these bands; the absorption of O -H vibration appears as a shoulder at 3407 cm-1 due to the superimposition with the broad N-H band (Socrates, 2001); the overlap of this band may be due to the presence of substances associated with the exoskeleton matrix. In the chitosan spectrum, those bands appear as a shift to lower wavenumbers (3363 cm-1), which could be assigned to the presence of additional intramolecular hydrogen bonds (Socrates, 2001). Similar results were reported by Palpandi et al. (2009) for chitin and chitosan prepared from the Nerita crepidularia mangrove gastropod exoskeleton and operculum.
The amide I band appears to split into two signals in the chitin spectrum at 1654 and 1617 cm-1. According to Rinaudo (2006), the occurrence of this double band is typical for the α-chitin allomorph in the crystalline structure. The α-chitin form is characterized by the strong adhesion between the sheets of the chitin crystalline structure due to the hydrogen bonds (Argüelles et al., 2004). This result suggests that the chitin isolated from California brown shrimp has mostly this allomorph. Likewise, the amide II band is observed at 1554 cm-1. On the other hand, the chitosan spectrum shows typical strong bands at 1644 cm-1 (amide I, C=O group stretching vi-bration), at 1564 cm-1 (amide II, N-H bending motion), and, at 1075 and 1028 cm-1 due to skeletal vibration of the pyranose ring (Pastor de Abram, 2004).
High-resolution 1H-NMR spectroscopy was carried out to ascertain the molecular structure of the chitosan sample (Figure 5). The spectrum exhibits chemical shifts for the corresponding protons to N-acetyl-glucosamine molecular unit at 2.00 ppm (H-acetyl) and 4.51 ppm (H-1). Furthermore, the resonance attributed to N-glucosamine residue was ob-served at 3.10 ppm (H-2), and the peaks corresponding to the H-2/H-6 protons were localized between 3.5 and 3.83 ppm (Rinaudo, 2006; Vårum et al., 1991).
Estimation of the degree of acetylation (DA)
The DA of the chitosan was estimated from spectroscopic methods. The FTIR method involves correlating the absorbance bands of N-acetyl-glucosamine residue (1320 cm-1, C-H flexion from -CH3 acetamide group) considered an internal reference band (1420 cm-1). By applying equation 2, the chitosan DA was calculated as 16.36 %. On the other hand, the estimation method from 1H-RMN spectroscopy analysis compares characteristic peaks of the acetylated and deacetylated residual units by integration of signals. According to equation (3), the DA was estimated at 15.87 %. The value obtained from both methods is similar, and the result is approximated to the data reported in similar studies (DA~ 11 %) (Puvvada et al., 2012).
Determination of Viscosity-average molecular weight
Viscosimetry is the most used method to estimate the average molecular weight of chitosan. It is a simple and non-absolute method since it requires the correlation between the intrinsic viscosity and the molecular weight of the polymer (Peniche et al., 2008). The intrinsic viscosity of chitosan was calculated by extrapolating the viscosity measurements to zero concentration from the ordinate at the origin of the line, applying the Huggins equation. Then, the Mv of the chitosan sample was estimated at close to 170 kDa by applying equation (4). This result is classified as low molecular weight (LMW< 300 kDa) (Joseph et al., 2021).
In general, it has been found that LMW chitosan exhibits lower viscosity and density, better solubility in aqueous solutions, and higher penetration capacity into cells. Likewise, some authors have reported that LMW chitosan manifests a more significant inhibitory effect against phytopathogens (Meng et al., 2010). Taken together, the LMW and the high DA (84.13 %) factors suggest that the obtained biopolymer is a candidate for potential applications such as wound healing, food preservatives, wastewater treatment, and protein drug delivery systems (Joseph et al., 2021).
Thermogravimetric analysis
Thermal stability is an essential factor in determining the potential applications of biomaterials. The polysaccha-rides usually have an amorphous structure that can quickly hydrate in a solid-state. Chitin requires high thermal energy to dissociate its characteristic crystalline structure (Wang et al., 2013). It is reported that the primary thermal effect of this polysaccharide is dependent on the molecular weight and the DA of the sample (Alonso et al., 1983).
The thermogravimetric (TG) and differential thermo-gravimetric (DTG) curves for the exoskeleton, chitin, and pure chitosan are displayed in Figure 6. The thermograms exhibit two different thermal steps for the samples. The former occurs below 145 °C, associated with free water evaporation (3.5-10 %). Chitin sample shows 3.5 % weight loss from water, which represents a lower amount than the other samples. This result is concomitant with the crystalline structure of chitin. As previously stated, chitin obtained from Farfantepenaeus californiensis shrimp waste is conformed mainly by α-chitin allomorph. This molecular arrangement contributes to the sample’s lower hydrophobicity and water permeability.
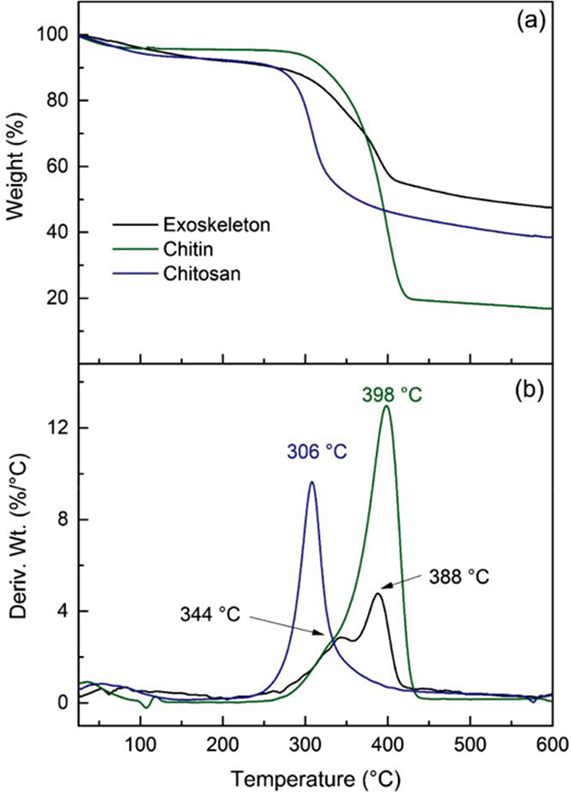
The second thermal event of chitin occurs between 258 °C and 438 °C with a maximum rate of 398 °C. This remarkable weight loss (76%) corresponds to degradation of the pyranose ring of polysaccharide, which includes dehydration of the saccharide ring, depolymerization, and decomposition of chitin molecular units (Paulino et al., 2006). In the exo-skeleton sample, two thermal steps are exhibited between 266-422 °C, piked at 344 and 388 °C, respectively. This double thermal event can be attributed to the polysaccharide structure degradation, which adopts different conformations and types of interaction associated with minerals, proteins, and pigments into the exoskeleton matrix (Juárez-de la Rosa et al., 2015).
As expected, the chitosan sample exhibits lower thermal stability than chitin. The degradation of the polymer occurs in the range of 230-400 °C, whose maximum peak is found at 306 °C. This effect can be attributed to the preponderance of the non-acetylated units and the transition from the typical chitin crystalline regions to the distinct amorphous zones of chitosan (Alonso et al., 1983). In addition, a progressive weight loss is observed above 440 °C due to the formation of gas molecules such as CO, CO2, and H2O (Wang et al., 2013).
Conclusions
Chitin and chitosan have been successfully produced from the Farfantepenaeus californiensis brown shrimp exoske-leton. The experimental chemical procedure allows obtaining a 33 % yield of chitin and 23 % of chitosan. Also, chitosan has a high degree of deacetylation (84.13 %), and low viscosity-average molecular weight (170 kDa). This work contributes to the physicochemical study of chitin and chitosan from this species. The results provide the baseline information for utilizing these biopolymers in promising applications such as wound healing, food preservatives, wastewater treatment, protein drug delivery systems. Therefore, the chitinous waste from the Sea of Cortez coast represents a significant source for preparing these biopolymers.

