


 nova página do texto(beta)
 Inglês (pdf)
 Artigo em XML
 Referências do artigo
 Enviar este artigo por email
 Citado por SciELO
  Similares em
SciELO
Similares em
SciELO 
 Permalink
Introduction
Shrimp aquaculture production has shown an accelerated increase in the last two decades, reaching 4.966 million tons in 2018 for L. vannamei, corresponding to 54 % of crustacean aquaculture (FAO, 2020). These production levels have been possible thanks to the culture intensification, where the use of formulated feeds and feed management has been a fundamental strategy (Wasielesky et al., 2006). Shrimp feed quality include protein, fatty acids, carbohydrates, vitamins, minerals, and additives (Wang et al., 2015). Protein is one of the most important nutrients required for growth (Hu et al., 2008) and accounts the major economic and environmental cost in diets formulation, favoring the increase of nitrogen residuals to the environment (Tacon and Akiyama, 1997; Lee and Lee, 2018; Gil-Nuñez et al., 2020). The proper use of protein favors rapid growth (Guroy et al., 2012) and water quality in aquaculture systems (Limsuwan and Junratchakoo, 2004). A minimum dietary protein level is required to supply amino acids for normal maintenance of metabolism (Lee and Lee, 2018). Several studies have evaluated the adequate protein requirements in terms of protein levels in feeds, finding the best yields feeding with 36 % (Yaemssoksawat et al., 2008) and 40 % (Liu et al., 2005). Kureshy and Davis (2002) determined the daily protein intake (g DP kg-1 BW d-1) for maintenance and maximum growth for L. vannamei juveniles at different body weights (g) and protein retentions. In addition to protein, the development of aquaculture systems requires a precise evaluation for the rest of the energy substrates.
The protein in the diet can be reduced if the energy required comes from another source such as carbohydrates or lipids, which can reduce the emission of residual nutrients and feed costs (Zainuddin et al., 2014). Shrimp require lipids in their diet to perform a series of metabolic functions, where the recommended lipid levels in the diet range between 6 and 10 %, with negative effects on growth with values greater than 10 % (González-Félix et al., 2002; Xu et al., 2017; Jannalhulla et al., 2019). Zhang et al. (2013) determined that the effect of lipids could vary depending on the protein, reporting highest growth rates at high inclusion percentages in diets with 34 % protein. Despite the low digestibility of carbohydrates by the shrimp (Shiau, 1997), carbohydrates are often used in formulated feeds as an energy source through the protein-sparing mechanism (Wang et al., 2015), where feeding with frequency of four times per day, diets carbohydrate-rich presents a good performance (Zainuddin et al., 2014).
The importance of protein amount provided is clear in aquaculture, also related to other different nutrients in the feeding of shrimp. On the other hand, there is a lack of studies related to the growth of L. vannamei with fixed amounts of protein anchored to different ratios of other nutrients. Thus, the aim of this study was to determine the daily protein intake (DPI) mathematical functions related to body weight, in order to use in experiments to evaluate carbohidrate:crude protein ratios in feeds with low inclusion of fishmeal that present the best performance in terms of growth, protein efficiency and nitrogen retention. The use of mathematical functions for the supply of protein will favor the use of the appropriate amount of this, reducing economic and environmental costs while maintaining good performance, allowing evaluate feed formulas and variation of other energetic substrates such as carbohydrates.
Material and methods
Shrimp feeding tables
Different shrimp feeding tables reported for L. vannamei aquaculture in several countries or recommended by relevant feed companies were reviewed. Feeding tables used in this study were based on biomass percentages (%Biomass) for different shrimp Body Weights (g).
DPI mathematical model
Daily protein intake (g protein/kg biomass/day) mathematical function related to L. vannamei Body Weight (BW) in grams, was adjusted in this study from experimental data reported by Kureshy and Davis (2002), using selected DPI data for different BWs where Protein Retention (%) was similar (37.2 % in average).
Data from different feeding tables reviewed in this study were transformed to Daily Protein Intake DPI (g protein /Kg Biomass/day) related to individual BW and were analyzed to determine the best fit for mathematical functions between both variables, using the same mathematical model mentioned previously. The best fit for DPI mathematical function for all the data reported for L. vannamei in an explicit or implicit manner (through feeding tables) was DPI=a(BW)b, where DPI is expressed in g protein/Kg biomass/day and BW in grams.
The mathematical function adjusted from data reported by Kureshy and Davis (1992) was considered as 100 % DPI, and four functions were developed as a variation in 20 % between them (80, 100, 120 and 140 %) to cover the explicit or implicit DPI data reviewed for L. vannamei aquaculture at different body weights. These mathematical functions were evaluated experimentally at different levels of DPI and same BW respect to growth, protein efficiency and nitrogen retention using feeds with fixed carbohydrate: crude protein (CBH:CP) and lipid:crude protein (Lip:CP) ratio.
First trial: DPI mathematical functions related to 80, 100, 120, 140 % DPI levels
The experiment was carried out in the experimental nutrition laboratory at the Centro de Investigaciones Biológicas del Noroeste S.C. (La Paz, Baja California Sur, México). L. vannamei juveniles (1 ± 0.5 g) from Aquacultura Mahr local company, kept under laboratory conditions for one week, were randomly distributed in three experimental units (60 L fish tanks) (n=12) for each DPI level. Shrimp were reared under controlled conditions of salinity 37 ±0.5 psu (practical salinity units), dissolved oxygen (6 ± 1.0 mg O2 L-1), temperature (28 ±1 °C) and photoperiod (12:12h light:dark).
Shrimp were fed with a commercial diet (40 % protein and fixed CBH:CP ratio) in four daily rations (9:00, 12:00, 15:00 and 18:00 h) to decrease the amount of feed not eaten according to four DPI levels (80, 100, 120 and 140 %) for 35 days. The DPI levels were adjusted weekly according to the shrimp body weight and biomass. The shrimp tanks were siphoned every day to remove uneaten food, with a weekly water exchange (80 %), to remove organic carbon, nitrogen and phosphorous residuals accumulated during the week. Also, the experimentally selected DPI mathematical function was used to evaluate five experimental low fishmeal feeds with different CBH:CP ratios using the same Lipid:Crude protein level and DPI mathematical function.
Formulated diets
For the second experiment, five diets were formulated with Nutrion® software, using a low inclusion of fish meal (6.5 %; Table 1), yeast and soybean meal as protein, sardine oil for lipids and wheat flour as carbohydrate source, to obtain five CBH:CP (2.1, 1.5, 1.1, 0.8 and 0.6) ratios with the same Lip:CP ratio (Table 1). The ingredients were ground in an ultrafine sprayer set at 250 µm and mixed with water and a fermented mix of marine yeasts and lactobacilli selection. Once extruded and dried, the diets were subjected to two steps of organic acid and fish oil baths. Table 2 shows the proximal composition of the diets.
Table 1 Diets composition formulated with five different carbohydrate:protein (crude protein)
(CBH:CP) ratios with same lipid:protein (Lip:CP) ratio for
L. vannamei. Ingredients are expressed in dry
weight (%).
Tabla 1. Composición de dietas formuladas con cinco
proporciones diferentes carbohidrato:proteína (proteína cruda)
(CHO:CP) con la misma proporción lipido:proteína (Lip:CP) para
L. vannamei. Los ingredientes se expresan en
base seca.
| Diet | 1 | 2 | 3 | 4 | 5 |
|---|---|---|---|---|---|
| CBH:CP | 2.1 | 1.5 | 1.1 | 0.8 | 0.6 |
| Lip:CP | 0.2 | 0.2 | 0.2 | 0.2 | 0.2 |
| Wheat meal | 51.4 | 37.4 | 23.6 | 16.6 | 8.4 |
| SPC1 | 0 | 0 | 10 | 32.4 | 49.1 |
| Soybean meal | 21.9 | 36 | 36.8 | 20.4 | 11.5 |
| Fishmeal | 6.5 | 6.5 | 6.5 | 6.5 | 6.5 |
| Fish oil | 0.7 | 1 | 1.5 | 1.8 | 2.2 |
| Yeast 2 | 4 | 4 | 4.5 | 4.5 | 4.5 |
| PM vit3 | 2.6 | 2.6 | 2.6 | 2.6 | 2.6 |
| PM min4 | 6.3 | 6.1 | 5.8 | 5.9 | 5.7 |
| Soybean lecithin | 2.4 | 3.1 | 3.8 | 4.4 | 5 |
| Aminoacids mix5 | 0.4 | 0.14 | 0.3 | 0.3 | 0.5 |
| Alginic acid | 2 | 2 | 2 | 2 | 2 |
| Probiotic Mix6 | 1 | 1 | 1 | 1 | 1 |
| Cellulose | 0.8 | 0.16 | 1.6 | 1.6 | 1 |
| 100 | 100 | 100 | 100 | 100 |
1.- Soybean protein concentrate, 2.- Saccharomyces cerevisiae, 3.- Choline, DL-alpha-tocopherol, retinol, butilated hydroxytoluene, astaxanthin, ascorbic acid, biotin, inositol, folic acid, cholecalciferol, menadione, thiamine, riboflavin, niacin, pantothenic acid, pyridoxine, cobalamin, carnitine. 4.- NaH2PO4, CaCO3, KH2PO4, MgSO4-7H2O, ZnSO4-7H2O, CuSO4-7H2O, CoCl2, Na2SeO3, KI. 5.- Methionine, arginine, tryptophane. 6.- Formic, propionic, acetic and citric acid.
Table 2 Proximate chemical analysis for formulated diets with five different
carbohydrate:protein (crude protein) (CBH:CP) and same lipid:protein
(Lip:CP) ratio for L. vannamei.
Tabla 2. Análisis químico proximal de dietas formuladas
con cinco proporciones diferentes de carbohidrato:proteína (proteína
cruda) (CHO:CP) con la misma proporción lipido:proteína (Lip:CP)
para L. vannamei.
| Diet | CBH:CP (g/g) | Lip:CP (g/g) | Moisture (%) | Crude protein (%) | Crude lipids (%) | Crude fiber (%) | Ash (%) | NFE (%) | Energy (cal/g) |
|---|---|---|---|---|---|---|---|---|---|
| 0 | 1.07 | 0.2 | 6.4±0.1 | 40.4±0.2 | 8.1±0.1 | 1.0±0.1 | 7.2±0.04 | 43.3 | 4809.6±3.1 |
| 1 | 2.1 | 0.2 | 8.8±0.10 | 26.5±0.24 | 5.1±0.03 | 0.4±0.10 | 10.0±0.01 | 57.9 | 4091±0.61 |
| 2 | 1.5 | 0.2 | 11.5±0.1 | 32.7±0.1 | 6.3±0.1 | 0.6±0.00 | 10.8±0.1 | 49.6 | 4276.8±3.9 |
| 3 | 1.1 | 0.2 | 9.1±0.1 | 37.9±0.1 | 7.5±0.1 | 1.0±0.1 | 10.6±0.1 | 42.9 | 4398.1±6.1 |
| 4 | 0.8 | 0.2 | 11.2±0.1 | 42.2±0.1 | 8.5±0.03 | 1.8±0.0 | 10.34±0.1 | 37.1 | 4488.0±4.8 |
| 5 | 0.6 | 0.2 | 9.7±0.1 | 46.1±0.1 | 9.1±0.1 | 0.7±0.1 | 10.2±0.01 | 33.8 | 4608.1±1.2 |
Diet 0: Commercial Feed for First trial, diets 1-5: Experimental formulated feeds for second trial.
Second trial: Different levels of CBH:CP ratio using same DPI model
L. vannamei juveniles (2.5 ± 0.5 g) were randomly distributed in 15 experimental tanks with 60 L (12 organisms per aquarium) by triplicate. The feeding was based on the DPI mathematical function selected in the first trial. The shrimp tanks were daily siphoned to remove uneaten feed, with a weakly water exchange (40 %) and environmental conditions like the experiment mentioned above.
Statistical analysis
The following zootechnical parameters were obtained in both experiments: Weight gain (%) (WG) = ((final weight (g) - initial weight (g))*100)/ initial weight (g); Specific growth rate (%) (SGR) = 100 * (ln final weight (g) - ln initial weight (g))/days of experiment; Survival rate (%) = ((shrimp initial number - dead shrimp number)/shrimp initial number) × 100; Feed conversion ratio (FCR) = feed intake (dry matter) (g)/weight gain (g); Protein efficiency ratio (PER) = wet weight gain (g) / dry protein intake (g).
Homoscedasticity of variances and normality of data were verified by Bartlett and Shapiro Wilk´s test. The effect of DPI in the first experiment and dietary CBH:CP in the second one on zootechnical parameters was analyzed separately using one way ANOVA. Differences were considered significant at p<0.05 and were indicated to the end of the tables. Differences between means for each group (individual means) were determined using a post hoc Tukey´s HSD test.
Results
Feeding tables review
In all the shrimp feeding tables reviewed the daily ration based on biomass (%) diminish as the Body Weight increase. A greater variability in DPI was found in the feeding ratio based on Biomass percentage for shrimps with BW lower than 5 grams in all analyzed cases; from BW 5 to 12 grams most cases show similar DPI levels. Feeding tables reported for México by Quintero and Roy (2010) and for Honduras by Teichert-Coddington and Rodriguez (1995) show greater feeding ratios from 2 to 18 grams compared to other feeding tables (Figure 1).
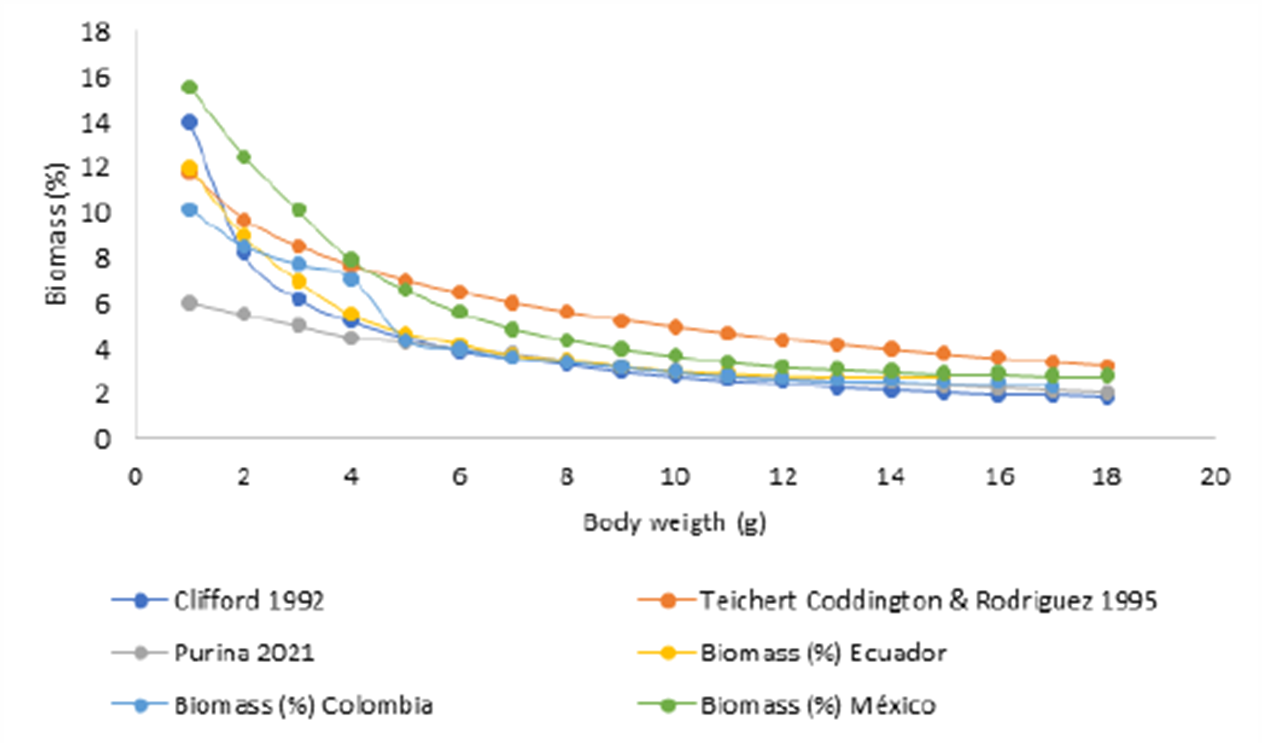
Figure 1 Feeding rates as % Biomass related to shrimp L. vannamei body weight
(g) for different cases reported by Clifford (1992) and Teichert Coddington and Rodríguez
(1995) for Honduras, Davis et al. (2006) para Nicovita, Quintero and Roy (2010) for Ecuador,
Colombia and México, Purina 2021 https://www.nutrimentospurina.com/archivos_aplicaciones/files_fkceditor/file/Acuacultura/Guia_Alimentacion.pdf
Figura 1. Tasas de alimentación en porcentaje
de biomasa en función del peso corporal (g) del camarón L.
vannamei para diferentes casos analizados que incluyen
datos reportados por; Clifford
(1992) y Teichert Coddington and Rodríguez (1995) para
Honduras, Davis et al (2006) para Quintero and Roy (2010) para Ecuador, Colombia y México,
Purina 2021 https://www.nutrimentospurina.com/archivos_aplicaciones/files_fkceditor/file/Acuacultura/Guia_Alimentacion.pdf
DPI mathematical functions related to body weight (BW)
The DPI mathematical function developed in this study from experimental data reported by Kureshy and Davis (2002) with similar protein efficiency levels, was DPI = 44.7 BW-0.714 (Figure 2).

Figure 2 Daily protein intake (g prot/kg biomass/day) mathematical function
(DPI=44.7(BW)-0.714) related to L.
vannamei Body weight (BW) in grams, obtained in this
study from experimental data reported by Kureshy and Davis (2002), using selected DPI
data for different shrimp sizes only where protein retention (%) was
similar (37.2 % in average).
Figura 2. Función matemática de la Ingesta Diaria de
Proteína (g prot/ kg biomasa /día), IDP=44.7PC-0.714, en función del
peso corporal (PC) en gramos, obtenida en este estudio a partir de
datos experimentales reportados por Kureshy and Davis (2002), utilizando datos de IDP
seleccionados para diferentes pesos corporales donde la retención de
proteína (%) fue similar (37.2 % en promedio).
Figure 3 show the DPI mathematical functions adjusted from transformed data obtained from the different feeding tables, compared with the DPI mathematical function reported in figure 2.
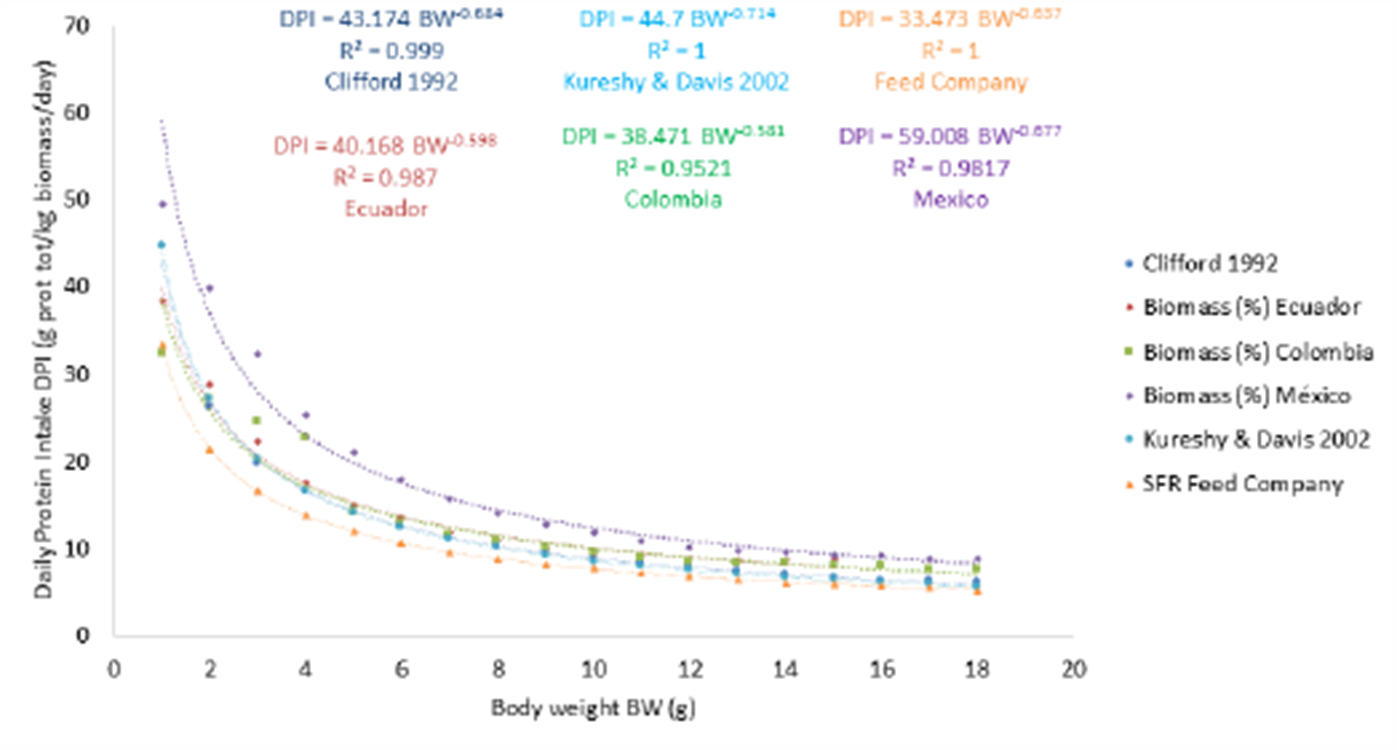
Figure 3 Daily protein intake (g prot/kg biomass/day) mathematical functions related to
L. vannamei Body weight (g) adjusted from
transformed data contained in different feeding tables based on
%Biomass related to Body Weight (Clifford 1992, Davis et al., 2006 and Quintero and Roy 2010, for
Ecuador, Colombia and México), compared with
DPI=44.7(BW)-0.74.
Figure 3. Funciones matemáticas de la ingesta diaria de
proteína (g prot/ kg biomasa/día) en función del peso corporal (g)
de L. vannamei ajustadas a partir de datos
transformados provenientes de diferentes tablas de alimentación de
%Biomasa en relación con el Peso Corporal (Clifford 1992, Davis et al 2006 y Quintero and Roy 2010 para
Ecuador, Colombia y México) comparadas con
DPI=44.7BW-0.74.
DPI mathematical functions: DPI = 65.58 BW-0.714, DPI = 53.64 BW-0.714, DPI = 44.7 BW-0.714 and DPI = 37.76 BW-0.714, corresponding to 80, 100, 120 and 140 % DPI respectively, were DPI = 44.7 BW-0.714 for L. vannamei is considered 100 %, are presented in Figure 4 and compared to the transformed DPI data obtained from feeding tables reviewed in this study.
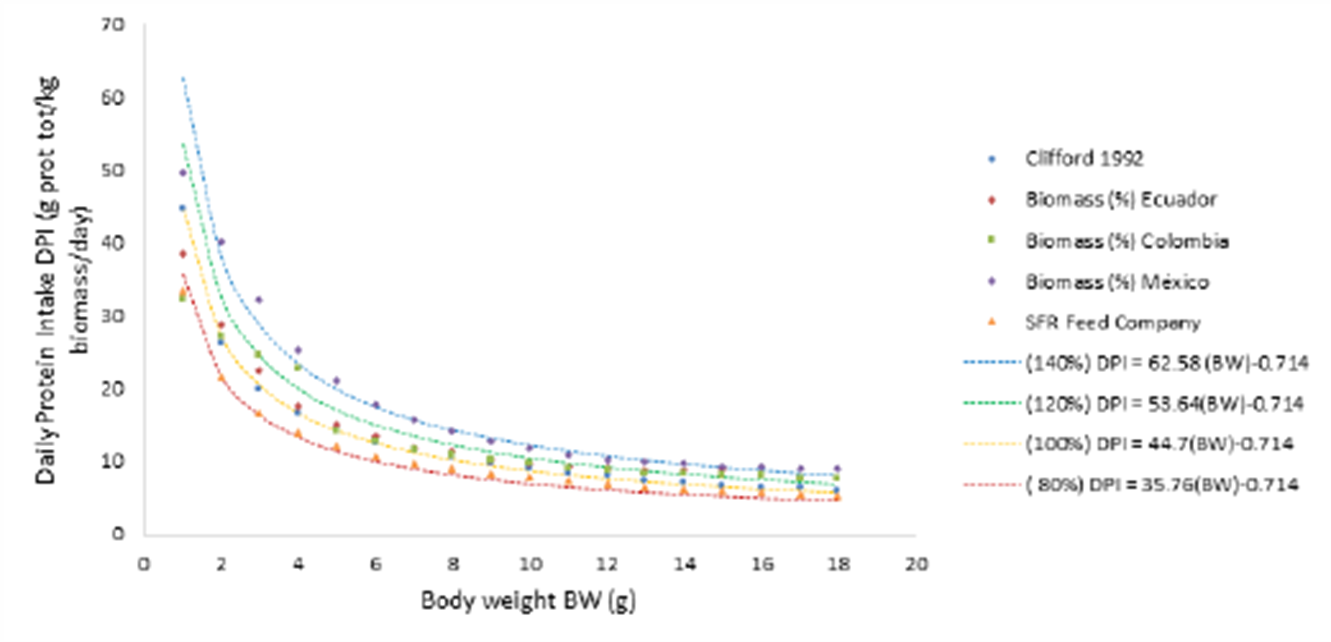
Figure 4 Daily Protein Intake (g prot/kg biomass/day) mathematical functions:
DPI=37.76(BW)-0.714, DPI=44.7(BW)-0.714, DPI=53.64(BW)-0.714 and
DPI=65.58(BW)-0.714, respectively corresponding to 80, 100, 120 and
140 % DPI=44.7(BW)-0.714 for L. vannamei, where BW is Body weight
(g), compared with DPI data calculated from different feeding tables
(%Biomass related to Body Weight).
Figura 4.
Funciones matemáticas de Ingesta Diaria de Proteína (g prot/kg
biomasa/día): IDP=37.76(PC)-0.714, IDP=44.7(PC)-0.714,
IDP=53.64(PC)-0.714 e IDP=65.58(PC)-0.714, corresponden
respectivamente a 80, 100, 120 y 140 % IDP=44.7(PC)-0.714 para L.
vannamei Donde PC es el peso corporal (g), comparadas con datos de
IDP calculados a partir de datos provenientes de diferentes tablas
de alimentación (%Biomasa con relación al Peso Corporal).
First trial: Daily protein intake (DPI)
Significant differences were found in weight gain with different DPI functions (Table 3), with organisms fed 80 and 100 % DPI showing significantly less growth than those fed 120 and 140 %. At the end of the experiment, no significant differences were found between 120 and 140 %. We found significant differences in specific growth rate, average weekly growth, feed conversion rate, protein efficiency and nitrogen retention (Table 4). The organisms fed with 80 and 140 % DPI rates showed the lowest and highest values respectively in all cases. Three homogeneous groups were found in the specific growth rate, showing significantly differences at 140 %. A higher feed conversion rate was found in treatments with 120 and 140 %. The protein efficiency ratio and nitrogen retention showed two homogeneous groups, where (120 %) DPI= 53.64 BW-0.714 was better in growth, PER and NR. No differences were found in survival rate due to DPI at any level.
Table 3 L. vannamei Weight gain (g) under laboratory conditions fed with 80,
100, 120 and 140 % (crude protein) Daily Protein Intake (DPI).
Tabla 3. Ganancia en peso (g) de L.
vannamei bajo condiciones de laboratorio alimentados
con 80, 100, 120 y 140 % (proteína cruda) de ingesta diaria de
proteína (IDP).
| Time | Daily Protein Intake (%) | |||
|---|---|---|---|---|
| (Week) | 80 | 100 | 120 | 140 |
| 1 | 0.62±0.11a | 0.62±0.01a | 0.71±0.04a | 0.79±0.17a |
| 2 | 1.24±0.07a | 1.31±0.06ab | 1.53±0.07b | 1.73±0.18c |
| 3 | 3.03±0.10a | 3.08±0.06ab | 3.39±0.15b | 3.79±0.21c |
| 4 | 3.77±0.19a | 4.02±0.08a | 4.58±0.21b | 5.00±0.30b |
| 5 | 3.84±0.16a | 4.3±0.18a | 5.01±0.28b | 5.60±0.37b |
Table 4 Performance of L. vannamei under laboratory conditions fed with 80,
100, 120 and 140 % (crude protein) Daily Protein Intake (DPI).
Tabla 4. Desempeño de L.
vannamei en condiciones de laboratorio alimentados con
80, 100, 120 y 140 % (proteína cruda) de Ingesta Diaria de Proteína
(IDP).
| Daily Protein Intake (%DPI) | ||||
|---|---|---|---|---|
| 80 | 100 | 120 | 140 | |
| WG (%) | 481.14±13.98a | 526.34±6.87ab | 602.55±34.10bc | 636.81±61c |
| SGR (%) | 3.14±0.06ab | 3.32±0.03ab | 3.59±0.11bc | 3.7±0.20c |
| AWG (g) | 0.76±0.03a | 0.85±0.36a | 1.00±0.5b | 1.12±0.07b |
| S (%) | 95.83±4.81a | 88.8±4.81a | 97.2±4.81a | 94.4±4.81a |
| FCR | 1.12±0.02a | 1.26±0.03ab | 1.32±0.07b | 1.41±0.09b |
| PER | 2.37±0.12a | 2.09±0.1b | 2.01±0.05b | 1.89±0.05b |
| NR | 40.45±0.90a | 35.76±0.03b | 34.38±1.92b | 32.26±2.09b |
WG=Weight gain, SGR=Specific growth rate, AWG=Average weekly growth, S=Survival rate, FCR=Feeding conversion ratio, PER=Protein efficiency ratio. C:N ratio of diet=7.98.
Second trial: Bioassay with five CBH:CP ratios using same DPI level and Lip:CP ratio
We found a significant effect by CBH:CP ratio on weight gain, specific growth rate, feed conversion rate, protein efficiency ratio and nitrogen retention (Table 5). No significant differences were found in the survival rate. Significant differences were observed between treatments with 2.1 and 1.5 compared to the rest CBH:CP ratios. The specific growth rate also presented significant differences between treatments, with higher values in 2.1 and 1.5 CBH:CP. The feed conversion rate and protein efficiency ratio showed the highest values at the highest levels of CBH:CP (2.1 and 1.5). The weekly average growth showed an effect by Carbohydrate:Crude protein rate, with higher values in 2.1, 1.5 and 1.1 CBH:CP. Nitrogen retention was statistically higher in 2.1 and lower in 0.6 CBH:CP respectively. Survival rate was not affected by CBH:CP ratios.
Table 5 Performance of L. vannamei cultured in laboratory with five
experimental diets with different CBH:CP ratios and same Lip:CP
ratio (crude protein).
Tabla 5. Desempeño de L. vannamei
cultivado en laboratorio con cinco dietas experimentales con cinco
proporciones diferentes CHO:CP y una proporción Lip:CP (proteína
cruda)
| CBH:P | Lip/P | C:N | WG | SGR | AWG | S | FCR | PER | NR |
|---|---|---|---|---|---|---|---|---|---|
| (g/g) | (g/g) | (%) | (%.day-1) | (g) | (%) | ||||
| 2.1 | 0.2 | 12.15 | 323.3±15.7a | 2.3± 0.10 a | 1.27± 0.12 a | 86.5±5.8a | 2.25± 0.08 a | 1.84± 0.07 a | 30.65± 1.93 a |
| 1.5 | 0.2 | 9.87 | 297.4±7.6ab | 2.2±0.10ab | 1.14±0.06ab | 94.4±2.8a | 2.16±0.04ab | 1.60± 0.03 b | 25.87± 0.78 b |
| 1.1 | 0.2 | 8.51 | 267.0± 1.5 b | 2.0± 0.10 b | 1.14± 0.19 b | 89.5±6.7a | 2.07±0.01ab | 1.40±0.001bc | 23.33±0.13bc |
| 0.8 | 0.2 | 7.64 | 269.0± 9.7 b | 2.0± 0.10 b | 1.22±0.12ab | 92.3±7.7a | 1.95± 0.08 b | 1.37± 0.06 c | 22.28± 1.67 c |
| 0.6 | 0.2 | 7.00 | 285.3±5.2ab | 2.1±0.03ab | 1.04± 0.05 b | 89.3±2.3a | 1.66± 0.02 c | 1.45±0.02bc | 23.91±0.58bc |
WG=Weight gain, SGR=Specific growth rate, AWG=Average weekly growth, S=Survival rate, FCR=Feeding conversion ratio, PER=Protein efficiency ratio. C:N ratio of diet=7.98
Discussion
The review of the feeding tables shows great variability in %Biomass for Shrimp BW lower than 5 grams (Figure 1), mainly due to the variability in the protein content (level or percentage) in feeds recommended for small shrimps. In this sense, feeding tables not necessarily represent the real amount of protein provided to the aquaculture system, since they are not related with the protein content in feeds. When different protein levels in feeds are tested (25-45 % CP), the use of feeding tables as a protocol to feed the shrimps, with same feeding ratio based on % Biomass and BW, implicitly provide different amounts of protein according to the feed protein level (%), generating differences not necessarily due to the protein level, but the real amount of protein provided for shrimps. Kureshy and Davis (2002), using the same approach, tested different amounts of protein (g protein/kg shrimp biomass/day) as DPI for different shrimp BW and found a growth rate increase related to DPI increase, but also found an increase in Protein Efficiency (PE) from lower to medium DPI, but a decrease in PE at greater amount of DPI. Therefore, the maximum growth at high DPI have consequences in lowering PE and Nitrogen retention (NR), with side effects on nitrogen residuals in the aquaculture environment.
For this reason, in this study, we select the DPI data provided by Kureshy and Davis (2002), for different BWs with the better Protein retention (37.2 % in average) to adjust the mathematical model DPI=44.7(BW)-0.714 (Figure 2). Using this mathematical model, we adjust the transformed data provided by the feeding tables from different sources and found not only high correlation (>0.9501), but surprisingly a similar trend between the adjusted DPI model obtained in this study from data reported by Kureshy and Davis (2002), compared to the DPI adjusted from Clifford (1992) data, recommended by relevant shrimp feed companies like Nicovita and Purina (Figure 3). The four different variants in DPI mathematical functions (DPI=37.76(BW)-0.714, DPI=44.7(BW)-0.714, DPI=53.64(BW)-0.714, and DPI=65.58(BW)-0.714), respectively corresponding to 80, 100, 120 and 140 % DPI=44.7(BW)-0.714 for L. vannamei, cover and represent the different DPI data calculated from the feeding tables reviewed in this study (Clifford, 1992; Kureshy and Davis, 2002; Davis et al., 2006; Quintero and Roy, 2010). For this reason were used to select the DPI mathematical model to evaluate the different Carbohydrate:Crude Protein ratios with same DPI and shrimp BW (Figure 4).
We observed that variations in DPI levels using the same protein and CBH:CP ratios have a direct effect on growth, PER and NR, showing a linear increase in all growth parameters with DPI. In survival, this trend was not observed. A variation of the optimal protein requirements of L. vannamei from 20 to 45 % has been reported (Kureshy and Davis, 2002, Hu et al., 2008; Yaemssoksawat et al., 2008; Sui et al., 2015, Lee and Lee, 2018), where these variations are influenced by the stocking density and aquaculture system (Brito et al., 2001). Xia et al. (2010) reported that adequate protein values in diet under high-density conditions, in the absence of natural productivity, must be at least 43 %, results in a linear growth as protein increases with a slight decrease at higher percentages. Similarly, Jang et al. (2014) found a greater weight gain and specific growth rate feeding with 40 and 45 % protein, not having significant differences between them, and suggesting that values higher than 40 % are not necessary.
In the experiments with variants of the DPI mathematical model, we find an increase in growth parameters and feed conversion rates, but a decrease in protein efficiency and nitrogen retention with the increase in DPI level. Although no significant differences were found between the highest DPI (120 % and 140 %), in terms of growth parameters and nitrogen retention, these results suggest that the change in the feed protein levels must be adjusted by DPI mathematical functions to compare feeds with different formulas or CBH:CP ratios. In this study, a decrease in protein efficiency and nitrogen retention was found with the increase in DPI at similar levels of protein content and CBH:CP ratio, suggesting that the rest of the energy substrates in the diet provided favor the adequate use of this.
Regarding DPI, the levels used agree with the daily protein level required by L. vannamei determined by Kureshy and Davies (2002), Clifford (1992) and Tacon (2002), as well as the recommendations by relevant shrimp feed companies such as Nicovita (Clifford, 1992) and Purina (2021). In addition, the flexibility in the mathematical model may favor their adjustment to obtain better performance of the different aquaculture systems in economic and environmental terms, also testing different genetic linages and proportionality between different ingredients and protein.
Modern aquaculture requires maximum growth with a reduction in protein intake and nitrogen residuals. The protein in the diet can be reduced if the energy required comes from another source such as carbohydrates, which can reduce the emission of residual nutrients and feed costs (Zainuddin et al., 2014). The results obtained in this study shows that increasing the proportion of carbohydrates/protein in feeds, with the same DPI mathematical model that meets the requirements of the organisms, will significantly favor the performance of the system without cost in survival. Carbohydrates can provide important energy content and can be used by shrimp for the synthesis of chitin, however, their ability to use them is limited, due to their low capacity to digest and regulate plasma glucose concentrations (Guo et al., 2006).
It has been observed that the best performance is at levels around 40 %. Zainuddin et al. (2014) determined the best growth for L. vannamei with 38 % carbohydrates compared to lower levels, suggesting that high carbohydrates levels can be used if it is fed with a high frequency in small amounts, which favors the use of carbohydrates and increases fat reserves with a more efficient lipogenesis process. Pascual et al. (2004) found better immunological performance with high carbohydrates levels, determining that these can favor the functioning of the organisms feeding appropriately. In this sense, we observed that by supplying the same DPI and Lip:CP ratio, the differential contribution of carbohydrates increasing CBH:CP ratio to 2:1 has a significant effect on growth, protein efficiency and nitrogen retention without cost in survival.
Conclusion
Feeding based on DPI=53.64(BW)-0.714 corresponding to 120 % DPI=44.7(BW)-0.714, is sufficient to achieve optimal growth of L. vannamei juveniles, at least within a range of 2 to 8 g in clear water systems without natural productivity. DPI mathematical model show elasticity to adapt to different shrimp feed management scenarios and can be used to evaluate feed formulations in the context of genetic linages. A significant effect on weight gain, specific growth rate, feed conversion rate, protein efficiency and nitrogen retention were found due to DPI levels and CBH:CP ratios. Growth parameters and feed conversion rates increase in both cases, but protein efficiency and nitrogen retention diminish with DPI levels using feeds with similar protein level and CBH:CP ratio and increases with CBH:CP ratios at same DPI level using feeds with low fishmeal content, with potential benefits to decrease risks of contamination and eutrophication. Satisfying the protein needs of the organisms, it allows the use of CBH:CP ratios to maximize the use of protein in feeds and performance of the aquaculture system without complications, such as decreases growth and mortality or environmental impacts like pond or ecosystem eutrophication.

