


Serviços Personalizados
Journal
Artigo
 Inglês (pdf)
 Artigo em XML
 Referências do artigo
 Enviar este artigo por email
Indicadores
-
 Citado por SciELO
 -
 Acessos
Links relacionados
-
 Similares em
SciELO
Similares em
SciELO
Compartilhar

 Permalink
Revista mexicana de ingeniería biomédica
versão On-line ISSN 2395-9126versão impressa ISSN 0188-9532
Rev. mex. ing. bioméd vol.32 no.1 México Jul. 2011
Artículo de investigación original
A multiple-filter-GA-SVM method for dimension reduction and classification of DNA-microarray data
Hernández Montiel L.A.*, Bonilla Huerta E.*, Morales Caporal R.*
* Laboratorio de Investigación en Tecnologías Inteligentes. Instituto Tecnológico de Apizaco.
Correspondence:
L.A. Hernández Montiel.
Av. Instituto Tecnológico s/n.
90300. Apizaco, Tlaxcala, México.
{edbonn, luisahm, morales-caporal}@ita-pizaco.edu.mx
Received article: 18/march/2011.
Accepted article: 30/may/2011.
ABSTRACT
The following article proposes a Multiple-Filter by using a genetic algorithm (GA) combined with a support vector machine (SVM) for gene selection and classification of DNA microarray data. The proposed method is designed to select a subset of relevant genes that classify the DNA-microarray data more accurately. First, three traditional statistical methods are used for gene selection. Then different relevant gene subsets are selected by using a GA/SVM framework using leave-one-out cross validation (LOOCV) to avoid data overfitting. A gene subset (niche), consisting of relevant genes, is obtained from each statistical method, by analyzing the frequency of each gene in the different gene subsets. Finally, the most frequent genes contained in the niche, are evaluated by the GA/ SVM to obtain a final relevant gene subset. The proposed method is tested in two DNA-microarray datasets: Leukemia and colon. In the experimental results it is observed that the Multiple-Filter-GA-SVM (MF-GA-SVM) work very well by achieving lower classification error rates using a smaller number of selected genes than other methods reported in the literature.
Key Words: DNA-microarrays, filters, wrappers, genetic algorithm, support vector machine, gene selection.
RESUMEN
El presente trabajo propone un múltiple-filtro utilizando un algoritmo genético (AG) combinado con una máquina de soporte vectorial (MSV) para la selección de genes y la clasificación de datos obtenidos de micro-arreglos de ADN. El método propuesto es diseñado para seleccionar un sub-conjunto de genes pertinentes que clasifiquen los datos obtenidos de micro-arreglos de ADN más eficientemente. Primero, tres métodos estadísticos tradicionales son usados para la selección de genes. Luego, diferentes sub-conjuntos de genes pertinentes son seleccionado spor medio de una estructura AG-MSV utilizando la técnica deja uno fuera de validación cruzada (DUFVC) para evitar el sobre-entrenamiento de los datos. Un sub-conjunto de genes (nicho), que consiste de genes pertinentes, es obtenido de cada método estadístico, al cual analiza la frecuencia de cada gen en diferentes sub-conjuntos de genes. Finalmente, los genes más frecuentes contenidos en el nicho son nuevamente evaluados por la estructura AG-MSV para obtener a sub-conjunto final de genes pertinentes. El método propuesto es evaluado en dos bases de micro-arreglos: Leucemia y colon. En los resultados experimentales se observa que el múltiple-filtro-AG-MSV trabajo muy bien logrando bajas tasas de error en la clasificación usando un número pequeño de genes más que otros métodos reportados en la literatura.
Palabras clave: Micro-arreglos de ADN, filtros, envoltorios, algoritmos genéticos, máquina de soporte vectorial, selección de genes.
INTRODUCTION
DNA microarray technology allows to measure simultaneous the activity of tens of thousands of genes in a cell mixture. A great number of classification methods have been proposed for analyzing microarray data1-5. In order to extract useful gene information from cancer microarray data and reduce dimensionality, we propose a hybrid model that combines a genetic algorithm (GA) for gene selection, and a support vector machine (SVM) for classification. We propose this model to find subset of genes with higher classification accuracy in two microarray datasets: Leukemia and Colon. This paper is organized as follows. An introduction of microarray technology is shown in section 2. In section 3 some preliminaries on statistical methods (filters) is presented. In section 4 the MRGASVM model is described. In section 4, a detailed description of Genetic Algorithms and Support Vector Machines are given. Section 5 provides an analysis of the experimental results and finally conclusions are drawn in section 6.
DNA MICROARRAY TECHNOLOGY
DNA microarray technology was first published in 1995 by M. Schena et al6. Typically a microarray (sometimes called DNA chip) is a glass or plastic slide, on to which DNA molecules are attached at fixed spots. There tens of thousands of spots on an array. For gene expression studies, each spots ideally should identify one gene in the genome. Microarray technology allows biologists and researchers to measure the expression of thousands of genes simultaneously on a single chip.
This technology is based on the process of hybridization. The chip is arrangedinaregulargrid-like pattern and segments of DNA strands are either deposited within individual grids. Figure 1 shows the basic principles of DNA microarray experiment. The procedure of a DNA microarray experiment includes several steps from sample preparation to data analysis.
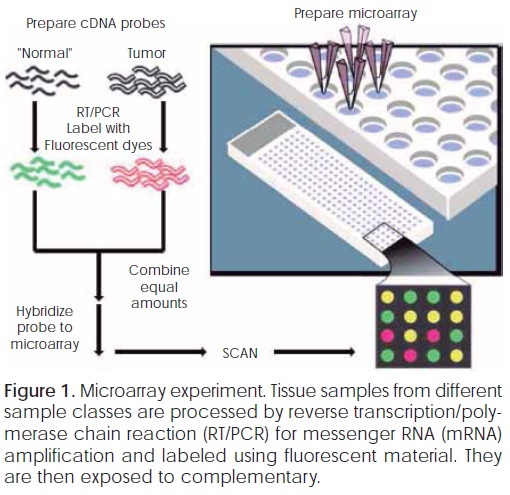
DNA (cDNA) chip for hybridization. Resulting chip is then scanned and processed to produce a two dimensional numerical array of microarray gene expression data that is used by data analysis algorithms.
A microarray experiment involves three basic steps: 1) sample preparation and labeling, 2) hybridization and washing and 3) microarray image scanning and processing.
In first step, a microarray experiment involves sample preparation and labeling. DNA or RNA is isolated from both samples (Normal/tumor, Treated cells/control cells), transformed and labeled with fluorophores.
Hybridization and washing are the second step involve into a microarray experiment. The Hybridization is the process of joining two complementary strands of DNA to form a double helix molecule. The labeled cDNA are mixed together to the slice at a specific temperature to allow complementary sequences to anneal. Finally, the slices are washed to remove contaminants.
After the third step (scanning and processing), microarray experiment produces a two dimensional array of numbers. Columns indicate genes and rows indicate samples as shown in Figure 2. Each column is the expression levels of all genes of one sample in the microarray experiment. Each row is the expression levels of one gene across different sample tissues.

One particularity of microarray data is their great number of attributes (genes) whereas very few samples are available. This dimensionality problem makes the data difficult to understand and reduces the efficiency of classification algorithms. One of the key tasks of microarray data is to perform classification through different expression profiles. For a more detailed description of microarray gene expression experiment, please refer to7-9.
METHODOLOGY
This work proposes a new method to reduce the initial dimension of microarray datasets and to select relevant gene subset for classification. First, three statistical filters (BSS/WSS, Wilcoxon test and T-statistic) are proposed to filter relevant genes. Then the problem of gene selection is treated by a GA-SVM approach that selects a relevant gene subset for SVM classifier.
Pre-processing by min-max normalization
The pre-processing procedureisaveryimportant task in gene selection and classification. In this process the noisy, irrelevant and inconsistent data are been eliminated. We normalize the gene expression levels of each dataset into interval [0,1] using the minimum and maximum expression values of each gene. Due to the small size of training set for leukemia and tumor colon dataset, leave-one-out cross validation (LOOCV) is utilized to select the training and testing set respectively.
Data filtering
Filters or filtering techniques reduce the dimension of a dataset and to filter the most relevant or informative genes to enhance the generalization performance. In this work three types of filters are proposed to make the reduction of the databases of colon cancer1 and leukemia3. The three filters are BSS/WSS, Wilcoxon test and T-Statistic test (described below).
A) BSS/WSS
We use the gene selection filter proposed by Dudoit10, namely the ratio of the sums of squares between groups (Between Sum Square-BSS) and within groups (Within Sum Square-WSS). This ratio compares the distance of the center of each class to the over-all center to the distance of each gene to its class. The equation for a given gene j has the form:

Where y denotes the subclass label of gene i,  denotes the average expression level of gene j across all samples and
  denotes the average expression level of gene j belonging to subclass k = 1 and k = 2. In this work the top-p genes ranked by BSS/WSS are selected.
B) Wilcoxon rank sum test
Wilcoxon rank sum test (denoted W) is a non-parametric criterion used for feature selection. This filter is the sum of ranks of the samples in the smaller class. The main steps of this filters are defined as follows11:
1. Combine all observations from the two populations and rank them in value ascending order. If some observation have tied values, is assigned each observation in a tie their average rank.
2. Add all the ranks associated with the observations from the smaller group. This gives W.
3. The p-value associated with the Wilcoxon statistic is found from the Wilcoxon rank sum distribution table. In this case this statistic is obtained from Matlab.
C) T-Statistic
The standard t-statistic is the most extensively used criterion proposed to identify differentially expressed genes. Each sample is labeled into interval {1, -1}. For each feature fj, the mean is µ1j and µ-1j, standard deviation δ1i and δ-1i are calculated using only the samples labeled 1 and -1 respectively. Then a score Tfj can be obtained by9:

Where and n2 are the number of samples labeled as 1 and -1 respectively. Large absolute t-statistic indicates the most discriminatory features (genes).
GENERAL MODEL MFGASVM FOR GENE SELECTION AND CLASSIFICATION
In this section, we introduce the proposed a Multiple-Filter-Wrapper for gene selection and classification of DNA-microarray datasets which is depicted in Figure 2. In the first step, a statistic filtering/ranking method is applied to rank genes. That is means that each gene is evaluated and ranked according a statistical filter. Three filters are proposed in this work (Wilcoxon test, BSS/WSS and t-statistical). Thus, the first p (50) genes with the highest top ranking score are selected. In second step, for each p selected genes, a selective gene selection is performed by using a GA/SVM method (details of the GA/SVM have been described in section 6). For each filter, is executed the GA/SVM method, thus gene subsets having a high performance given by the SVM classifier are conserved into a niche.
After, from niche was selected the genes having the highest frequency and a new execution of the GA/SVM method is realized to obtain a final gene subset (Figure 3). Multiple-Filter-GA-SVM is proposed to reduce the dimensionality of DNA-microarray datasets, to improve the classification accuracy by using a multiple-filter-GA/SVM and to obtain a good candidate gene subset for classification.

GENE SELECTION AND CLASSIFICATION BY USING A GA-SVM METHOD
In this study a multiple-filter-GA/SVM method is proposed to handle gene selection and classification of DNA-microarray datasets. The selection of genes of the databases is achieved by a genetic algorithm (GA), which was created to select the best gene that exists within the base. For the classification of genes we use a Support Vector Machine (SVM). This classifier is used to evaluate the best gene in their fitness function.
Genetic algorithm
Genetic algorithms (GA's) are adaptive methods that can be used to solve optimization problems12. GA's are stochastic search algorithms based in the process of natural selection. GA's evolves a population of individuals where each individual represents a candidate solution for a given problem. A fitness function is defined to evaluate the quality of each candidate solution. Finally genetic operators are specified in this evolutionary process13.
In this study, to obtain a new population from the current population P we apply genetic operators as follows: a) selecting two parents and implement (with a given probability) the crossover to create two new solutions and they are muted (with a given probability), and b) replace parents by their descendants (offspring). These two actions are repeated for a predetermined number of times (number of generations). Finally, the elite chromosomes (with a given probability) are copied into population P to replace the worst chromosomes. At this point, a generation is accomplished. Figure 4 shows the overall operations for the AG.

Chromosome representation and population initialization
A chromosome is used to represent a candidate gene subset. A chromosome is a binary string of length equal to the number of selected genes obtained by the filter method. Thus, each bit encodes a single gene. If a bit is '1' means that this gene is stored in the gene subset whether it is a '0' indicates that the gene is excluded from gene subset. The length of the chromosome is denoted in this article as I. The initial population is generated randomly following a uniform distribution. Figure 5 shows the representation of a chromosome.

The fitness function
The fitness function of a chromosome affects directly the performance of the GA. In this case, a SVM classifier provides the accuracy classification of each chromosome as follows:

Where x is a candidate subset and accuracySVM is the classification accuracy that SVM built on x.
Selection, crossover, mutation, replacement and stopping criteria
In this work, a selection mechanism based on the roulette wheel is proposed. For crossover operator, is used the multi-uniform point crossover (Pc). For mutation, each chromosome has a low probability to mutate (Pm). A mechanism of elitism is also applied to conserve the top 10 or 15% of the population. Finally the stopping criteria, is a predefined number of generations.
Support vector machine (SVM)
SVM is a powerful data mining technique developed by Vapnik in the mid-1960s. It has been applied for many applications in classification and regression14,15. Recently SVM have been successfully applied in diverse fields of applicationsuch asfraud detection, direct marketing, text mining and recently to deal with high-dimensional data such as gene expression in bioinformatics.
The mathematical basis for SVM is derived from statistical learning theory. The training set is supposed to be a finite set of N data/class pairs defined as follows:


Where  (data) and yi ∈{±1}(classes). The SVM projects x to z = φ(x) in a Hilbert Space H by a nonlinear map
If we assume that the data are linearly separable, i.e., that there exist  such that:

For a given linear classifier  , consider the hyperplane defined by the values -1 and +1 of the decision function:
Indeed, the points  satisfy the follow condition:

By subtracting we get:  , and therefore:

Where  is the margin obtained from the largest separating hyperplane. All training points should be on the right side of the dotted line from the Figure 2. From positive examples (yi=1) this means:
  and for the negative examples (yi=-1)thismeans
  both cases are summarized as follows:

Finally, an optimal separation can be achieved by the hyperplane that has the greatest distance to the neighbouring data points of both classes (optimal hyperplane). For this is necessary to find:  which minimize:
  under the constraint:

This problem can be reduced to a quadratic programming problem. More details about how the problem is solved please refer to15.
In this work a SVM classifier is utilized to assess the quality (accuracy) of a subset of genes. To avoid the data overfitting SVM error estimation is used by using leave-one-out cross-validation (LOOCV).
EXPERIMENTAL SETUP AND RESULTS
A. Datasets used
In this study, we analyze two well-know public microarray datasets obtained from Affymetrix oligonucleotide microarrays, which are Colon cancer and Leukemia dataset. These two microarray datasets have been widely used as benchmark sets in many supervised learning techniques in bioinformatics.
Colon cancer data: This dataset consists of 62 samples (tissues) collected from colon cancer patients (40 tumor samples and 22 normal samples) for 6,500 human genes are measured using the Affymetrix technology. A selection of 2,000 genes with highest minimal intensity across the samples has been made Alon et al1. This dataset can be downloaded from the website: http://genomicspubs.princeton.edu/oncology/affydata/index.html.
Leukemia dataset: This dataset described by Golub et al3 is used for classification. The biology task is to identify two types of leukemia: Acute lymphoblastic leukaemia (ALL) and acute myeloid leukaemia (AML). Leukemia data set includes expression levels for 7,129 DNA human genes produced by Affymetrix technology of 72 patients (47 ALL samples and 25 AML samples). Tissues samples were collected at time of diagnosis before treatment, taken either form bone marrow (62 cases), or peripheral blood (10 cases) and reflect both childhood and adult leukemia. As in the original paper the data was divided into a training set of 39 samples (27 are ALL and 11 AML) and a test set of 34 samples (20 ALL and 14 AML). This dataset has been obtained directly from the website: www.broadinstitute.9org/cgibin/cancer/publications/pub_paper.cgi?mode=view&paper_id = 43.
B. Genetic algorithm parameters
The genetic algorithm is implemented in matlab (version 7.6.0) for the SVM used the same toolbox of matlab. The parameters for the genetic algorithm are shown in Table 1.

C. Experimental results
In the experimental protocol, DNA-microarray data is obtained through the combination of three filtering methods, which are evaluated separately by the AG/SVM framework. Gene subsets are obtained from each stage are added into a file (niche), to assess their frequency. A new stage is done with the most common genes which are re-evaluated by the GA/ SVM to obtain a final gene subset. The method we use is compared with several results from different works reported in the literature.
Table 2 summarizes the best accuracies obtained by the MF-AGSVM method. The first column indicates a work reported in the literature. Second and Third column shown the accuracy obtained for leukemia and colon cancer dataset respectively. Each cell contains the classification accuracy and the minimal gene subset.

The genetic algorithm is run 10 times which gives a yield of 98.61% for leukemia with only 10 genes. In contrast a performance of 98.38% is obtained for colon with 10 genes.
Finally, the top five selected genes found for each dataset are shown in Tables 3 and 4. For the Leukemia dataset, the top gene is APLP2 Amyloid beta (Table 3). In contrast for the colon dataset the most relevant gene is Human desmin gene, complete cds (Table 4). It is observed in the two datasets that all genes have been reported in the literature.
CONCLUSIONS
In this paper, a multiple-filter-GA/SVM method was presented for selecting a final gene subset with high accuracy classification. Three filtering methods are proposed to make an initial reduction in the size of the database to the wrapper is using a hybrid model based on a genetic algorithm combined with a SVM classifier. The proposed method determines a smaller subset of genes with an accuracy of 98.61 to 98.38% for leukemia and colon respectively. The number of genes found with the proposed model is equal or slightly smaller subsets found in different literatures, which are shown in Table 2. The goal is to achieve 100% classification with a smaller set of genes.
In this paper, the selectionofagenesubsetfor cancer classification has been done using a Wrapper GA/SVM by using a combination of three feature ranking filters. The databases we use have a very large scale, is why it is impossible to select the best data for evaluation, and also have data with different numerical scales, this problem not generate a good selection of features, therefore we cannot find best genes to be evaluated, the system was tested using two databases, which we showed a great effectiveness in the selection of genes, since the test performed while leave-one-out cross-validation (LOOCV), gives better classification performance of the selected data.
This approach can be further improved on several aspects. One way, involves finding gene subsets with higher classification and a small size. Other way is to include a multiple criteria or multi-objective criteria. In future, it is possible to incorporate more gene selection filters such as: Mutual information or minimal redundancy-maximal relevancy method.
ACKNOWLEDGEMENTS
This work is carried out within the PROMEP projet ITAPI-EXB-000.
REFERENCES
1. Alon U, Barkai N, Notterman DA, Gish K, Ybarra S, Mack D et al. Broad patterns of gene expression revealed by clustering analysis of tumor and normal colon tissues probed by oligonucleotide arrays. In: PNAS. USA. National Academy of Sciences. 1999: 6745-6750. [ Links ]
2. Ben-Dor L, Bruhn N, Friedman I, Nachman M, Schummer, Yakhini Z. Tissue classification with gene expression profiles. In: RECOMB, Journal of Computational Biology 2000: 54-64. [ Links ]
3. Golub TR, Slonim DK, Tamayo P, Huard C, Gaasenbeek M, Mesirov JP et al. Molecular classification of cancer: Class discovery and class prediction by gene expression monitoring. Science 1999; 286: 531-537. [ Links ]
4. Alizadeh A, Eisen M, Davis R, Ma C, Lossos I, Rosenwald A et al. Distinct types of diffuse large B-cell lymphoma identified by gene expression profiling. Nature 2000; 403(6769): 503-11. [ Links ]
5. Shipp M, Ross K, Tamayo P, Weng A, Kutok J, Aguiar R et al. Diffuse large B-cell lymphoma outcome prediction by gene expression profiling and supervised machine learning. Nat Med 2002: 68-74. [ Links ]
6. Schena M, Shalon D, Davis R, Brown P Quantitative monitoring of gene expression patterns with a complementary DNA microarray. Science 1995; 270: 467-470. [ Links ]
7. Bobashev GV, Das S, Das A. Experimental design for gene microarray experiment and differential expression analyses. Methods of Microarray Data Analysis II 2001: 23-41. [ Links ]
8. Geoffrey J, Kim-Anh D, Ambroise C. Analyzing microarray gene expression data. Wiley. 2004. [ Links ]
9. Rusell S, Meadows LA, Rusell RR. Microarray technology in practice. Academic Press. First edition. 2009. [ Links ]
10. Dudoit S, Fridlyand J, Speed TP Comparison of discrimination methods for the classification of tumors using gene expression data. Journal of the American Statistical, 2002; 97(457): 77-87. [ Links ]
11. Deng L, Pei J, Ma J, Lee DL. Rank sum test method for informative gene discovery. Proceedings of the 10th ACM SIGKDD International Conference on Knowledge Discovery and Data Mining (KDD'04), 2004: 410-419. [ Links ]
12. Liu H, Li J, Wong L. A comparative study on feature selection and classification methods using gene expression profiles and proteomic patterns. Genome Informatics 2002; 13: 51-60. [ Links ]
13. Melani M. An introduction to genetic algorithms. MIT Press (Cambridge, Massachusetts • London, England), 1999.
14. Burges CJC. A tutorial on support vector machines for pattern recognition. Data Mining and Knowledge Discovery 1998; 2(2): 121-167. [ Links ]
15. Joachims T. Making large-scale SVM learning practical. Advances in kernel methods-support vector learning. B. Schokopt et al. (editors), MIT Press, 1999. [ Links ]
16. Cho SB, Won HH. Cancer classification using ensemble of neural networks with multiple significant gene subsets. Applied Intelligence 2007; 26(3): 243-250. [ Links ]
17. Li S, Wu X, Hu X. Gene selection using genetic algorithm and support vectors machines. Soft Comput 2008; 12(7): 693-698. [ Links ]
18. Alba E, García-Nieto J, Jourdan L, Talbi EG. Gene selection in cancer classification using PSO/SVM and GA/SVM hybrid algorithms. Congress on Evolutionary Computation 2007: 284-290. [ Links ]
19. Krishnapuram B, Carin L, Hartemink AJ. Joint classifier and feature optimization for comprehensive cancer diagnosis using gene expression data. Journal Computer Biology 2004; 11(2-3): 227-242. [ Links ]
20. Xu R, Anagnostopoulos JC, Wunsch DC. Tissue classification trough analysis of gene expression data using a new family of art aechitectures. Proceedings of the IEEE-INNS-ENNS International Joint Conference on Neural Networks, 2002: 300-304. [ Links ]
21. Li X, Rao S, Zhang T, Guo Z, Moser KL, Topol EJ et al. An ensemble method for gene discovery based on DNA microarray data. Ser C Life Sciences 2004: 396-405. [ Links ]
22. Zhang H, Song X, Wang H, Zhang X. MIClique: an algorithm to Identify Differentially Co-expressed disease gene subsets from microarray data. Journal of Biomedicine and Biotechnology 2009: 9. [ Links ]
23. Cho SB. Exploring features and classifiers to classify gene expression profiles of acute leukemia. International Journal of Pattern Recognition and Artificial Intelligence 2002: 831-844. [ Links ]
Nota
Este artículo también puede ser consultado en versión completa en: http://www.medigraphic.com/ingenieriabiomedica/

