


 nova página do texto(beta)
 Inglês (pdf)
 Artigo em XML
 Referências do artigo
 Enviar este artigo por email
 Citado por SciELO
  Similares em
SciELO
Similares em
SciELO 
 Permalink
1. Introduction
The Metropolitan Area of Monterrey (AMM, Spanish acronym), located in the state of Nuevo León, is one of the three most important metropolitan areas of Mexico. It is a first-class industrial city and a driving force of economic growth for all the country and in particular for the northeast region (Aguilar-Barajas et al., 2015). The AMM is located in a semi-desert region with scarce availability of natural water; therefore access to this resource has been a matter of vital importance throughout its history. It is certain that water availability will continue to be a fundamental issue for the future development of the metropolis, especially given the continuous population and economic growth that has been predicted for the AMM (Aguilar-Barajas et al., 2015). Given the economic relevance of Monterrey, adequate and timely attention to water supply is of regional and national interest (Huerta, 2015).
In December 2014, a water flow of 11 m3 s-1 was supplied to the AMM, 60 % coming from surface sources and the remaining 40 % from underground sources. The surface sources of water include three dams: La Boca, Cerro Prieto and El Cuchillo, which were integrated into the supply system of the AMM in 1965, 1984 and 1994, respectively (Aguilar-Barajas et al., 2015). The combined water storage capacity of these three dams is 2219 Mm3, of which more than 75% correspond to El Cuchillo (CONAGUA, 2014).
Usually, managers of large municipal water distribution systems want to increase the reliability of the system and reduce operational costs (Lefkoff and Kendall, 1997). Ingol-Blanco and McKinney (2011) consider that water problems in the Conchos River watershed, very close to the San Juan River watershed in the State of Nuevo León, are characterized by recurrent long drought periods, increasing water demands, and low efficiencies; consequently, significant deficits are experienced, not only in the water system, but also in water delivery to USA as established by the US-Mexico 1944 treaty (Ingol-Blanco and McKinney, 2011). These authors also consider that any climate change scenario would exacerbate the competition for water resources between the USA and Mexico. The results of their investigation show that under climate change conditions, the reliability and resiliency of the water system will tend to decrease; consequently, its vulnerability over time will also decrease. Ingol-Blanco and McKinney (2011) proposed scenarios under climate change hypotheses that could make the system more reliable and less vulnerable in meeting water demands for irrigation and municipal uses.
The application of simulation models is one of the most efficient ways to analyze water resources systems. These models are based on physical relations accompanied by a series of operational rules attempting to simulate a phenomena as close as possible to reality and the system behavior under a specified policy (Babazadeh et al., 2007). HEC-ResSim is one of the simulation models that possess multi reservoir simulators and can simulate a water resources system (Babazadeh et al., 2007).
HEC-ResSim is employed for water resources allocation, hydropower and water resources management, for one or more reservoirs and for a variety of operational goals and constraints such as flood management, low flow regulation, hydropower production and real-time decision support (HEC, 2007). The highest capability of this model is the definition of different operational rules, the creation of scenarios for conditional operation, downstream control point, reservoir system balance (in series and in parallel), imitation of the hydrological condition, installation of different structures in the dam body, comparison of output with observed data, and definition of different operational levels (HEC, 2007).
HEC-ResSim supports the administration of water right permits and other types of water allocation systems. Real-time modeling applications may involve decision-support for water management and actions for the curtailment of water supply during droughts (Wurbs, 2005).
Taking into consideration water loss by evaporation in El Cuchillo reservoir due to high temperatures in the northeast of Mexico, especially during summer, and to the big surface area of the pool, the HEC-ResSim model was applied to the San Juan River watershed for evaluating El Cuchillo from 1994 to 2014 in order to extract more water from the reservoir under stress conditions.
2. Methods
2.1 Study site
The San Juan River basin belongs to the Rio Bravo-San Juan hydrographic region (24B). It has an area of 32 972 km2, located between 25º 15’-26º 45’ N, and 99º 15’-101º 45’ W. It covers three Mexican states: Coahuila, with 13 123 km2; Nuevo León, with 18 860 km2, and Tamaulipas, with 989 km2 (INEGI, 2015). The main tributaries of the San Juan River are the Salinas, Pesquería, Santa Catarina, Ramos and Pilón rivers (Aguilar-Barajas et al., 2015).
Monterrey, the capital of the state of Nuevo León (located in northeast of Mexico), is situated approximately in the center east of the state, close to the Texas border, at 25º 45’ N, 100º 15’ W (Aguilar-Barajas et al., 2015). It has a semiarid climate according to the Köppen classification (Aguilar-Barajas et al., 2015) with an average yearly temperature of 22.3 ºC, humidity of 79 %, solar radiation of 128 W m-2, and an annual cumulative average precipitation value of 590.9 mm (CONAGUA, 2014) (Table I).
Table I Monthly air temperature, humidity, radiation and precipitation in the state of Nuevo León (Conagua, 2014).
| Month | |||||||||||||
| January | February | March | April | May | June | July | August | September | October | November | December | Accumulated | |
| Air temperature (ºC) | 14.4 | 16.6 | 20.0 | 23.4 | 26.2 | 27.9 | 28.6 | 28.4 | 26.2 | 22.4 | 18.4 | 15.1 | 267.6 |
| Humidity (%) | 92 | 89 | 86 | 83 | 78 | 75 | 77 | 73 | 74 | 81 | 67 | 70 | 945 |
| Radiation (W m-2) | 24 | 57 | 72 | 105 | 179 | 244 | 218 | 215 | 170 | 97 | 89 | 63 | 1533 |
| Precipitation (mm) | 16.6 | 16.5 | 19.9 | 29.7 | 52.3 | 68.4 | 43.0 | 79.6 | 150.6 | 77.2 | 23.0 | 14.1 | 590.9 |
The climatic phenomena that generate floods in the AMM occur mainly between June and October, when rains are of great intensity and short duration, which causes flooding such as the hurricanes Gilbert in September 1988 with 446 mm of precipitation and Alex in July 2010 with 485 mm (Aguilar-Barajas et al., 2015).
The vegetative cover of the San Juan River watershed around the city of Monterrey is composed mainly of desert-shrug vegetation (62.9 %), agriculture (18.22 %), forest (6.37 %), urban areas (0.53 %) and stratified drift (4.2 %), with a small surface area of barren land (1.4 %) and open water (0.33 %) (INEGI, 1980).
2.2 The reservoirs
Important hydraulic structures have been built and developed in the San Juan River basin to meet the needs for water in urban, industrial activities, irrigation, and flood control. The most important structures are the Cerro Prieto, La Boca, El Cuchillo, Marte R. Gómez, Rompepicos and Las Blancas dams (Fig. 1).
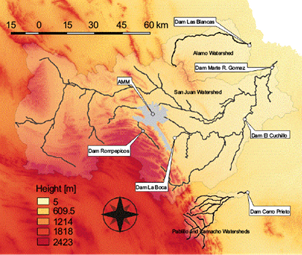
Fig. 1 Location of the Monterrey Metropolitan Area (AMM) and the San Juan, Álamo, Pablillo and Camacho watersheds, as well as La Boca, El Cuchillo, Marte R. Gómez, Cerro Prieto, Las Blancas and Rompepicos dams.
El Cuchillo dam, located in the San Juan River watershed at 166.6 masl, was completed in 1994, with a maximum storage capacity of 1784 Mm3 (CONAGUA, 2014). It is mainly used to supply water to the AMM and to some municipalities in the sates of Nuevo León and Tamaulipas located downstream of the dam (Aguilar-Barajas et al., 2015), and for the irrigation of 3640 ha in irrigation districts 031 and 026. This reservoir also regulates the avenues of the San Juan River, protecting the inhabitants downstream of El Cuchillo dam (Aguilar-Barajas et al., 2015).
Cerro Prieto dam is in the watershed of the Pablillo and Camacho rivers. It was completed in 1984 and has a maximum storage capacity of 393 Mm3 with a elevation of 285.5 masl (Conagua, 2014), and it is used mainly for water supply to the AMM and for the irrigation of 75 000 ha in irrigation district 026 (Aguilar-Barajas et al., 2015).
La Boca dam is located in the San Juan River watershed at 449.2 masl. It was completed in 1965, with a maximum capacity of approximately 42.6 Mm3 (Conagua, 2014), and is mainly used for water supply to the AMM and surrounding municipalities (Aguilar-Barajas et al., 2015).
Marte R. Gómez dam is in the San Juan River watershed at 83 masl. It was completed in 1946 and has a maximum storage capacity of 2208.6 Mm3 (Conagua, 2014). It is is used mainly for water supply to some municipalities of Tamaulipas and to the irrigation district 026 (Aguilar-Barajas et al., 2015).
Las Blancas reservoir is in the Alamo River watershed at 91.8 masl. It was completed in 2000 and has a maximum storage capacity of approximately 133.9 Mm3 (Conagua, 2014). It is used mainly for diverting water to the Marte R. Gómez reservoir for environmental uses, and then to irrigation district 026 (Aguilar-Barajas et al., 2015).
The Rompepicos dam was built in 2004 in the Santa Catarina river, a tributary of the San Juan river (15 km upstream of the Huasteca canyon), to prevent extraordinary flooding in the AMM (as the one caused by hurricane Gilbert in 1998) due to torrential rains resulting from hydrometorological phenomena. This dam is not for storage, but only for control. It serves to regulate the extraordinary floods that reach the Santa Catarina River, which crosses the AMM (Cazares-Rodríguez, 2016).
El Cuchillo reservoir has the capacity to divert 3 m3 s-1 for irrigation, and to supply an average of 2.6 m3 s-1 and a maximum of 5.5 m3 s-1 of potable water for the AMM (Conagua, 2014). Los Aldama aqueduct can also divert water from El Cuchillo reservoir to the AMM, but since its flow is much lesser (maximum of 0.21 m3 s-1, average of 0.065 m3 s-1) compared to the main diversion, for model simplification only the latter was taken into consideration (Conagua, 2014).
The Cerro Prieto reservoir has the capacity to divert 1.0 m3 s-1 for irrigation, and to supply an average of 1.9 m3 s-1 and a maximum of 4.3 m3 s-1 of potable water to the AMM. It also diverts water to La Boca in a similar amount than this reservoir’s diversion to the AMM when the latter undergoes a water shortage (Conagua, 2014).
La Boca reservoir, whose capacity to divert potable water to the AMM has an average of 0.938 m3 s-1 and a maximum of 4.06 m3 s-1 (Conagua, 2014), has never been used for irrigation. The Marte R. Gómez reservoir has a capacity of 12 m3 s-1 to divert water for irrigation to the state of Tamaulipas (Huerta, 2015). La Blancas has a capacity of 2.85 m3 s-1 to divert water to the Marte R. Gómez reservoir for environmental use (Aguilar-Barajas et al., 2015). All this information is summarized in Table II.
Table II Maximum storage, elevation, diversion to the AMM, irrigation and environmental use from the studied reservoirs (Conagua, 2014; Aguilar-Barajas et al., 2015).
| Reservoir | Maximum storage (Mm3) | Elevation (masl) | Diversion to the AMM (m3 s-1) | Irrigation (m3 s-1) | Environmental (m3 s-1) |
| El Cuchillo | 1784.0 | 147.6 | 2.6 | 3.0 | 0 |
| La Boca | 42.6 | 427.5 | 0.938 | 0.0 | 0 |
| Cerro Prieto | 393.0 | 264.5 | 1.9 | 1.0 | 0 |
| Las Blancas | 133.9 | 80.2 | 0 | 0 | 2.85 |
| Marte R. Gómez | 2208.6 | 65.0 | 0 | 12.0 | 0 |
El Cuchillo, Marte R. Gómez and Las Blancas are the only reservoirs currently functioning under common rules. El Cuchillo has to release all the water storage downstream to Marte R. Gómez in the reservoir in the following circumstances: (1) during November; (2) if the volume of water storage in El Cuchillo is greater than 315 Mm3, and 3) if the volume of water storage in Marte R. Gómez is lesser than 700 Mm3. Las Blancas has to divert 2.85 m3 s-1 whenever possible to Marte R. Gómez for environmental use (Huerta, 2015).
El Cuchillo is under weather and topographic constrains: it is subject to high temperatures and evaporation stress (see Table III) (Conagua, 2014), and it has an exponential rising surface area for every unit of elevation due to the topography of the region (Fig. 2).
Table III Monthly average, maximum and minimum evaporation in El Cuchillo reservoir (Conagua, 2014).
| Month | ||||||||||||
| January | February | March | April | May | June | July | August | September | October | November | December | |
| Average (mm) | 132 | 132 | 166 | 196 | 221 | 245 | 248 | 248 | 185 | 166 | 141 | 123 |
| Maximum (mm) | 259 | 186 | 219 | 292 | 316 | 308 | 395 | 317 | 275 | 221 | 267 | 275 |
| Minimum (mm) | 58 | 66 | 114 | 97 | 70 | 81 | 65 | 128 | 54 | 92 | 72 | 42 |
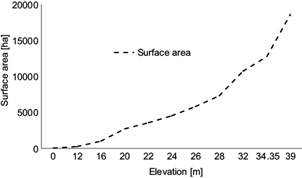
Figure 3 shows in the x-axis the monthly volume of water evaporation and the observed diversion, and in the y-axis the accumulated volume of water evaporation and the observed diversion from the reservoir El Cuchillo to the AMM from 1994 to 2014, calculated with Conagua (2014) data. The total volume of evaporated water is 5697 Mm3 and the diversion of potable water is 1723 Mm3, which means that the volume of evaporated water from the reservoir during the studied period is 3.3 times greater than the diverted water. Besides, the chart shows that daily evaporation is usually much higher than the observed diversion in every month form 1994 to 2014, and especially from 2003.
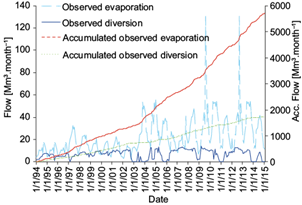
Fig. 3 Monthly simple and accumulated evaporation, as well as observed diversion in El Cuchillo reservoir from 1994 to 2014 (Conagua, 2014).
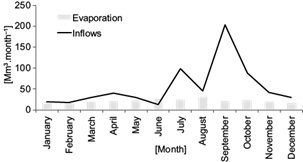
Also, an average monthly volume of evaporation and inflow to El Cuchillo reservoir was calculated from 1994 to 2014 (Fig. 4) with data from Conagua (2014). This shows that between July and December there is an excess of inflow over evaporation, therefore it is possible to extract water from the reservoir taking in consideration this inflow without affecting the normal functioning of the reservoir.
2.3 HEC-ResSim model application
The US Army Corps of Engineers (USACE) Hydrologic Engineering Center (HEC) has developed a suite of generalized simulation models, including HEC-ResSim, which is extensively applied in Texas as well as nationwide in the US and abroad (Wurbs, 2005).
The USACE-HEC initiated the development of HEC-ResSim in 1996 and released it to the public in 2003 with the intention of eventually replacing HEC-5, which has been extensively applied for more than 30 years (Wurbs, 2005).
Meeting the needs of the USACE, reservoir control personnel for real-time decision support have been the driving force in the development of HEC-ResSim (Wurbs, 2005). The model is also applicable to planning studies. The full spectrum of multipurpose reservoir system operations can be modeled with particularly detailed capabilities provided for flood control. The model is also applicable to planning studies (Wurbs, 2005).
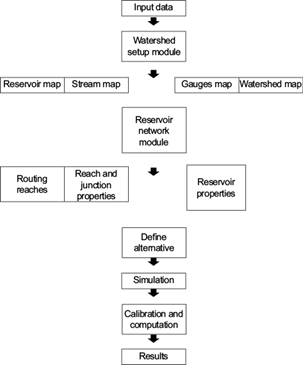
HEC-ResSim has three main modules (Fig. 5): watershed setup, reservoir network and simulation, with computational steps that range from 15 min to 1 day (Alemaw et al., 2016). Model input data are: reservoir properties (volume-area and elevation curve, operation levels, operation rules) control and operation points, rivers routing properties and time series input file (HEC, 2007). According to Fagot et al. (2011), data requirements for HEC-ResSim include the physical and operational characteristics of the dam or reservoir. Physical reservoir data are described with volume-area and elevation curves, and the type and capacity of each outlet, besides evaporation and infiltration data if available. Operational data includes zone definitions along with the rules for the operations in each zone. There are three main management zones or pools: the inactive pool, the conservation pool, and the flood pool.
HEC (2007) describes each one of these zones. The inactive pool is referred to as dead storage since its water is below the elevation of the lowest outlet in the dam. The conservation pool holds water that is set aside for purposes such as navigation and hydropower production. The flood pool is a storage that is set aside to capture inflow from hydrological response at catchment scale, with the purpose of managing potential downstream flooding (HEC, 2007).
Operational rules can be created and evaluated by HEC-ResSim formulation if there are no rules that will make the model to follow the basic guide curve operation. HEC-ResSim was implemented to get to the top of the conservation (TOC) pool. If the elevation level of the pool is below TOC, it will hold all inflow and allow the pool to rise, so the only constraint to prevent water from reaching the TOC is the inflow. If the elevation is above the TOC, HEC-ResSim will release inflow and stored water to get back to TOC, which is the only constraint to the physical release capacity. Therefore, the rules can reflect a physical or an operational consideration.
A watershed setup was conducted using images from ArcGIS (Fig. 6), including the San Juan River watershed with La Boca, El Cuchillo and Marte R. Gómez reservoirs; the Las Blancas reservoir over the Álamo River, and the Cerro Prieto reservoir over the Camacho and Pablillo rivers.
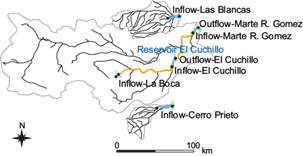
Fig. 6 Watershed setup of La Boca, El Cuchillo, Cerro Prieto, Las Blancas and Marte R. Gómez reservoirs.
A reservoir network was created using the watershed setup from Figure 6. Irrigation district 026 has water diversion from El Cuchillo, Marte R. Gómez and Cerro Prieto reservoirs. The AMM has water diversions from La Boca, El Cuchillo and Cerro Prieto reservoirs (Fig. 7).
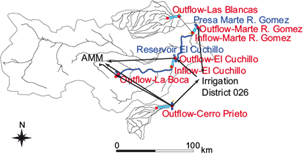
Fig. 7 Reservoir network of the La Boca, El Cuchillo, Cerro Prieto, Las Blancas and Marte R. Gómez reservoirs, irrigation district 026, and the AMM diversions.
The reservoirs have been modeled in HEC-ResSim with calculated monthly inflows and observed average evaporation from 1994 to 2014 using data form Conagua (2014). The calculated monthly inflows were interpolated from a monthly to daily time step using HEC-DSS files, due to the fact that HEC-ResSim has a daily maximum time step, and then, after the simulation, the outputs are recalculated to a monthly time step.
Operation rules for flood control, conservation and inactive top elevations, as well as operation levels with volume, area and elevation curves, monthly evaporation, outlets structures geometry and hydraulics were introduced in the reservoir network.
A operation rule was introduced between El Cuchillo and Marte R. Gómez reservoirs to transfer the whole storage of water in November if the storage in El Cuchillo is greater than 315 Mm3 and the storage in Marte R. Gómez is lower than 700 Mm3.
Two diversion scenarios were introduced for El Cuchillo reservoir, to divert potable water to the AMM. The observed diversion for potable water and the calculated volumes for El Cuchillo reservoir from 1994 to 2014 were used to compare the simulated scenarios with observed data.
2.3.1 Alternative scenario 1
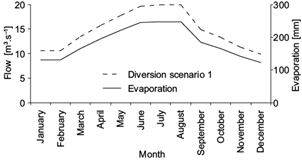
A first scenario was created and run, where El Cuchillo reservoir diversion is setup for monthly diversion of water to fit its average evaporation curve trend (Fig. 8). The diversion in El Cuchillo reservoir has a maximum of 20.0 m3 s-1 in August and a minimum of 9.9 m3 s-1 in December.
For the reservoirs La Boca and Cerro Prieto, the monthly diversion was set up with the average monthly diversion observed between 1994 and 2014 of 0.938 and 1.9 m3 s-1, respectively.
For the reservoirs El Cuchillo, Cerro Prieto and Marte R. Gómez, the seasonal diversion of water for irrigation from April to September was set up with 3.0, 1.0 and 12.0 m3 s-1 respectively. Also, there is a constant diversion of 0.5 m3 s-1 from Cerro Prieto to La Boca and of 2.85 m3 s-1 from Las Blancas to Marte R. Gómez for environmental issues.
2.3.2 Alternative scenario 2
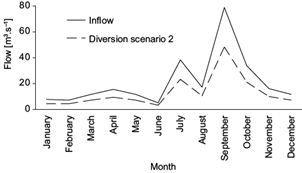
A second scenario was created and run where the diversion of El Cuchillo reservoir is set up for monthly diversion of water to fit the average of the inflows curve of El Cuchillo reservoir (Fig. 9). The diversion in the reservoir has a maximum of 48.15 m3 s-1 in September and a minimum of 4.7 m3 s-1 in January. For all the other reservoirs, the diversion for scenario 2 is the same than for scenario 1.
3. Results and discussion
Two alternative scenarios were run in El Cuchillo reservoir for the period 1994-2014, to obtain a greater diversion of water to the AMM and to save this water from losses due to high evaporation. The results of this simulation (Fig. 10) show the observed and simulated monthly diversion in scenarios 1 and 2 for El Cuchillo reservoir to the AMM from 1994 to 2014. During this period, the simulated diversion for scenario 1 had a peak of 20 m3 s-1 and an average of 4.1 m3 s-1 and; for scenario 2, the peak was of 48 m3 s-1 and the average of 4.5 m3 s-1, against the observed diversion peak of 5.5 m3 s-1 and average of 2.6 m3 s-1.
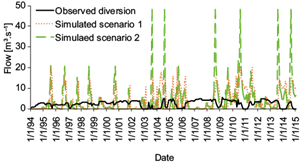
Fig. 10 Observed and simulated diversions from the reservoir El Cuchillo to the AMM for scenarios 1 and 2 from 1994 to 2014.
Figure 11 shows the observed and simulated accumulated monthly diversions for scenarios 1 and 2 from the reservoir El Cuchillo from 1994 to 2014. During this period, the simulated accumulated diversion for scenario 1 was 2593.5 Mm3, 50 % larger than the observed accumulated diversion for scenario 2 (2935.6 Mm3), and 70 % bigger than the observed accumulated diversion (1723 Mm3). It is worth noticing that there is not a significant increase of simulated accumulated diverted water until 2003 for scenario 2 and 2004 for scenario 1 vs. the observed accumulated diversion. And again, there is a significant increase of water diverted for both simulated scenarios from 2008 to 2015.
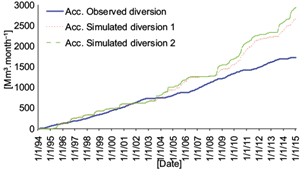
Fig. 11 Observed and simulated accumulated diversions for scenarios 1 and 2 for the reservoir El Cuchillo from 1994 to 2014.
Figure 12 shows the simulated monthly diversions for irrigation corresponding to reservoirs El Cuchillo, Marte R. Gómez, Las Blancas and Cerro Prieto for scenario 1 from 1994 to 2014. There are not observed data available for this period. Regarding the simulated diversion for irrigation in El Cuchillo from 1994 to 2014, it had a peak of 3.0 m3 s-1, an average of 0.65 m3 s-1, and an accumulated diversion of 564 Mm3 for scenario 1.
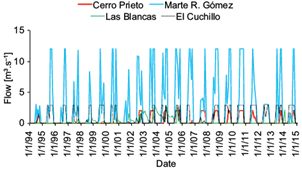
Fig. 12 Simulated monthly diversions for irrigation from the reservoirs El Cuchillo, Marte R. Gómez, Las Blancas and Cerro Prieto from 1994 to 2014 for scenario 1.
Figure 13 shows the simulated monthly diversions for irrigation from the reservoirs El Cuchillo, Marte R. Gómez, Las Blancas and Cerro Prieto from 1994 to 2014 for scenario 2. During this period, the simulated diversion for irrigation had a peak of 3.0 m3 s-1, an average of 0.62 m3 s-1 and an accumulated diversion of 408 Mm3.
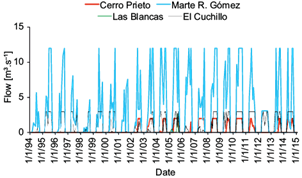
Fig. 13 Simulated monthly diversions for irrigation from the reservoirs El Cuchillo, Marte R. Gómez, Las Blancas and Cerro Prieto from 1994 to 2014 for scenario 2.
Figure 14 shows observed and simulated monthly storages and for the reservoir El Cuchillo for scenarios 1 and 2, as well as TOC, from 1994 to 2014. The simulated storage for the scenario 1 has a peak of 1123 Mm3 and an average of 607 Mm3, and for scenario 2 it has a peak of 1123 Mm3 and an average of 637 Mm3, respectively, against the observed storage peak of 1745 Mm3 and an average of 788 Mm3. The TOC has a value of 1123 Mm3. It is worth noticing that there is not a significant difference between the observed and simulated storages for both scenarios until 2002. The observed storage reaches the TOC level in November 2002 and the simulated storages reach the TOC level in June 2006.
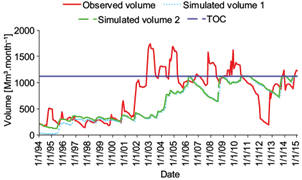
Fig. 14 El Cuchillo reservoir observed and simulated storages for scenarios 1 and 2, as well as TOC, from 1994 to 2014.
Figure 15 shows El Cuchillo reservoir observed and simulated monthly-accumulated volumes for scenarios 1 and 2 from 1994 to 2014. The simulated accumulated volume for scenario 1 is 153 451 Mm3, 30 % smaller than the observed volume, and for scenario 2 it is 161 137 Mm3, 24 % smaller than the observed accumulated volume of 199 272 Mm3.
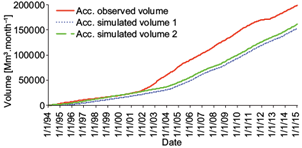
Fig. 15 El Cuchillo reservoir observed and simulated accumulated volume for scenarios 1 and 2 from 1994 to 2014.
Figure 16 shows in the left y-axis the observed and simulated outflows, and in the right y-axis the observed and simulated accumulated outflows for scenario 1 for the reservoir El Cuchillo from 1994 to 2014.
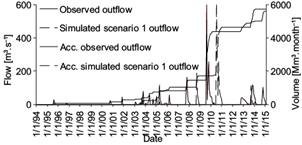
Fig. 16 Observed and simulated outflows (left y-axis) and observed and simulated accumulated outflows (right y-axis) for scenario 1 for the reservoir El Cuchillo from 1994 to 2014.
Figure 17 shows the observed and simulated outflows in the x-axis, and in the y-axis the observed and simulated accumulated outflows for scenario 2 for the reservoir El Cuchillo from 1994 to 2014. Table IV shows El Cuchillo reservoir final observed and simulated accumulated diversion, volumes and outflows for scenarios 1 and 2 from 1994 to 2014.
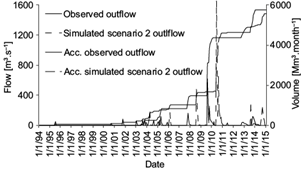
Fig. 17 Observed and simulated outflows (left y-axis) and observed and simulated accumulated outflows (right y-axis) for scenario 2 for the reservoir El Cuchillo from 1994 to 2014.
Table IV El Cuchillo reservoir final observed and simulated accumulated volumes (in Mm3 month-1) for diversion, irrigation, storage and downstream outflows to the Marte R. Gómez reservoir from 1994 to 2014.
| Accumulated diversion | Accumulated irrigation | Accumulated storage | Accumulated outflows | |
| Observed | 1723 | - | 198 042 | 5744 |
| Scenario 1 | 2593 | 551 | 153 451 | 5546 |
| Scenario 2 | 2935 | 530 | 161 137 | 5597 |
The simulations results show that for the scenario 1 the reservoir diverts an average volume of 4.1 m3 s-1 and for scenario 2 an average volume of 4.5 m3 s-1, while the observed average diversion is of 2.6 m3 s-1 for the 20-yr period. The observed and simulated accumulated monthly diversion for scenarios 1 and 2 show an increase of 2593.5 Mm3 for scenario 1 (50 %) and an increase of 2935.6 Mm3 for scenario 2 (70 %), as compared to the initial observed accumulated diversion of 1723 Mm3.
To achieve a 50 % rise in diverted water for scenario 1 within a 20-yr period, it was necessary to increase the average withdraw of water by 57 % from 2.6 to 4.1 m3 s-1, and to rise the peak from the observed 5.5 m3 s-1 to the simulated 20 m3 s-1 (363 %). For scenario 2, to achieve an increase of 70 % in water diversion, it was necessary to rise the average withdraw from 2.6 to 4.5 m3 s-1 (73 %) and the peak from 5.5 to 48 m3 s-1 (878 %).
The simulated storages for both scenarios in El Cuchillo reservoir show a similar trend, with a final accumulated storage of 153 451 Mm3 for scenario 1 and 161 137 Mm3 for scenario 2, 30 and 24 % smaller, respectively, than the observed accumulated storage of 199 272 Mm3. Both simulated respect the TOC volume of 1123 Mm3, unlike the observed data in 54 months during the 20-yr period.
The significant increase of diverted water under simulated scenarios 1 and 2 occurs after 2003 and 2004, respectively, as shown in Figure 11, and then again in 2008. It is easy to understand this is due to the fact that the reservoir started to operate in 1994 and did not reach the TOC until 2002, as shown in Figure 14, which means there was not enough evaporation to become diverted water in this early period of the reservoir, according to the assumed hypothesis. Figure 3 corroborates this; a large amount of evaporation begins from 2002, when the volume of storage water reaches its peak, as does the surface area of the reservoir. From 2008, when the reservoir El Cuchillo reached full operational conditions, the amount of diverted water under both scenarios increased significantly, as shown in Figure 11 for accumulated diversion. The observance of the TOC during simulations and the similar trend of the observed and simulated data for the reservoir’s water storage, shows that it is possible to withdraw more water from the reservoir under an alternative hypothesis, without empting the reservoir or sacrificing the water for irrigation.
The outflows downstream the San Juan River show similar trends for the observed and simulated scenarios with an accumulated outflow 5744 Mm3 for the observed data, 5597 Mm3 for scenario 1 and 5546 Mm3 for scenario 2 (2.5 and 5.5 % smaller, respectively).
For the Cerro Prieto, La Boca, Las Blancas and Marte R. Gómez reservoirs, Table V summarizes the observed and simulated accumulated diversions for scenarios 1 and 2 from 1994 to 2014.
Table V Cerro Prieto, La Boca, Las Blancas and Marte R. Gómez reservoirs observed and simulated accumulated diversions for scenarios 1 and 2 from 1994 to 2014.
| Cerro Prieto (Mm3) | La Boca (Mm3) | Marte R. Gómez (Mm3) | Las Blancas (Mm3) | |
| Observed | 1232 | 966 | - | - |
| Scenario 1 | 944 | 288 | 1805 | 157 |
| Scenario 2 | 944 | 288 | 2063 | 157 |
For the simulated scenarios 1 and 2, the reservoirs Cerro Prieto and La Boca underperform the observed diversion, whereas there is not observed data for irrigation or environmental uses for these reservoirs. For La Boca and Cerro Prieto, diversions for potable water show a decrease from observed to simulated data (966 and 288 Mm3, and 1232 to 944 Mm3, respectively). The underperformance of simulated diversions for Cerro Prieto and La Boca reservoirs results form a simple hypothesis for water diversion from these reservoirs that only considered the average water diverted for the period, though the amount of diverted water was much higher due to peaks of water available in the Cerro Prieto and La Boca systems.
Because of the lack of observed data for irrigation and environmental use in El Cuchillo, Cerro Prieto, Marte R. Gómez and Las Blancas reservoirs, an optimal scenario is created, the water diverted for irrigation should be the maximum water diverted for this seasonal period of irrigation assuming the inflow is sufficient to support the diverted demand.
The water diverted for irrigation in El Cuchillo reservoir from 1994 to 2014 was 551 Mm3 for scenario 1 and 530 Mm3 for scenario 2. For an optimal scenario, the water diverted for irrigation should be 777.6 Mm3.
The water diverted for irrigation in Cerro Prieto reservoir from 1994 to 2014 was 114 Mm3 for both scenarios. For the optimal scenario, water diverted for irrigation should be 120 Mm3.
The water diverted for irrigation in the Marte R. Góomez reservoir from 1994 to 2014 was 1805 Mm3 for scenario 1 and 2063 Mm3 for scenario 2. For the optimal scenario, water diverted for irrigation should be 3110 Mm3.
The water diverted for environmental use in Las Blancas reservoir from 1994 to 2014 was 157 Mm3 for both scenarios; for the optimal scenario, water diverted for environmental use should be 1868 Mm3.
4. Conclusions
El Cuchillo reservoir is used for water supply to the AMM. This reservoir is under evaporation stress, due to the high temperatures prevailing during the whole year and especially in the summer, as well as the large surface area of the pool. Therefore, El Cuchillo is a big source of water loss due to evaporation.
A research was conducted for the evaluation of alternative management of El Cuchillo from 1994 to 2014 with the application of the HEC-ResSim 3.1 model, aiming to divert more water from the reservoir to save it from evaporation. Two alternative scenarios were created to achieve more diversion without changing the water supply for irrigation or the relationship with Marte R. Gómez reservoir downstream of El Cuchillo.
For the first scenario, a hypothesis was made where the amount of diverted water follows the evaporation yearly trend of El Cuchillo reservoir. For the second scenario, the hypothesis considers that diverted water follows the yearly trend of the San Juan River inflow to El Cuchillo reservoir.
For the other reservoirs (Cerro Prieto, La Boca, Las Blancas and Marte R. Gómez), the amount of diverted water was the observed average of the monthly diversion for potable water. There is not observed data to compare the amount of water diverted from Las Blancas and Marte R. Gómez for irrigation and environmental use.
The conducted simulations show that it is possible to obtain more water resources from El Cuchillo reservoir due to the evaporation stress and obtain 50% more water in scenario 1 and 70 % more in scenario 2, compared to the observed diversion, during a period of 20 years from 1994 to 2014, if an alternative management of El Cuchillo reservoir is established. This increase in the amount of diverted water was achieved by rising the yearly peak from 5.5 to 20 m3 s-1 for scenario 1 and to 48.1 m3 s-1 for scenario 2, respectively.
The simulated accumulated storages for both scenarios in El Cuchillo reservoir showed similar trends vs. the observed storages: 30 % lower for scenario 1 and 24 % lower for scenario 2. Both simulated scenarios comply with the TOC, unlike the observed storages during the 20-yr period.
The increase of simulated accumulated diverted water with regard to the observed accumulated diversion starts in 2003 for scenario 2 and in 2004 for scenario 1, and there is a significant increase of water diverted for both simulated scenarios from 2008 to 2014. The observed storage reaches the TOC level in November 2002, and for both simulated storages in June 2006, which means that under the new diversion hypothesis it takes longer for the reservoir to meet the TOC capacity from the original starting operational year in 1994, but once the reservoir arrives to full operational conditions, but once the reservoir attains its full operational conditions, the simulated scenarios 1 and 2 reach the TOC level in 2006; from then on, the simulated scenarios start to receive an increaseed amount of water from El Cuchillo compared to the observed diversion.
Some problems regarding the assumed hypothesis are, first, the period of time considered to fulfill the hypothesis, which is 20 years, probably not long enough to consider long run trends from the point of view of the inflows and evaporation in the watershed. Second, the hypothesis assumed for the La Boca, Cerro Prieto, Las Blancas and Marte R. Gómez reservoirs was the average water diverted during the simulated period, and the model couldn’t replicate the historical diversion for the other two reservoirs, Cerro Prieto and La Boca. Therefore, seasonal diversion has to be taken in consideration, which will also raise the peaks for the other reservoirs. Third, due the lack of accurate observed data for irrigation and environmental use in El Cuchillo, Cerro Prieto, Marte R. Gómez and Las Blancas reservoirs, it is not possible to conduct an evaluation, calibration and optimization of the whole system. Probably this is the most important limitation for future research. Fourth, only two scenarios have been taken into consideration, but more scenarios can be created, taking into account other parameters such as monthly volume or surface area of the reservoir to divert water.
For future research, these observations about data collection and hypothesis have to be considered for the evaluation of new scenarios and the optimization of the whole AMM surface water supply system.

