INTRODUCTION
Santa Ana winds (SAWs) are foehn-type desert winds that occur seasonally in southern California, United States, and northern Baja California, Mexico, generally with a northeasterly or easterly direction (Glickman and Zenk 2000). The winds blow with great magnitude and strong gusts, which flow down the mountains and plateaus (Conil and Hall 2006). The region presents a complex topography, including broad mountain ranges, low coastal plains, and high desert plateaus (Castro et al. 2006). On the other hand, SAWs have important implications for the pattern of coastal currents (Navarro-Olache et al. 2020) and for the influx of mineral dust and its associated contributions of iron and manganese to the coastal waters of the California Current System and the Gulf of California, which promote primary productivity (Félix-Bermúdez et al. 2017, Álvarez and Carbajal 2019, Álvarez et al. 2020).
The season of SAW events begins in September and ends in April. This is caused by a surface high-pressure system over the Great Basin and an offshore low-pressure system off southern California that induce a synoptic pressure gradient and force the shift of surface winds from the northeastern quadrant (Jones et al. 2010). The approximate average is 20 events per period (standard deviation: 5) (Raphael 2003). Previous works report surface speeds with average wind magnitudes between 28 and 56 km·h-1 (15-30 knots) (Small 1995), which correspond to favorable ranges in wind magnitude for wind power generation, and magnitudes of gust speed values that exceed 25 m·s-1 (56 miles per hour) (Sommers 1978, Trasviña et al. 2003, Bytnerowicz et al. 2010). The occurrence of events is frequently higher during autumn and winter than during spring and summer, with maximum activity in December and January (Jones et al. 2010). Sommers (1978) mentioned that events occurred from October to May. As described by Raphael and Finley (2007), no Santa Ana event has been recorded between June and August, due to the patterns of the Pacific high-pressure system located west of California.
SAW events have been the object of study for several years due to their different impacts on the border of Baja California, Mexico, and California, United States (Castro et al. 2003, Hu and Liu 2003, Raphael 2003, Trasviña et al. 2003, Westerling et al. 2004, Sosa-Ávalos et al. 2005, Conil and Hall 2006, Miller and Schlegel 2006, Hsu et al. 2007, Hughes et al. 2009, Bytnerowicz et al. 2010, Hughes and Hall 2010, Jones et al. 2010, Jin et al. 2014, Langford et al. 2015, Hatchett et al. 2018, Álvarez et al. 2020, Gershunov et al. 2021, Serpa-Usta et al. 2021). Within the region impacted by this phenomenon, there are, on the side of the Pacific Ocean, highly urbanized areas, important agricultural areas, forests, and deserts (Castro et al. 2006).
SAWs occur in the region of La Rumorosa, which is characterized as a site with extraordinary potential for harnessing wind power. A study by the Ensenada Center for Scientific Research and Higher Education indicates that, in the area, the presence of SAW events increases the magnitude of average wind speeds (CICESE 2003). During the first 5 years of operations of the wind farm La Rumorosa I, the presence of SAW events in a wind turbine was analyzed, and the average annual electricity generation of that turbine was 16% in 2011 (Zamora 2016). Currently, La Rumorosa region has 52 wind turbines in operation in 2 wind farms, and there are plans to install more in the future (NADB 2013, CEE 2017).
According to Rolinski et al. (2019), the criteria for defining SAWs depend on both the topic of interest regarding the phenomenon (for example, catastrophic forest fires) and its spatiotemporal variability. The velocity magnitude, direction, local pressure gradient, temperature, and relative humidity are used to define SAWs (Raphael 2003).
In this work, we classify SAWs in La Rumorosa because of the favorable conditions found at this site for harnessing wind energy.
MATERIALS AND METHODS
For this study, we analyzed data on the magnitude of wind speed, magnitude of gust speed, and direction of the wind, as well as data on relative humidity and local atmospheric pressure measured at the surface, over a period of 10 years (2005 to 2014), in periods measured at 10-min intervals at a height of 10 m above ground level. Data from 2005 to 2014 from the weather station in La Rumorosa were obtained by formal request to the Comisión Nacional del Agua (CONAGUA, Mexico), with 2% missing data; in addition, the data corresponding to the last 90 days (CONAGUA 2022) can be consulted online. Table 1 shows the geographical characteristics of La Rumorosa weather station (CONAGUA 2022), and Figure 1 shows the geographical location of the station. In addition, local atmospheric pressure values and atmospheric pressure values corresponding to the high-pressure center formed in the Great Basin for each recorded event were obtained from the synoptic maps of the National Oceanic and Atmospheric Administration (NOAA) of the United States (NWS 2007).
Table 1 Geographical characteristics of the weather station.
| Automatic weather station | Latitude (north) | Longitude (west) | Elevation (meters above sea level) |
| La Rumorosa | 32°16′20.00″ | 116°12′20.00″ | 1,262 |

Figure 1 Geographical location of La Rumorosa weather station in the northern area of Baja California, Mexico (INEGI 2022). Meters above sea level: m.a.s.l.
Study area
La Rumorosa was selected to study SAW events because of the availability of on-site surface measurements and because of the various studies that contain information that demonstrates SAW occurrence in southern California (Sommers 1978, Small 1995, Raphael 2003, Keeley et al. 2004, Castro et al. 2006, Conil and Hall 2006, Hughes and Hall 2010, Jones et al. 2010, Ackerman and Knox 2011, Abatzoglou et al. 2013, Cao and Fovell 2013, Fovell and Cao 2017). Data were compared with that of nearby stations, such as Tijuana, Ensenada, and Mexicali; this confirmed that the readings captured at La Rumorosa station recorded the presence of SAW events more frequently than those at the other stations.
Categories for evaluating Santa Ana winds
Set (1) belongs to all the data considered as SAWs from La Rumorosa weather station. The result was verified through the formation of the Great Basin high-pressure center on surface analysis maps (NWS 2005, 2006, 2007, 2008, 2009, 2010, 2011, 2012, 2013):
where V t is the magnitude of the wind speed, v(∆t i ) is the magnitude of the wind speed in meters per second, θ(∆t i ) is the wind direction in sexagesimal degrees, hr(∆t i ) is the relative humidity shown as a percentage, t i + a is the upper limit of the time interval, t i is the lower limit, and ∆t i is a time interval greater than 3 h.
Once the data were filtered, different classifications were made taking as reference the data obtained through the meteorological station and the high-pressure center formed in the Great Basin. Events according to this classification were identified on the same day, up to 2 times, and, due to the treatment of the information, they were shown as the total amount of time of SAW events; that is, if the year 2005 had a total of 22 events, with the time analysis, this would correspond to 12 days of SAWs in that year.
The sample of SAWs identified with set (1) was classified using ranges of the average wind magnitude (Data 1: ranges in intervals of 5 m·s-1) according to the SAW regional index (SAWRI) by Guzman-Morales et al. (2016), which includes weak SAWs (<5 m·s-1), moderate SAWs (5-10 m·s-1), and extreme SAWs (10-15 m·s-1). In addition, the category used for the Jet Propulsion Laboratory model applied by the National Aeronautics and Space Administration (NASA, USA) in the QuickScat Project (2003) was used, with values of 4-6 m·s-1 for weak SAWs, 6-8 m·s-1 for moderate SAWs, and >8 m·s-1 for strong SAWs (Data 2: ranges in intervals of 2 m·s-1).
(b). Dimensionless analysis based on atmospheric pressure, air density, and the maximum value of the magnitude of the wind speed
The objective of the dimensionless classification was to correlate the variables of pressure, wind speed magnitude, and air density for all SAW events and compare “weak”, “moderate,” and “strong” winds. This classification was made using the dimensionless parameter, I D (equation 2), derived from the momentum equation, and was calculated as follows:
where P H is the value of the pressure shown at the high-pressure center over the Great Basin from the synoptic maps, P local is the value of atmospheric pressure recorded in La Rumorosa area on the NOAA synoptic maps, D is the distance obtained through Google Earth between the points P H and P local , V gust is the magnitude of the gust speed, V i,mean is the magnitude of the average wind speed, and t e is the duration of the event (values measured on the surface of La Rumorosa by CONAGUA). Air density, ρ, was obtained with surface values from CONAGUA using the following equation:
where P local,m is the local maximum pressure during an event, R is the ideal gas constant, with a value of 0.2870 kPa∙m3·(kg∙K)-1, and T is the maximum average temperature recorded in all events per year.
(c). Classification using normalization on average velocity magnitude, gust velocity magnitude, and pressure gradient
With the sample of SAW events obtained with set (1), the average magnitude of the wind speed, the magnitude of the gust speed (measured on the surface by CONAGUA), and the pressure gradient were normalized to obtain a “weak”, “moderate,” and “strong” classification. The pressure gradient was normalized using the following equation:
Where
Considering the parameter I D as linear and divided into 3 intervals, and the dimensionless (item b) and normalization (item c) classifications, we proposed weak SAWs for values of 0.00-0.33, moderate SAWs for values of 0.33-0.66, and strong SAWs for values of 0.66-1.00.
RESULTS
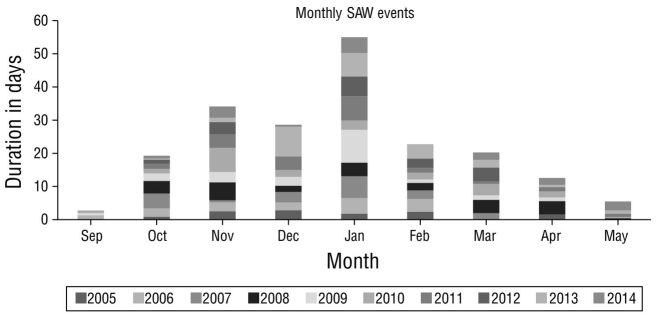
The classification of SAW events obtained by applying the previously defined criteria to set (1) is shown in Figure 2. The results show a cumulative value of 20 ± 4 d of SAWs per year. In addition, in each of the years studied, SAW events had the longest duration in January. In addition, in the years 2008, 2011, and 2014, events occurred in May, which is consistent with the reports by Hsu et al. (2007).

Figure 2 Days with Santa Ana wind (SAW) events at La Rumorosa weather station during the 2005-2014 period, with dataset (1).
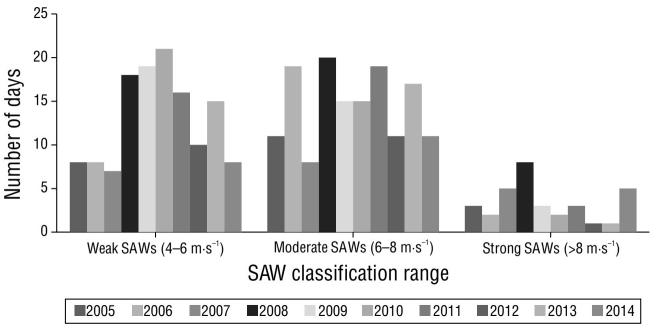
Figure 3 shows the behavior of SAWs for the study period, with a minimum of 12 d in 2005 and a maximum of 29 d in 2008. Figure 4 shows the classification based on the magnitude of the average speed of the wind (m·s-1) with categories based on the range divided in intervals of 2 m·s-1; this are shown as “weak” (4 to 6 m·s-1), “moderate” (6 to 8 m·s-1), and “strong” (>8 m·s-1), according to the QuickScat Project (2003) ranges.

Figure 4 Classification of Santa Ana wind (SAW) events in La Rumorosa, with the QuickScat Project (2003) ranges of the magnitude of wind speed with intervals of 2 m·s-1.
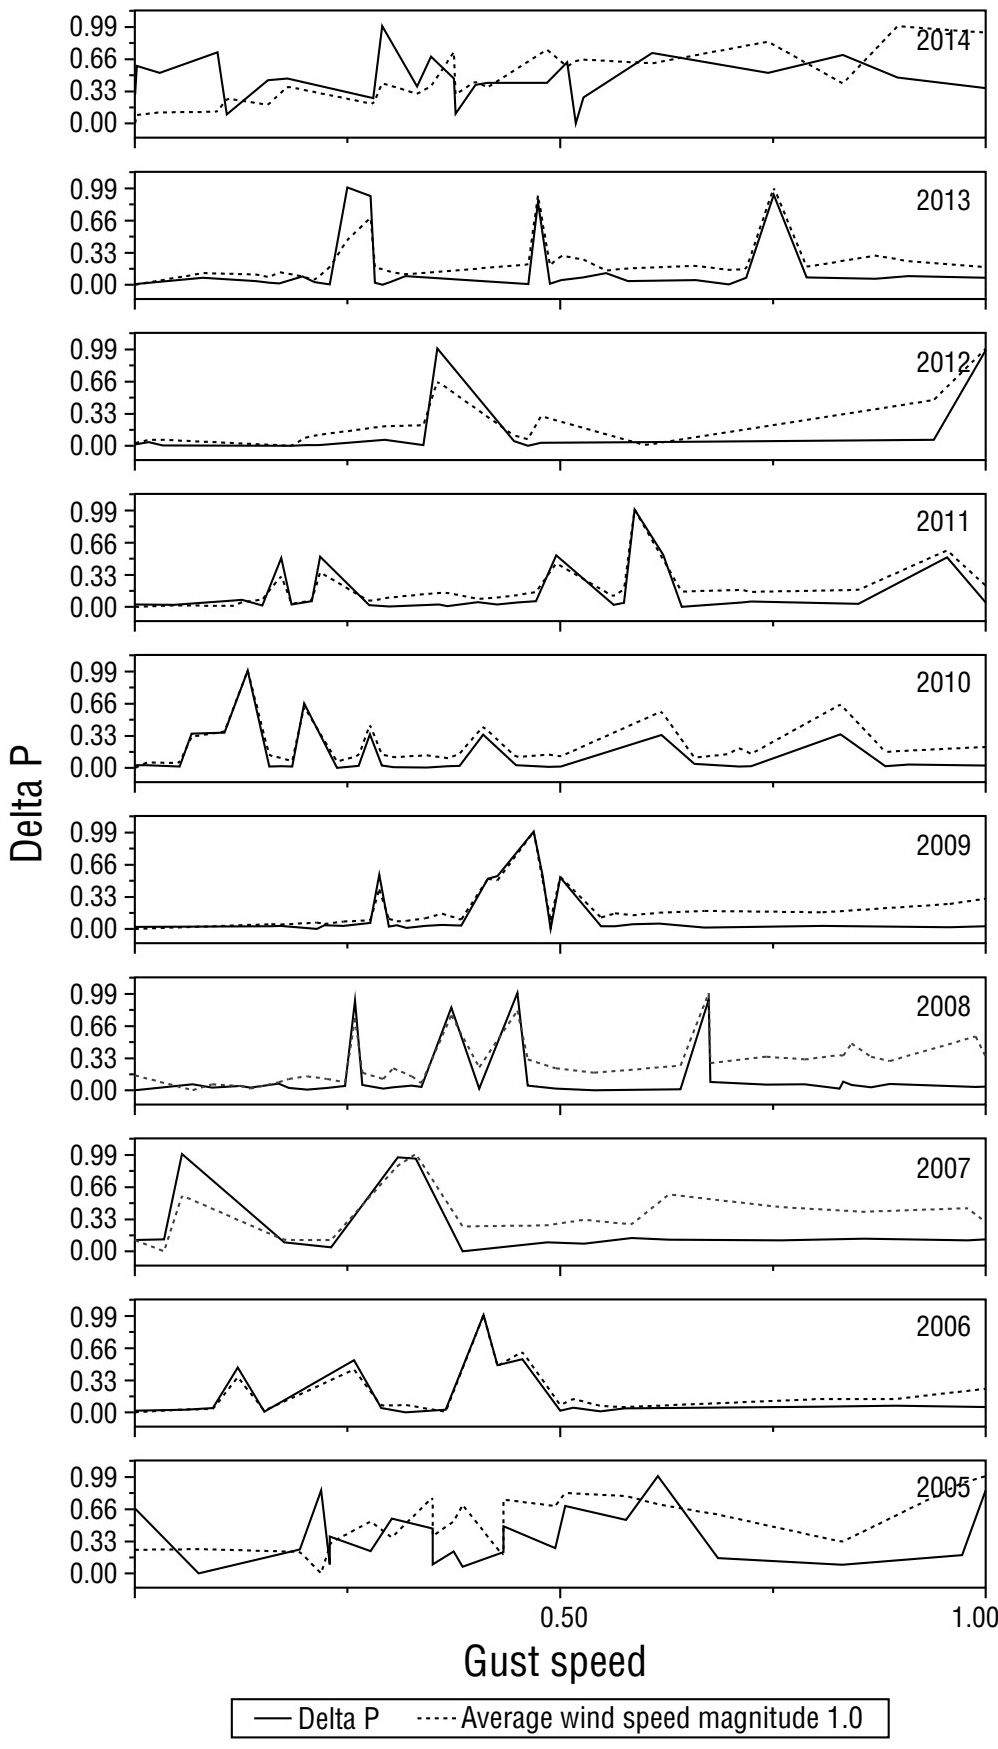
SAW event classifications were compared using the different variables proposed in the classifications mentioned in the Materials and methods section (Table 2). Figure 5 shows the normalized data of the magnitude of the average wind speed, the magnitude of the gust speed, and the pressure gradient for all the VSA events registered in the period from 2005 to 2014. This analysis was done to identify the relationship between the variables of pressure and magnitude of the average wind speed in La Rumorosa, and it showed that the greater the value of the pressure gradient, the greater the magnitude of the average wind speed. We show here the graph of the behavior of the variables in the presence of SAWs by year as a function of gust speed.
Table 2 Comparison of the results of the classification of the Santa Ana winds in La Rumorosa.
| Classification | Weak | Moderate | Strong | |
| (a) | Class range classification using the average wind speed magnitude from Guzman-Morales et al. (2016). Vm (m∙s-1): <5, 5-10, 10-15 | 7.79% | 91.88% | 0.32% |
| Class range classification using the average wind speed magnitude from QuickScat Project (2003). Vm (m∙s-1): 4-6, 6-8, >8 | 42.10% | 47.20% | 10.70% | |
| (b) | Dimensionless classification (equation 2) <0.33, 0.33-0.66, >0.66 | 37.93% | 47.93% | 14.14% |
| (c) | Normalized wind speed magnitude classification (equation 4) <0.33, 0.33-0.66, >0.66 | 32.76% | 57.24% | 10.00% |
DISCUSSION
The proposed methodology supported by previous regional studies allows following an empirical model based on surface measurements and supported by synoptic scale maps, which contributes significantly to the understanding of local atmospheric dynamics in the northern area of Baja California, Mexico.
The classification obtained in this study can serve as a basis for establishing a relationship between SAWs and their effect on primary productivity in the Gulf of California and the coastal region of the California Current in the areas influenced by SAWs.
This information can be used by companies that have installed wind turbines in the area of La Rumorosa for their operational purposes during the presence of SAWs, whose incidence, according to our results, is highest during January.
According to the studies reviewed, SAW events are winds that occur from September to April, most frequently in December. However, in this work, we identified that this phenomenon also happened in May in the years 2008, 2011, and 2014.
In the proposed classification for SAW events in La Rumorosa, the magnitude of the velocity of occurrence considered was 4 m·s-1. SAW events here behaved in a similar manner to those reported in studies in southern California, with corresponding variables of wind direction, relative humidity, and atmospheric pressure; this was not observed for the magnitude of the wind speed in La Rumorosa, which reached only up to 14% of strong events (classification b).
The wind classification shown in Table 2, with the exception of the range in intervals of 5 m·s-1, differ for the SAW categories from 4% to 9% for weak, from 1% to 10% for moderate, and from 1% to 4% for strong. Between 86% and 90% of classifications were weak and moderate SAWs, and 58% to 67% were moderate and strong, which directly impact the generation of electric wind power through the wind turbines placed in the region.
This confirms that the presence of SAW events increases the wind potential available in the region of La Rumorosa. According to a previous study, wind energy harnessing associated with these SAW events for the year 2012 represented 10% of the total wind production in a turbine of the wind farm La Rumorosa I (Zamora 2016).
Based on the obtained results, it is estimated that SAW events reach this region of Baja California with less strength. This can be attributed to natural obstacles, such as mountains and uneven terrain, that decrease their speed on their way to the Pacific coast. Understanding the dynamics of these winds is essential given the growth in the energy sector projected for La Rumorosa, that is, given the future installation of wind farms and the operation of current ones (NADB 2013, CEE 2017, IEnova 2022). Consequently, knowing the behavior and occurrence of these winds allows wind power plants to make management and projection decisions.
The methodology used in this study could be applied to other regions influenced by SAWs, such as the border region between Baja California and Southern California, where there are wind farms on both sides of the border: in the municipalities of Ensenada and Tecate in Mexico, and in Imperial, San Diego, and Riverside counties in the United States. Riverside County has one of the most important areas for harnessing wind power, the area of Palm Springs. Therefore, the relevance of this study to understand the dynamics of the winds and their energy contribution lies in processing the information from the databases to obtain mathematical models for the prediction of wind energy in the short term.


 texto em


