INTRODUCTION
Despite suffering a high degree of disturbance, urban wetlands in Mexico still provide refuge for a wide variety of bird species (Berlanga et al. 2019).
In the state of Tabasco, Mexico, there are 326 registered bird species (CONABIO 2021), which represent approximately a third of the species in the entire country, and a quarter of these are species with aquatic affinities that depend on wetlands for their survival (Ruiz-Campos et al. 2005, Mera-Ortiz et al. 2016). In the municipality of Centro, Tabasco, 35.9% of the surface belongs to some type of wetland (López 2019), but many of these wetlands have become surrounded by the accelerated urbanization in recent decades. One of these wetlands is Laguna de las Ilusiones, which was declared a Protected Natural Area in 1995 and is located within the city of Villahermosa (Ricárdez-de la Cruz et al. 2016, Secretaría de Gobierno 2019). However, the ecological conditions of the lagoon had already begun to change heavily since 1982 as a result of the input of domestic wastewater from the surrounding areas, which affected the water quality and caused lacustrine siltation (Ricárdez-de la Cruz et al. 2016); this has not changed despite its status as a Protected Natural Area. Its management plan was only recently published in the Periódico Oficial in 2019; it details the studies needed to be able to establish actions for its conservation that have not yet been implemented.
Increased urbanization and the isolation of the lagoon from its tributary Carrizal River have favored hypereutrophic conditions due to the input of organic and inorganic contaminants, and the introduction of opportunistic species (Sánchez et al. 2019, Salcedo et al. 2022). In addition to the above, hydrological changes in the lagoon can modify the composition of waterfowl, since high levels of flooding can cause morphological restrictions that affect the feeding success of wading birds (Castro-Tavares et al. 2015) or they can make foraging difficult for diving species that tend to avoid deep waters because of the risk of predation (Castro-Tavares et al. 2015). These anthropogenic alterations in the lagoon have not been documented, and it is important to assess their association with the composition and diversity of waterfowl at a spatiotemporal scale.
MATERIALS AND METHODS
Study area
Laguna de las Ilusiones (Fig. 1) is located in the north-central area of the city of Villahermosa, Tabasco (Secretaría de Gobierno 2019), in the metropolitan area of Villahermosa (Hansen et al. 2007). This lagoon is located on the plain of the Grijalva River (Secretaría de Gobierno 2019), with an area of 259.2 ha and a perimeter of approximately 41.0 km (Magaña 1988, Ricárdez-de la Cruz et al. 2016). The warm-humid climate predominates, with average annual temperature and precipitation of 28.1 °C and 233.8 mm, respectively (Secretaría de Gobierno 2019). There are 3 distinguishable seasons: rainy (June-November), nortes (December-March), and dry (April-June) (van Der Wal et al. 2012). The present study was carried out in 2020; during the months of strict quarantine due to the pandemic (April, May, June, and July), the necessary samplings could not be carried out, so the monitoring was reduced to 2 seasons: dry (January, February, and March) and rainy (August, September, October, November, and December).
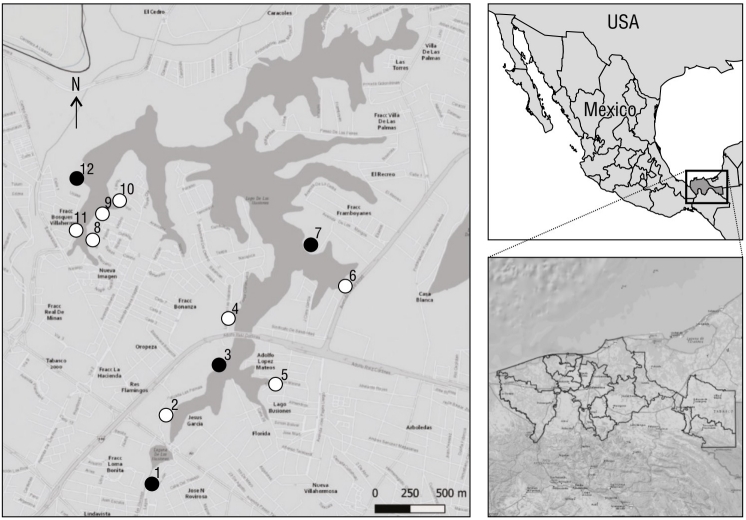
Figure 1 Map of the location of Laguna de las Ilusiones, Villahermosa, Tabasco, Mexico, and the location of the 12 monitoring sites. The black color indicates the non-urbanized sites (1, 3, 7, and 12); the white color, the urbanized sites (2, 4, 5, 6, 8, 9, 10, and 11).
The main sources of water are runoff and precipitation because of the isolation with its tributary, the Carrizal River (Hansen et al. 2007, Sánchez et al. 2019). The depth determined in this study varied from 0.50 to 2.80 m (average 1.86 m). The physicochemical parameters were taken at less than 0.50-m depth. The Cencali basin, located in Laguna de las Ilusiones, is one of the areas most affected by urban runoff and wastewater discharges (Hansen et al. 2007), where, according to ecotoxicological studies of the sediments, more than 65% of the aquatic life in the ecosystem is affected (Hansen et al. 2007).
Of the riparian vegetation, the tree species Andira galeottiana Standl., Inga vera Willd., and Ceiba pentandra (L.) Gaertn dominated. The hydrophilic vegetation is dominated by Typha latifolia L., Pontederia sagittata C. Presl, and Phragmites australis (Cav.) Trin. ex Steud. Secondary vegetation consists mainly of Hampea rovirosae Standl., Tabernaemontana alba Mill., and Malvaviscus arboreus Cav. Among the introduced species, Cocos nucifera L. stands out (Secretaría de Gobierno 2019); in addition, there are grassland species such as Panicum maximum Jacq. and Paspalum virgatum L. (Magaña 1988). The lagoon’s representative aquatic fauna includes manatees (Trichechus manatus Linnaeus), Morelet’s crocodiles (Crocodylus moreletii Duméril and Bibron) (Secretaría de Gobierno 2019), twoband cichlids (Vieja bifasciata Steindachner), and firemouth cichlids (Thorichthys meeki Brind) (Sánchez et al. 2019).
Bird sampling
Depending on their accessibility, 12 bird sampling sites were selected around the lagoon. The sites were separated by a distance of approximately 500.0 m (Ralph et al. 1996). Sightings were made on 2 consecutive days per month, and 2 contrasting climatic seasons were covered, the dry season (January, February, and March 2020) and the rainy season (August, September, October, November, and December 2020).
The fixed-point count method was used (Ralph et al. 1996). At each site, a count point was established without prefixing a radius, where all the individuals of each species seen were recorded for 15 min. Only birds perched on a surface of the habitat (natural element, water surface, or urban structure) were recorded, and birds in flight were not considered (Salido 2000). The sampling time was between 6:00 A.M. and 11:00 A.M., and binoculars (10 × 42 mm) were used to identify the birds.
We used the guides by Howell and Webb (1995), National Geographic (Dunn 2006), and Peterson and Chalif (2008) to identify the organisms recorded. The nomenclature and systematic arrangement of the species were determined according to the AOU (1998), currently the American Ornithological Society, and the supplements published in The Auk: An International Journal of Ornithology, such as 62 (Chesser 2021), 2009-C-2, 2010-C-9, and 2013-C-4. We based the classification of the feeding guilds of the recorded species on Arriaga-Weiss et al. (2008) and Wilman et al. (2014). The conservation status of the species was drawn from the NOM-059-SEMARNAT-2010 (SEMARNAT 2010). The temporality of the species was described according to Ruiz-Campos et al. (2005).
We calculated the community attributes using various ecological indices. We used the Chao2 index, which has minimal bias with small samples (Moreno 2001), and the Simpson dominance indices (Moreno 2001) for alpha diversity and the Bray-Curtis species similarity index for beta diversity, both between sites and between sampling months. To determine the species that typify the avian community, the biological value index proposed by Sanders (1960) was used; this considers the importance of species in terms of their abundance and spatiotemporal frequency.
At each site, we characterized landscape urbanization variables, physicochemical parameters of the lagoon, and the type of vegetation at the same time of day that the bird sightings took place, but with a one-day difference (Bolduc and Afton 2004). The estimated urbanization variables were the following: number of people in transit per minute (Germain et al. 2008), number of cars in circulation per minute (Germain et al. 2008), number and height of neighboring buildings within a radius of 20.0 m (Traut and Hostetler 2004), and the number of surrounding streets (Rojas et al. 2015) with their distance from the site. The categorization of landscape urbanization variables was verified in the field and represented using the QGIS v.3.16.13 software (QGIS 2021). Likewise, we determined the percentage of urbanization at each site with these 6 variables and with the number of trees, number of shrubs, and the type of cover (Fig. 1).
Land vegetation and aquatic vegetation were recorded within a radius of 5.0 m from the shore and estimated as a percentage. Likewise, the trees were counted and the percentage of tree cover was measured in a radius of 20.0 m (Germain et al. 2008), with GRS and spherical densiometers. Land vegetation was classified as tree canopy (hereafter canopy, >3.0 m height), underbrush (<0.5 m height), or grass (surface with native or induced grass) (Traut and Hostetler 2004). In addition, each tree and shrub were quantified; for grass, the proportion was calculated according to the surface covered in a radius of 20.0 m around the site. Aquatic vegetation was classified into floating, tall emergent (>1.0 m tall), and low emergent (<1.0 m tall) (Traut and Hostetler 2004). Finally, the type of substrate (structure or element of the habitat) on which each bird was found was recorded.
Landscape macrohabitats adjacent to the sampling sites were taken into account considering the following criterion: distinctive characteristics of the vegetation associations of the study area represent the landscape units (Murrieta-Galindo et al. 2013). According to the above, 3 macrohabitats were distinguished: (a) underbrush (sites with average values greater than 70% of area covered by underbrush); (b) boundary between trees and grass (sites with average values greater than 30% canopy, greater than 10% grass, less than 70% underbrush, and less than 70% aquatic vegetation); and (c) aquatic vegetation (sites with average values greater than 70% aquatic vegetation).
The physicochemical variables of the water of the lagoon were recorded in situ once per season (dry: January 2020; rainy: December 2020). To measure the depth in meters, a Hondex PS-7 echo sounder was used. Hydrogen potential (pH) was measured with a Hanna HI98107 portable potentiometer. The water temperature was recorded in degrees Celsius with a mercury thermometer, and the transparency of the water was recorded in meters with a Secchi disk (INVEMAR 2003). The measurements were made at ~1.0 m from the edge of the lagoon. The collection of sediment samples was carried out with the help of a Petersen-type dredge from a boat; to quantify the textural class, the Bouyoucos method was used (Barbeito and Bono 2006).
Data analysis
To determine the relationship between anthropogenic, vegetation, and physicochemical variables and the total abundance of species per macrohabitat, the trophic guilds, and the number of species per macrohabitat in the 2 seasons, a canonical analysis was used (Badii et al. 2007) with the statistical package PAST v.3.25 (Hammer et al. 2001).
RESULTS
During the months of monitoring, we recorded a total of 1,134 individuals of 25 waterfowl species belonging to 12 families and 8 orders. Of the species observed, 17 are permanent residents and 8 are seasonal visitors (Table 1). The species with the highest sighting frequency were Ardea alba, with 422 individuals; Egretta thula, with 180 individuals; and Butorides virescens, with 163 individuals. Spatula discors, Aramus guarauna, and Thalasseus maximus were the least common species, with 2 individuals each (Table 2).
Table 1 Record of waterfowl from Laguna de las Ilusiones during the dry season and the rainy season of 2020, where the abundance column indicates the number of individuals recorded for each species. The records indicate the number of months in which each species was recorded. Seasonality is classified as Rp = permanent resident and Ve = seasonal visitor; the NOM-059 classification is A = threatened and Pr = subject to special protection. The last column indicates the classification of the red list of the International Union for Conservation of Nature (IUCN R.L.), where all species are categorized as LC = least concern.
| Order | Family | Species | AOS name |
Abundance | Records | Food guild |
Seasonality | NOM-059 | IUCN R.L. |
| Anseriformes | Anatidae | Dendrocygna autumnalis | Black-bellied W histling-duck | 25 | 6 | Omnivore | Rp | LC | |
| Anseriformes | Anatidae | Spatula discors | Blue-winged Teal | 2 | 1 | Omnivore | Ve | LC | |
| Ciconiiformes | Ciconiidae | Mycteria americana | Wood Stork | 3 | 2 | Piscivore | Ve | Pr | LC |
| Suliformes | Phalacrocoracidae | Nannopterum brasilianum | Neotropic Cormorant | 54 | 8 | Piscivore | Rp | LC | |
| Suliformes | Anhingidae | Anhinga anhinga | Anhinga | 24 | 6 | Piscivore | Rp | LC | |
| Pelecaniformes | Pelecanidae | Pelecanus occidentalis | Brown Pelican | 6 | 2 | Piscivore | Ve | LC | |
| Pelecaniformes | Ardeidae | Ardea herodias | Great Blue Heron | 22 | 7 | Piscivore | Rp | LC | |
| Pelecaniformes | Ardeidae | Ardea alba | Great Egret | 422 | 8 | Piscivore | Rp | LC | |
| Pelecaniformes | Ardeidae | Egretta thula | Snowy Egret | 180 | 8 | Omnivore | Rp | LC | |
| Pelecaniformes | Ardeidae | Egretta caerulea | Little Blue Heron | 12 | 5 | Piscivore | Rp | LC | |
| Pelecaniformes | Ardeidae | Egretta tricolor | Tricoloured Heron | 17 | 5 | Piscivore | Rp | LC | |
| Pelecaniformes | Ardeidae | Butorides virescens | Green Heron | 163 | 8 | Piscivore | Rp | LC | |
| Pelecaniformes | Ardeidae | Nycticorax nycticorax | Little Blue Heron | 54 | 8 | Piscivore | Rp | LC | |
| Pelecaniformes | Ardeidae | Nyctanassa violacea | Yellow-crowned Night-heron | 2 | 2 | Piscivore | Ve | LC | |
| Accipitriformes | Pandionidae | Pandion haliaetus | Osprey | 2 | 2 | Piscivore | Ve | LC | |
| Gruiformes | Aramidae | Aramus guarauna | Limpkin | 2 | 1 | Omnivore | Rp | A | LC |
| Charadriiformes | Jacanidae | Jacana spinosa | Northern Jacana | 22 | 7 | Omnivore | Rp | LC | |
| Charadriiformes | Scolopacidae | Actitis macularius | Spotted Sandpiper | 12 | 6 | Piscivore | Rp | LC | |
| Charadriiformes | Scolopacidae | Calidris minutilla | Least Sandpiper | 3 | 3 | Piscivore | Ve | LC | |
| Charadriiformes | Laridae | Leucophaeus atricilla | Laughing Gull | 27 | 5 | Piscivore | Rp | LC | |
| Charadriiformes | Laridae | Hydroprogne caspia | Caspian Tern | 16 | 3 | Piscivore | Ve | LC | |
| Charadriiformes | Laridae | Thalasseus maximus | Royal Tern | 2 | 1 | Piscivore | Ve | LC | |
| Coraciiformes | Alcedinidae | Megaceryle torquata | Ringed Kingfisher | 18 | 6 | Piscivore | Rp | LC | |
| Coraciiformes | Alcedinidae | Chloroceryle amazona | Amazon Kingfisher | 17 | 5 | omnivore | Rp | LC | |
| Coraciiformes | Alcedinidae | Chloroceryle americana | Green Kingfisher | 27 | 7 | Piscivore | Rp | LC |
Table 2 Scores obtained from the biological value index (BVI) for the 8 months of monitoring (dry and rainy seasons) of the aquatic birds of Laguna de las Ilusiones. IMP/BVI corresponds to the order of importance according to the BVI score; IMB/ABT, the order of importance according to the value of total abundance; and ABT, the total abundance by species.
| Score matrix | IMP | |||||||||||
| 1 | 2 | 3 | 4 | 5 | 6 | 7 | 8 | |||||
| Species | January | February | March | August | September | October | November | December | BVI | IBVI | ABT | ABT |
| Ardea alba | 9 | 11 | 6 | 5 | 6 | 6 | 9 | 3 | 55 | 1 | 1 | 422 |
| Egretta thula | 8 | 10 | 5 | 4 | 5 | 5 | 8 | 2 | 47 | 2 | 2 | 180 |
| Butorides virescens | 7 | 9 | 4 | 3 | 4 | 4 | 7 | 1 | 39 | 3 | 3 | 163 |
| Nannopterum brasilianum | 6 | 8 | 3 | 2 | 3 | 3 | 6 | 0 | 31 | 4 | 4 | 54 |
| Nycticorax nycticorax | 5 | 7 | 2 | 1 | 2 | 2 | 5 | 0 | 24 | 5 | 4 | 54 |
| Leucophaeus atricilla | 5 | 6 | 1 | 0 | 1 | 2 | 5 | 0 | 20 | 6 | 5 | 27 |
Regarding their conservation status, 2 species are listed in the NOM-059-SEMARNAT-2010 (SEMARNAT 2010); Aramus guarauna is listed as threatened and Mycteria americana is subject to special protection (Table 1). The rest of the species are not cataloged in this official standard.
The highest number of sightings (n = 251), which were mostly of resident species, was recorded in December 2020, followed by February and March, with 155 and 152 sightings, respectively (Fig. 2). December corresponded to the rainy season; however, the lowest number of sightings was recorded in the rainy season (October, n = 87). Site 4 stood out as the site with the greatest number (n = 246) of sightings per sampling site (Fig. 3), followed by site 12 (n = 147); site 11 had the lowest number of sightings (n = 21). The total sampling effort invested in the 8 months of the study represented 96.0% of the accumulation of recorded species according to the Chao 2 estimator (Fig. 4).
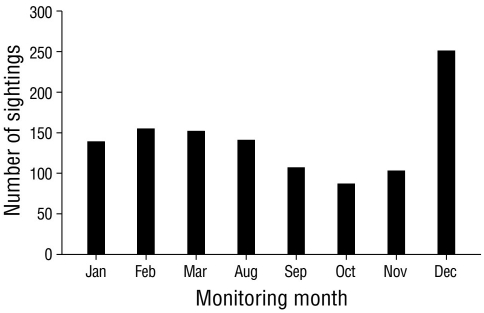
Figure 2 Sightings of waterfowl in Laguna de las Ilusiones, where the x-axis shows the months of bird monitoring, and the y-axis, the number of waterfowl sightings observed during 2020 (n = 1,134).
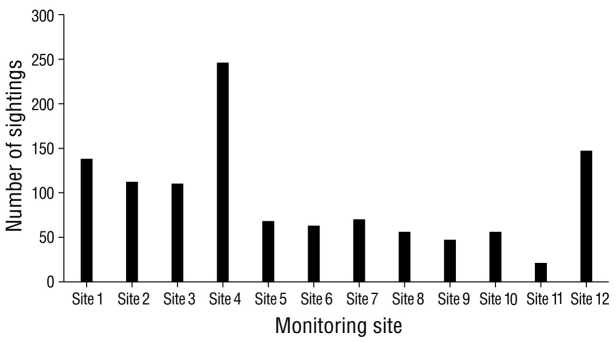
Figure 3 Sightings of waterfowl in Laguna de las Ilusiones, where the x-axis shows the bird monitoring sites and the y-axis shows the number of waterfowl sightings observed during 2020 (n = 1,134).
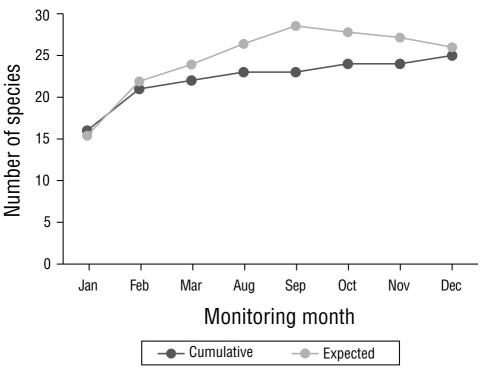
Figure 4 Species accumulation curve. Calculated data and expected data are shown, according to the Chao 2 estimator for the waterfowl of Laguna de las Ilusiones monitored during the dry and rainy seasons of 2020.
There were 2 noteworthy trophic guilds observed for the bird species, piscivores (n = 19 species) and omnivores (n = 6 species). The piscivorous guild was mainly represented by members of the Pelecanidae, Gruidae, Accipitridae, and Ciconiidae families, whereas the omnivorous guild was represented by members of the Ardeidae and Anatidae families (Table 1).
According to the results obtained with the Shannon index, the waterfowl community showed medium species diversity (H = 2.18 bits), whereas the Simpson index indicated low species dominance (D = 0.19). Species diversity for each season resulted in medium diversity for the dry season and low species diversity for the rainy season.
In the analysis of species diversity per monitoring site, site 12 had the highest species diversity compared to the remaining sampling sites. Site 4 had the lowest diversity compared to all other sampling sites (Fig. 5). Sites 6 and 7, which were located in the eastern portion of the lagoon, had the highest species similarity, with a value of 76.0% (Fig. 6). The pairs of sites 5-9 and 6-10 had values of 69.0% and 68.0%, respectively. In seasonal terms, the rainy season had the highest similarity of species; November and October had the greatest similarity (78.0%), followed by September and August (77.7%) and October and September (77.3%) (Fig. 7).
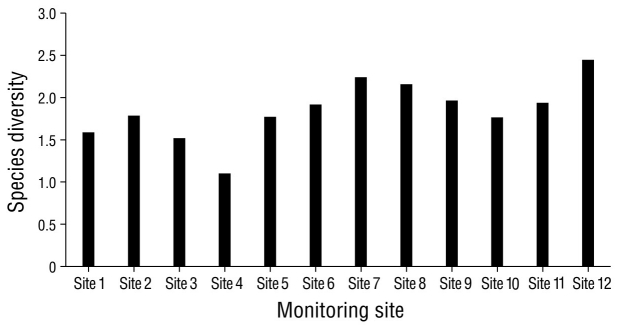
Figure 5 Diversity of waterfowl species in Laguna de las Ilusiones at the 12 sites monitored during the year 2020.
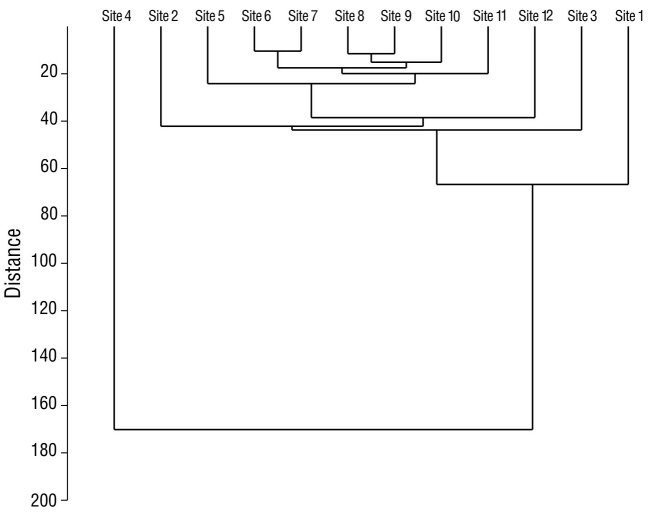
Figure 6 Similarity between waterfowl monitoring sites in Laguna de las Ilusiones, within the monitoring points, during the dry season and the rainy seasons in 2020.
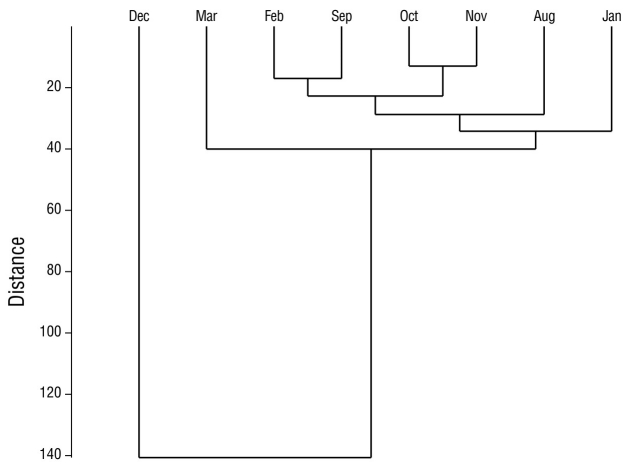
Figure 7 Similarity between months of waterfowl monitoring in Laguna de las Ilusiones during the dry season and the rainy season.
Considering the biological value index, the 6 most representative species, both in abundance and in their seasonal presence (dry and rainy), were Ardea alba, E. thula, B. virescens, Nannopterum brasilianum, Nycticorax nycticorax, and Leucophaeus atricilla (Table 2). The abundance of Ardea alba stood out with the first place in December (69.3%), followed by the abundance of E. thula in March (32.2%), and B. virescens in November (23.3%).
According to the urban variables recorded, site 3 had the highest number of people (9 people·min-1). The highest amount of car traffic was recorded for site 6 (51 cars·min-1). The greatest distance from surrounding streets was observed at site 12 (250.0 m). Sites 2 and 12 (91.6%) had the highest percentage of tree cover. Site 11 had the highest number of buildings (15). Houses with a height less than 5.0 m represented 8.3% of the cover, and houses with a height greater than 5.0 m represented 75.0% of the cover; 16.5% of the remaining cover had no buildings around it. Of the total number of sites monitored, sites 1, 3, 7, and 12 had an urbanization percentage of less than 50.0%, whereas sites 2, 4-6, and 8-11 added to more than 50.0% of urbanization.
Land vegetation at sites 3 and 10 had the highest presence of canopy (80.0%). Site 3 had the highest presence of underbrush (30.0%). Site 12 had the highest percentage of grass, with 65.0%. Regarding aquatic vegetation, site 12 was the only one that had floating leaves and tall emergent vegetation, with 10.0% of both types of hydrophytes. The highest percentage of low emergent vegetation was also observed at site 12 (10.0%), followed by site 6 (5.0%) and site 3 (3.0%), whereas the remaining sites did not show any type of aquatic vegetation. Site 4 had the highest number of trees (40 trees), in contrast to site 3, which had the highest number of shrubs (30 shrubs).
Aquatic vegetation (site 12) was the macrohabitat with the highest record of species (17), and this site also had the least amount of urbanization characteristics compared to the other sampling sites. However, the largest record of individuals (877) was obtained in the canopy-grass macrohabitat (sites 1-2 and 4-11) (Fig. 8). In the underbrush macrohabitat (site 3), most of the recorded individuals used artificial substrates; in the aquatic vegetation macrohabitat (site 12), most of the individuals made greater use of natural substrates (Fig. 8). The aquatic vegetation macrohabitat (site 12) had the largest number of species that made use of natural substrates; like the canopy-grass macrohabitat, it had a greater presence of birds that preferred natural substrates and a shallow water depth (Fig. 9). In the underbrush macrohabitat, most bird species preferred artificial substrates (Fig. 9).
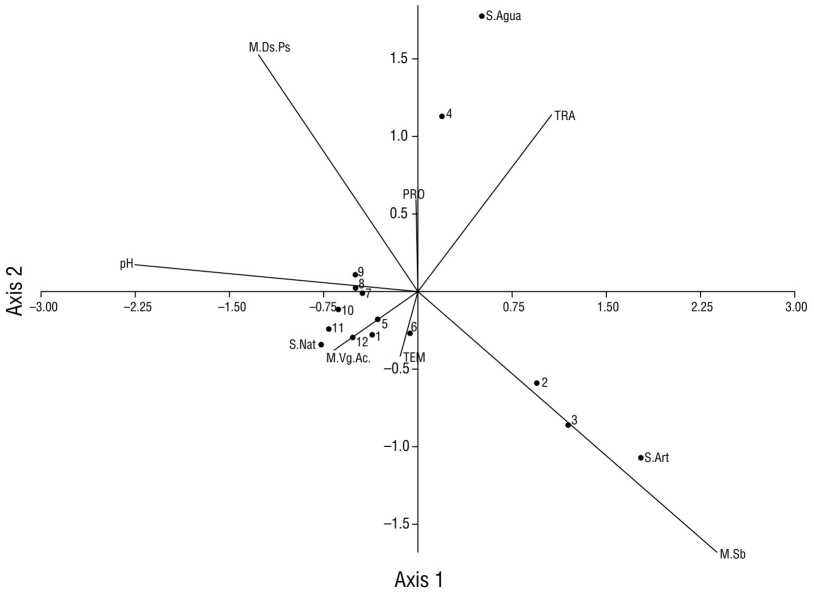
Figure 8 Scatter plot of the canonical correlation between the types of macrohabitats recorded in Laguna de las Ilusiones (letters with the initial M), the physicochemical parameters (capital letters), and the number of individuals of waterfowl on each type of substrate (letters with the initial S) recorded at each monitoring site (numbers from 1 to 12). M.Ds.Ps: canopy-grass macrohabitat; S.Agua: water substrate; TRA: transparency of water; PRO: water depth; TEM: temperature; S.Nat: natural substrate; M.VgAc: aquatic vegetation macrohabitat; M.Sb: underbrush macrohabitat.
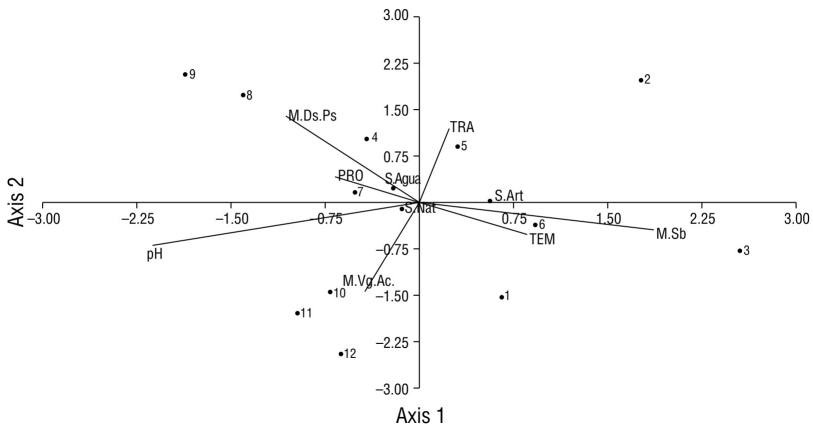
Figure 9 Scatter plot of the canonical correlation between the types of macrohabitats recorded in Laguna de las Ilusiones (letters with the initial M), the physicochemical parameters (capital letters), and the number of waterfowl species on each type of substrate (letters with the initial S) recorded at each monitoring site (numbers from 1 to 12). M.Ds.Ps: canopy-grass macrohabitat; S.Agua: water substrate; TRA: transparency; PRO: depth; TEM: temperature; S.Art: artificial substrate; S.Nat: natural substrate; M.VgAc: aquatic vegetation macrohabitat; M.Sb: underbrush macrohabitat.
Regarding the physicochemical parameters, the pH of the water remained from slightly basic to basic (7.7-8.9) in all monitoring sites and in both seasons. In the dry season, the highest water temperature in the lagoon was recorded at site 5 (25.90 °C); while the greatest transparency was recorded at site 6 (0.47 m), site 7 was the deepest (2.80 m). In the rainy season, the highest temperature was recorded at sites 5 and 7 (25.00 °C); regarding transparency, sites 4 and 7 had the highest measurement (0.60 m), and depth was greatest at site 7 (2.60 m) and the lowest at site 1 (0.50 m).
According to the canonical correlation analysis, the data fit the correlation model by 100%. The results of the analysis indicated that sites 1, 2, 4, 5, 7, 8, 9, and 11 have higher association with piscivorous birds and with a high percentage of urbanization (>39.0%) (Fig. 10). The guild of omnivorous birds at sites 3, 6, 10, and 12 had greater association with land vegetation (100%), the greatest cover of aquatic vegetation (>3.0%), and medium depths (1.80-2.10 m). Site 12 showed the highest association with basic pH (8.9), the lowest percentage of urbanization, and the highest species diversity (Fig. 10).
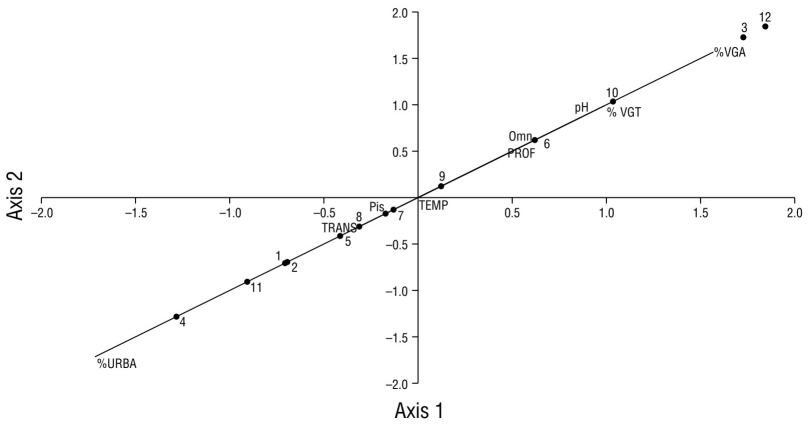
Figure 10 Scatter plot of the canonical correlation between variables (capital letters), waterfowl guilds (Pis = piscivorous, Omn = omnivorous), in Laguna de las Ilusiones, and monitoring sites (numbers). TEMP: water temperature; %VGA: percentage of aquatic vegetation; %VGT: percentage of land vegetation; PROF: water depth; TRANS: transparency of water; URBA: urbanization percentage.
DISCUSSION
In the avifaunistic community of Laguna de las Ilusiones, the most abundant species during an annual cycle in urbanized and non-urbanized sites were Ardea alba, E. thula, and B. virescens, species with generalist and resident habits. In 3 other lake habitats in the state (Valdez-Leal et al. 2015), Ardea alba has also been reported among the most common species.
In this study, 8.0% of the species recorded are cataloged in the Norma Oficial Mexicana 059 (SEMARNAT 2010), where Aramus guarauna stands out in the threatened category and Mycteria americana is subject to special protection. The rest of the species recorded are in the status of least concern on the red list of the International Union for Conservation of Nature (IUCN 2021).
This lagoon is an example of the permanent loss of connectivity with the rivers of a lagoon body caused by urban expansion (Palomeque-de la Cruz et al. 2017, Sánchez et al. 2019). This led to the hypereutrophication of the site, favored the presence of invasive species, and caused the loss of diversity of fish species, which are the main food source for piscivorous waterfowl (Hansen et al. 2007, Sánchez et al. 2019, Salcedo et al. 2022). Of the 2 recorded trophic guilds, piscivorous bird species were more abundant (19) than the omnivorous species (6). This condition could be due to a greater availability of fish, mainly in the coastal lake area, despite the fact that the fish populations in this lagoon are more affected by changes in their ecosystem (Gurnellet et al. 2014, Sánchez et al. 2019).
At sites 3, 6, 10, and 12, a greater association of omnivorous birds was observed (e.g., Ardea alba, B. virescens, Nannopterum brasilianum, and Nycticorax nycticorax). An intermediate depth was recorded at these sites. This was similar to the results of the study by Castro-Tavares et al. (2015), who observed that most guilds decreased in abundance when water depth increased.
Piscivorous birds (e.g., E. thula, Jacana spinosa, and Chloroceryle amazona) were more abundant at sites 1, 2, and 4. This was associated with a medium percentage of urbanization (50.0%) and medium depths (0.50-2.15 m); however, it can also be associated with high fish mortality, which occurs recurrently at these sites (Hansen et al. 2007) and can attract a greater number of individuals from this guild. This food accessibility by dead individuals can be attributed to hypertrophic conditions and pollutants (Salcedo et al. 2022).
The results obtained in the present study were similar to those in the studies by Ruiz-Campos et al. (2005) and Sánchez-Bon et al. (2010) carried out in coastal wetlands of northwestern Mexico, where a greater number of waterfowl species was reported in the winter months due to the arrival of migratory species. In the present study, the winter months (January to March) corresponded to the dry season. The similarity of species between months was higher during the rainy season because most of the species recorded during this season were permanent residents, unlike in the dry season, when there was a greater dynamism of species due to migration.
The lagoon had medium species diversity and low dominance, despite the fact that the 3 most sighted species represented 67.1% of all the species in the avian community. These were also the most common and representative species of the place, according to the Sanders biological value index.
The greatest similarity of species recorded by the Bray-Curtis index (sites 6 and 7) could be attributed to the fact that these species prefer to visit nearby sites as these sites do not share water physicochemical characteristics or urbanization characteristics. Unlike at sites 6 and 7, the high similarity recorded at sites 5 and 9 could be attributed to similar variables, the influence of a high percentage of urbanization, and low transparency of the water, just like at sites 6 and 10, where characteristics beyond proximity, such as a high percentage of land and aquatic vegetation, moderately alkaline pH, medium depth, and low water temperature could have influenced the species (Andrade et al. 2018).
During both seasons (rainy and dry), 12 species contributed 80.0% of the abundance of individuals in the ornithological community, and of these, the most important were Ardea alba, E. thula, and B. virescens.
The largest number of individuals occurred in February because of the addition of some seasonal species, such as Nyctanassa violacea, Pelecanus occidentalis, and Mycteria americana, which were observed at sites associated with urban areas (sites 8 and 9) and non-urbanized areas (site 12). Both Donaldson et al. (2007) and Burton (2007) pointed out that some species prefer urbanized places because food or vegetation cover for refuge or nesting are more available. In this sense, most bird species in urban environments have developed greater ecological plasticity, which makes them more tolerant to environmental changes (Abilhoa and Amorin 2017). However, undeveloped areas in the lagoon may represent refuges and breeding niches for sensitive species, particularly during the migration and wintering period, given the location of the wetland (Berlanga et al. 2019). At site 12, a greater diversity of species was observed; this site was characterized by lower urbanization and greater coverage of riparian (100%) and floating coastal aquatic vegetation (30.0%).
Of the sampling sites, site 1 had the highest number of sightings of generalist species, as some species respond positively to urbanization and wastewater discharges (Rosa et al. 2003), which have less transparent and deep water. In this regard, Kusch et al. (2008) pointed out that the diversity of aquatic birds in wetlands is related to the fluctuations of the water level.
We observed that the richness of bird species decreased with the proximity to streets and the increase of urbanization adjacent to the sampling sites, which is consistent with what was reported by Abilhoa and Amorin (2017). In this study, site 11, located in the northwest area of the lagoon, was distinguished by a high percentage of urbanization (55.0%) and by the lowest number of species (11) and sightings (21).
Conversely, site 12, located in the northeast area of the lagoon, had the highest number of species (17), which could be associated with the greater cover of aquatic vegetation, the flooded grassland, and the presence of minor artificial structures. This, in turn, can be associated with the fact that hydrophytic vegetation provides more food, shelter, and nesting space for species with limicolous or wading habits (Ruiz-Campos and Rodríguez-Meraz 1993).
The grass or tree cover mostly dominated the lagoon shoreline, which is why it was associated with a greater number of sites with the trees and grass macrohabitat. In this context, the trees and grass macrohabitat obtained the highest record of individuals because it was present at most sites.
In the underbrush macrohabitat at site 3, most of the birds used artificial elements. In the aquatic vegetation macrohabitat at site 12, the largest number of species was recorded; this is an area of value for migratory and resident species because birds use natural elements and it has not yet been affected by urbanization.
Studies in the lagoons in Villahermosa indicate that the populations of aquatic birds decrease because of anthropogenic activities (Rosado 2008). However, there are no previous studies for Laguna de las Ilusiones in this sense, which highlights the present contribution, since the management plan of the ecological reserve does not contain enough information about the avian fauna.
The results of this study highlight the importance of the lagoon as a key ecosystem in the city of Villahermosa since, despite the urban development that surrounds it, it still has sites with a lower percentage of urbanization and little alteration of the hydrophyte vegetation associated with a greater diversity of species. This was observed at site 12, where there are minor anthropogenic alterations, greater diversity of species, and scarce presence of generalist species. Conversely, both the greater record of generalist species and the greater number of individuals recorded at sites 1 and 4, respectively, may be associated with cyclical fish mortality, which decreases competition for food. Likewise, the greater use of artificial elements recorded at sites 2 and 3 may limit waterfowl in foraging and in the search for roosting sites.
Given this scenario, it is relevant to carry out actions in the short, medium, and long term for the conservation of this urban wetland and the recorded species. Bird-watching should be promoted, more studies of the birdlife should be done, and the actions suggested in the Management and Conservation Program of the Laguna de las Ilusiones Ecological Reserve should be implemented (Secretaría de Gobierno 2019, Ricárdez-de la Cruz et al. 2016) to stop urban expansion in the lagoon and, thus, ensure the conservation of the recorded species.


 texto em


