


 nova página do texto(beta)
 Inglês (pdf)
 Artigo em XML
 Referências do artigo
 Enviar este artigo por email
 Citado por SciELO
  Similares em
SciELO
Similares em
SciELO 
 Permalink
1. Introduction
On January the 30th 2020, the World Health Organization declared the outbreak of COVID-19 to be a Public Health Emergency of International Concern1. This made governments and nations impose certain measures to stop contagions of the virus. Lockdowns, social distancing, travel restrictions, border shutdowns, orders to stay at home, and the use of face masks are some of the multiple actions that were applied in the world2.
The COVID-19 pandemic has constituted one of the most important global phenomena in the past decades and it is still affecting most of the world. To date, it has been registered almost 5.5 million deaths and more than 300 million people have been infected3. Moreover, this phenomenon has had environmental impacts such as enhanced air and water quality in urban areas due to lockdowns, and shoreline pollution due to the disposal of sanitary consumables4. There have also been negative social impacts such as mental health problems due to isolation and uncertainties5.
The COVID-19 pandemic has affected all economic sectors and has precipitated the worst global recession in decades6. Moreover, due to the measures imposed worldwide, certain economic sectors resulted more affected than others: restrictions in mobility affected demand of oil and gas and led to heavy losses in the industries of tourism and transportation7. Quarantine reduced the production and consumption of goods, affecting the financial industry8. The accelerated number of contagious at the start of the pandemic represented a big challenge for the health care services9. Nowadays, the pandemic still represents huge economic challenges for some countries in the world.
At the firm level, the COVID-19 outbreak has affected the stock market and the firm performance10. The world’s largest firms are crucial units of production and accumulation of capital. Recall that a public company or publicly-traded company is a company that offers its securities (like shares, bonds, loans, among others) for sale to the general public. The current pandemic negatively impacted the sales and the number of employees of these companies11. Here we analyze its impact on top publicly-traded firms.
2. Two-class structure: Exponential and Pareto distributions
The data was collected from the annually published list of the two thousand large big publicly traded corporations from Forbes Magazine (G-2000) for the years 2015, 2020 and 202112. The data was obtained from April 2019 to April 2020 for the year labeled as 2020 and from April 2020 to April 2021 for the year labeled as 2021. We rank these companies according to sales divided per the number of employees in each company to obtain a metric of the wealth per capita. These databases could be expanded in the future.
It is useful to analyze the time evolution of the statistical results over a period before the pandemic onset years 2020-2021. At least, one year before the pandemic is a good start, although it is desirable to analyze the Forbes dataset for more years. We chose the corresponding dataset of 2015, because in Ref.13 we published some results of that year.
The three graphs in Fig. 1 show the Complementary Cumulative Distribution Functions (CCDF) of G-2000 for the years 2015, 2020 and 2021. These panels exhibit two dominions represented by almost straight lines in log-linear scales (insets) and log-log scales.
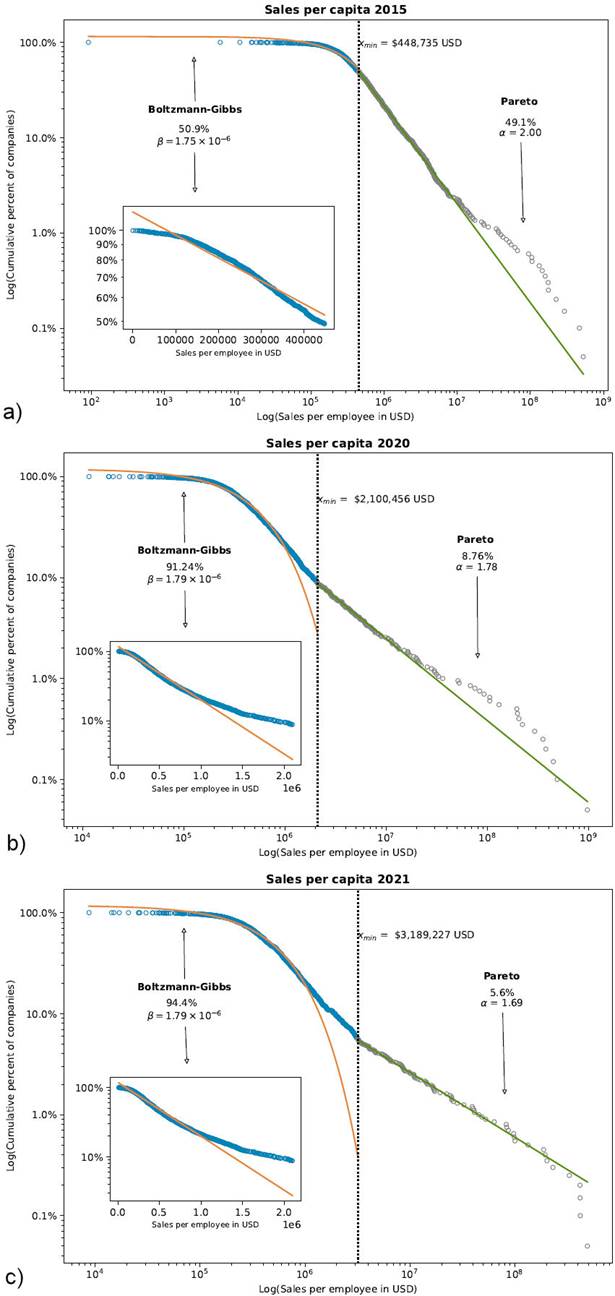
Figure 1 CCDFs of G2000 for 2015, 2020 and 2021. Sizes are normalized by the number of employees (size per capita) for sales. Almost straight line curves in both log-linear scale (insets) and loglog scale in the main panel illustrate approximate exponential and Pareto power laws, respectively. Cut-off’s values x min are shown, as well as the (( and (( parameters and the percentage of enterprises for each part.
The lower part of the distribution illustrates an exponential behavior analogous to the Boltzmann-Gibbs distribution
On the other hand, the upper part resembles a power law function (Pareto distribution)
α and β are adjustable parameters. Figure 1 also shows the cut-off’s value xmin for all three panels. The exponential function was fitted below xmin, while the Pareto distribution was adjusted above xmin. To determine xmin, a programming code based on the work of J. Alstott14,15 on power-law distributions using the Kolmogorov-Smirnov test was implemented. This function implements both the discrete and continuous maximum likelihood estimators for fitting the power-law distribution to data, along with the goodness-of-fit based approach to estimate the lower cut-off for the scaling region. The fundamental idea behind this method is simple and involves choosing the value of xmin that makes the probability distributions of the measured data and the best-fit power-law model as similar as possible above this value. There are a variety of measures for quantifying the distance between two probability distributions, but for non-normal data the commonest and the one used in our code, is the Kolmogorov-Smirnov statistics14,15, which is simply the maximum distance between the cumulative distribution functions (CDF) of the data and the fitted model:
With O(x) the CDF of the data for the observations with value at least xmin, and P(x) is the CDF for the power-law model that best fits the data in the region. Our minimum income estimate is then the value of xmin that minimizes D17.
Table I shows the adjustment parameters for the distribution of sales per capita for the three sets of G-2000 as well as the corresponding squared pearson correlation coefficients R 2. In 2015, 50.9% of the companies followed an exponential behavior. However, this percentage increased with time since in 2020 and 2021, 91.2% and 94.4% of the companies were well adjusted to the exponential function respectively. This indicates that fewer and fewer companies are adjusted to the Pareto part over time. On the other hand, the cut-off’s values increase from 448,735.01 USD in 2015 to 3,189,227.4 USD in 2021, meaning that in the span of six years, it emerged a difference of the xmin value by almost a factor of seven.
Table I Adjustment parameters for the distribution of sales per capita of G-2000 2015, 2020 and 2021, as well as the corresponding squared pearson correlation coefficients R 2
| Dataset | Exponential | Pareto | ||||
|---|---|---|---|---|---|---|
| xmin | % of Companies | β | R2 | β | R2 | |
| 2015 | $448,735.01 | 50.9% | 1.75 × 10⁻⁶ | 0.978 | 2.00 | 0.999 |
| 2020 | $2,100,456.6 | 91.2% | 1.79 × 10⁻⁶ | 0.994 | 1.78 | 0.998 |
| 2021 | $3,189,227.4 | 94.4% | 1.79 × 10⁻⁶ | 0.994 | 1.69 | 0.998 |
The parameter α (or scaling parameter) of the Pareto distribution decreases over time between the values of 2 and 1.69 for the three sets, while the parameter β of the Boltzmann-Gibbs distribution shows very small changes. The squared Pearson’s correlation coefficients are above 0.99 for all cases except for the exponential distribution of the year 2015 for which it is 0.978. The decrease in time of the slope scaling parameter can be seen in Fig. 2. Larger values produce fatter tails indicating more spread values in the high region of the distribution. So our results indicate that there is a trend with time to have less spreading values of the sales per employee distribution in the Pareto high region. This is an important empirical result which deserves further research regarding its causes.
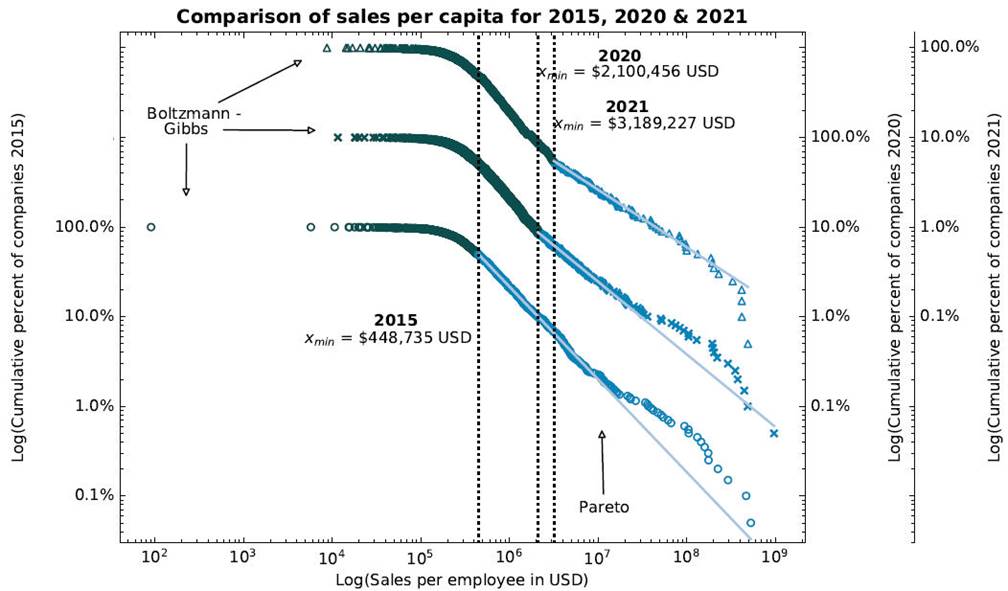
Figure 2 Comparison of G-2000 CCDFs for 2015, 2020 and 2021. Sizes normalized by the number of employees (size per capita). Cut-off’s values xmin are displayed. Y-axes in the right were scrolled to appreciate differences. High-region straight lines show perfect Pareto behavior.
The different cut-off’s values for 2015, 2020 and 2021 (Fig. 2) exhibit big changes. Between 2015 and 2021, xmin grows more than 7 times and between the years 2020 and 2021 xmin grows 50%. The growth rates in the years analyzed indicate that the exponential model with conservation of money becomes more predominant over the years as shown in Table I, since more firms are included in the exponential distribution. We believe that this behavior is the result of an increasing globalized behavior of the top firms with time since, according to the econophysics model we will discuss here, the exponential distribution comes from a money-conserved commerce model amongst agents (firms in this case).
Notice that in more recent years the number of outliers located at the very right side of Fig. 2 decreases, which indicates that the Pareto model improves with time. Then, obviously the corresponding squared pearson correlation coefficient R2 gets better when these outliers are removed as shown in Table II. We list the corresponding outliers list in the Appendix.
Table II Outliers with their corresponding percentage of companies and squared pearson correlation coefficientc R2 with and with-out outliers.
| Dataset | Outliers | % | Original R2 | R2 without outliers |
|---|---|---|---|---|
| 2015 | 26 | 1.3% | 0.9996 | 0.9997 |
| 2020 | 19 | 0.95% | 0.9989 | 0.9996 |
| 2021 | 10 | 0.5% | 0.9989 | 0.9996 |
Table III shows the total sales and the total number of employees of the companies that were adjusted to the Pareto and exponential distribution for the three years. In all cases, the companies that were adjusted to the Pareto distribution have fewer employees and fewer revenues over the course of the years. Between 2015 and 2020, the corresponding number of employees dropped almost 20 times while sales dropped 4.65 times. Between 2020 and 2021, there is a 3.5 times reduction in the number of employees and sales were halved. On the contrary, the exponential part doubled sales from 2015 to 2020 while the number of employees increased 14.59%; between 2020 and 2021 a similar proportion in employees and sales was maintained.
Table III Number of total employees and total sales, as well as their respective percentage for exponential and Pareto distributions
| Data set | Exponential | Pareto | ||||||
|---|---|---|---|---|---|---|---|---|
| Sales (USD) | Employees | Sales (USD) | Employees | |||||
| % | Total | % | Total | % | Total | % | Total | |
| 2015 | 37.76% | 1.47×10¹³ | 72.95% | 6.68×10⁷ | 62.24% | 2.42×10¹³ | 27.05% | 2.48×10⁷ |
| 2020 | 87.72% | 3.71×10¹³ | 98.75% | 9.75×10⁷ | 12.27% | 5.20×10¹² | 1.24% | 1.23×10⁶ |
| 2021 | 94.39% | 3.75×10¹³ | 99.63% | 9.58×10⁷ | 5.61% | 2.23×10¹² | 0.36% | 3.51x10⁵ |
The domiciles of the employees in the G-2000 include practically all countries in such a way that they form a kind of global capillary system, so to account for the two-class statistical distribution involving a fraction of employees all over the world, one should relate employee income to the per capita wealth of the company in a general overview. Now we have to mention a sort of surprising result. The two-class structure of sales employee (per capita) shown here is similar to income distributions found in many countries, although at first view firms per capita and income distributions are different topics. We will see that this analogy can be explained imagining that a fraction of a firms’ wealth is obviously distributed to its employees mostly in the form of wages and salaries. It is interesting that despite this fraction can vary greatly according to the characteristics of the company and the domicile of the employees, the data per employee or per capita gives the same general qualitative two-class income features found in individual countries and blocks13, as shown in next section.
3. Analogies between income and sales per capita distributions
As for the econophysics literature, the distribution of income and wealth of individuals, households, and firms have been studied extensively in recent years18-21, highlighting a particular feature of these distributions: a two-class structure. The lower part of the distribution is fitted with exponential-like functions. Therefore, it is possible to make the analogy with the exchange of energy among atoms and molecules in an ideal gas with the money that is distributed among individuals or firms of the numerous businesses that occur daily in the economic system. In addition, the principle of conservation of energy can be transposed to money, if it is considered exclusively at the local level and over sufficiently small periods, thus ruling out inflation and currency depreciation that occur in the long term. This allows the use of thermodynamic tools and statistical mechanics for the study of economic systems22-24.
On the other hand, the upper part is usually fitted with Pareto power-law functions. Here, the principle of money conservation is usually violated and there may be money creation through different and more complex mechanisms, such as investments, credits, financial derivatives, and the rise or fall of the stock market. In this region, the Pareto distribution is associated with non-linear phenomena and its parameters and characteristics are completely non-stationary and fluctuating over time25-27.
In particular, Soriano-Hernández et al. analyzed the distribution of wealth per capita, for the two thousand most important companies in the world published by Forbes magazine (G-2000) for the year 2015, based on the metrics of sales, profits, assets, and market value13. In their work, the authors found that there is this two-class structure in the wealth distributions per employee for the four metrics.
4. Industries and pandemic effects
To get some pandemic global effects, now we analyze some changes between 2020 and 2021. Forbes classified companies in 27 industries in these years. Table IV shows this classification for both years, the number of companies corresponding to each industry and the corresponding percentage of companies.
Table IV Industries with their total number of G-2000 companies and corresponding percentage of companies.
| Industry | 2020 | 2021 | ||
|---|---|---|---|---|
| Companies | % | Companies | % | |
| Aerospace & Defense | 24 | 1.2 | 20 | 1 |
| Banking | 295 | 14.75 | 291 | 14.55 |
| Business Services & Supplies | 83 | 4.15 | 85 | 4.25 |
| Capital Goods | 57 | 2.85 | 61 | 3.05 |
| Chemicals | 56 | 2.8 | 64 | 3.2 |
| Conglomerates | 32 | 1.6 | 33 | 1.65 |
| Construction | 137 | 6.85 | 135 | 6.75 |
| Consumer Durables | 87 | 4.35 | 89 | 4.45 |
| Diversified Financials | 141 | 7.05 | 135 | 6.75 |
| Drugs & Biotechnology | 74 | 3.7 | 75 | 3.75 |
| Food Markets | 32 | 1.6 | 32 | 1.6 |
| Food, Drink & Tobacco | 79 | 3.95 | 83 | 4.15 |
| Health Care Equipment & Services | 46 | 2.3 | 51 | 2.55 |
| Hotels, Restaurants & Leisure | 23 | 1.15 | 22 | 1.1 |
| Household & Personal Products | 34 | 1.7 | 32 | 1.6 |
| Insurance | 114 | 5.7 | 114 | 5.7 |
| IT Software & Services | 70 | 3.5 | 82 | 4.1 |
| Materials | 89 | 4.45 | 97 | 4.85 |
| Media | 25 | 1.15 | 24 | 1.2 |
| Oil & Gas Operations | 100 | 5 | 84 | 4.2 |
| Retailing | 73 | 3.65 | 70 | 3.5 |
| Semiconductors | 32 | 1.6 | 33 | 1.65 |
| Technology Hardware & Equipment | 60 | 3 | 59 | 2.95 |
| Telecommunications Services | 50 | 2.5 | 53 | 2.65 |
| Trading Companies | 34 | 1.7 | 33 | 1.65 |
| Transportation | 72 | 3.6 | 61 | 3.05 |
| Utilities | 81 | 4.05 | 82 | 4.1 |
The number of companies in each industry does not vary significantly between both years. The most considerable variations lay in Oil & Gas Operations with 16 fewer companies from 2020 to 2021 and IT Software & Services with 12 more companies. Similarly, Transportation had 9 fewer companies and the industries of Chemicals and Materials had 8 more companies.
In Fig. 3 and 4 we show two horizontal bar plots of total sales and the total number of employees per industry for the years 2020 and 2021.


As it can be seen in Fig. 3, the top industries in both years are Oil & Gas Operations and Banking. However, Oil & Gas Operations had a 29.82 percent reduction in its aggregated sales, moving from the leading position in 2020 to the second position behind the Banking industry in 2021. On the other hand, despite a 7.18 percent reduction in Banking sales, it is the industry with the most sales in 2021 with 3.76x10¹² USD.
In the period from 2020 to 2021, the industries with the biggest losses are Hotels, Restaurants & Leisure, Oil & Gas Operations, and Transportation. On the contrary, the industry of Semiconductors had the biggest increase in sales, followed by the industry of IT Software & Services and Retailing.
4.1 Change in sales of most affected industries by country in 2020 and 2021
Given that there were industries that reported the highest or lowest sales losses between 2020 and 2021, then we grouped companies belonging to some industry by the country where they are headquartered. Although most of the companies operate worldwide, this way of grouping firms can give an idea of how sales by country have changed in the most affected industries.
4.1.1. Hotels, Restaurants & Leisure
This industry had a loss of 38.08% between 2020 and 2021. In 2020 there were 6 top countries in this industry, including the USA, UK, China, Canada, France, and Hong Kong. While in 2021 there are 7 countries: USA, UK, China, Ireland, Canada, Hong Kong, and Sweden. The territory Hong Kong (labeled in Forbes as a country) had the biggest losses with a 71 percent reduction in its total sales. This is because this country has only one company in G-2000 for both years named Galaxy Entertainment which is a developer and operator of entertainment and resort facilities.
After Hong Kong, the country with the most losses is the United States which reduced its sales by 45.4%. Notice that most of the companies of this industry belong to the USA. While restaurant companies like McDonald’s and Starbucks remain in the first places with the biggest sales and few losses; hotels, cruise operators and resorts reported a considerable decrease in sales between 2020 and 2021 (Fig. 6). These companies had a decrease in sales up to 96% (Carnival) and other companies do not even appear in G-2000 2021. Chipotle Mexican Grill, Yum! Brands and Domino’s Pizza are the only companies that registered an increase in sales. Finally, Penn National Gaming (casinos and racetracks) and Royal Caribbean Group (cruise operator formerly known as Royal Caribbean Cruises Ltd) appear for the first time in 2021.
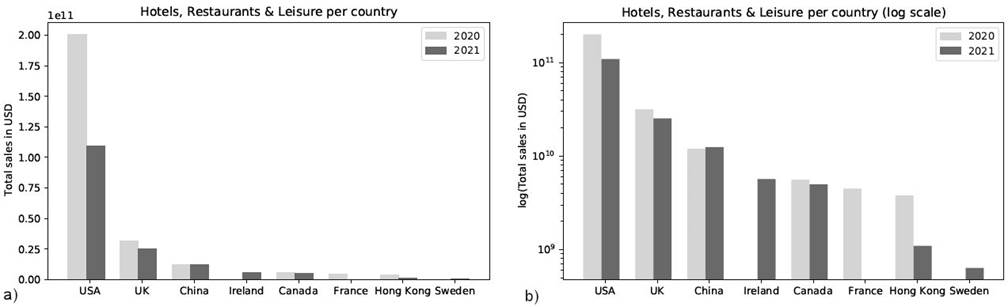
Figure 5 Hotels, Restaurants & Leisure industry grouped by country in linear (left) and log (right) vertical scales.

The United Kingdom is the third country with the biggest losses (20%) with only one company named Compass Group (contract food service). Finally, China presented a 4.2% increase in its sales with two companies. Yum China Holdings (restaurant) and Haidilao International Holding (cuisine restaurant brand) both reported sales increases.
4.1.2. Oil & Gas Operations
This industry reduced its total sales by 29.82% between 2020 and 2021. Interestingly, all countries presented losses in this period (Fig. 7). The corresponding countries with the biggest decrease in their sales are Australia (-85%), the Netherlands (-45%), Italy (-38%), and Colombia (-38%).
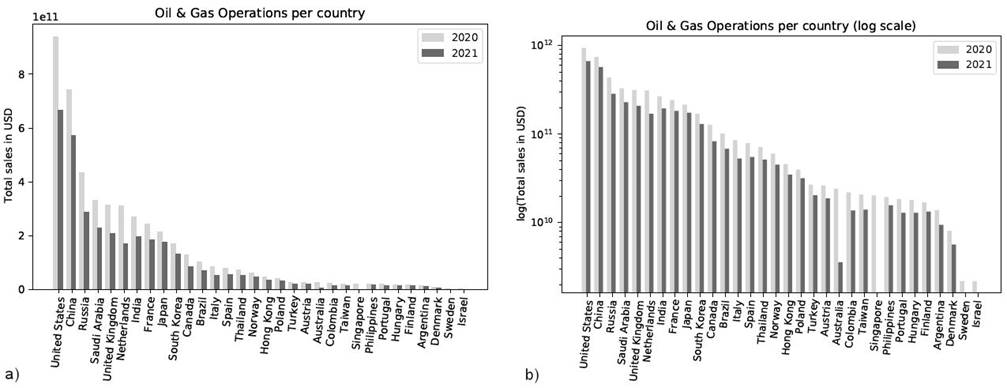
Figure 7 Oil & Gas Operations industry grouped by country in linear (left) and log (right) vertical scales.
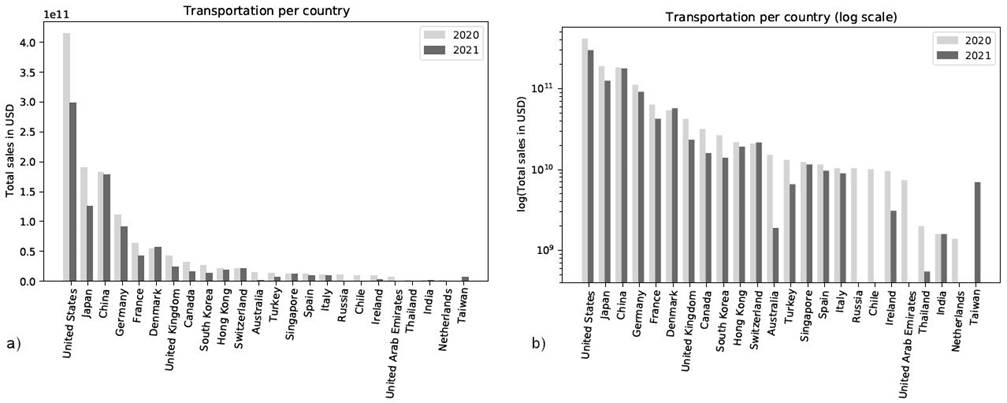
Figure 8 Transportation industry grouped by country in linear (left) and log (right) vertical scales.
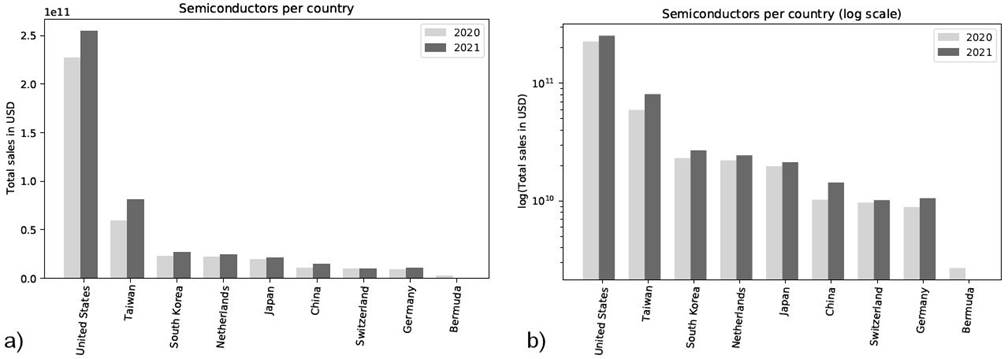
Figure 9 Semiconductors industry grouped by country in linear (left) and log (right) vertical scales.
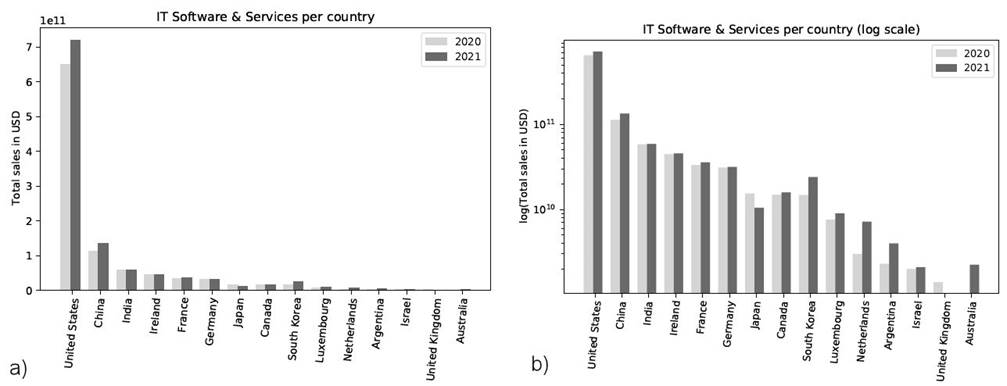
Figure 10 IT Software & Services industry grouped by country in linear (left) and log (right) vertical scales.
In the case of Australia, three companies were listed in 2020: Woodside Petroleum (natural gas producer), Santos (oil and gas producer), and Caltex Australia (petroleum brand property of Chevron Corporation since 2020). However, in 2021 only appears the first one with reported losses of 26.5%. In the Netherlands, there is only one company, Royal Dutch Shell (oil and gas company) which had losses of 45%. Italy had three companies in 2020: Eni (oil and gas company), Snam (energy infrastructure company), and Saipem (oil and gas company); for 2021 only Eni and Snam are listed. Finally, in the case of Colombia, Ecopetrol (petroleum company) is the only company belonging to this country with reported sales of 38%.
4.1.3. Transportation
This industry had a decrease on its total sales by 25.69%. The biggest losses are reported in Australia (-88%), Thailand (-72%), Ireland (-68%), and Turkey and Canada which halved their sales.
Australia had two companies in 2020: Transurban Group (road operator company) and Quantas Airways (flag carrier), in 2021 only appears the first one with a decrease of 32% on its total sales. For the case of Thailand, its only company, Airports of Thailand, had a decrease of 72.5% on its sales. Ryanair Holdings (low-cost carrier), the only company listed in Ireland, reported a decrease of 67.7%. Turkish airlines reduced its sales in 49.2%. Finally, in the case of Canada, three companies were listed in 2020: Canadian National Railway, Canadian Pacific Railway and Air Canada (flag carrier). In 2021 only the first two companies appear with few losses while Air Canada is not listed in the G-2000 of 2021.
4.2. Change in sales of less affected industries by country in 2020 and 2021
4.2.1. Semiconductors
This is the industry with the greatest increase in sales (15.7%) between these years. Most of the companies are headquartered in the US and had a 12% increase from 2020 to 2021. However, China, Taiwan and Germany were the countries with the biggest increase in sales with 40, 36 and 19 percent respectively.
In the case of China, three of the four companies increased their sales, except for Montage Technology (high-performance IC-based solutions for cloud computing and data center markets) which does not appear in the 2021 list. Xinyi Solar Holdings (solar cell, controller and inverter) only appears in 2021.
In the case of Taiwan, sales increased in the three companies listed in 2020 and in 2021 appeared a new firm, United Microelectronics (semiconductor company). Finally, the only company in Germany was Infineon Technologies (semiconductor solutions) which had a 19% increase in sales.
4.2.2. IT Software & Services
This industry had an increase of 10.9% in sales between 2020 and 2021. Most of the companies are headquartered in the US. In this country, sales increased 11% and the most profitable companies are Alphabet (conglomerate holding company and parent company of Google), Microsoft (technology corporation) and Facebook (technology company).
The case of Argentina is interesting since revenues increased 74% due to the only company headquartered there, Mercado Libre (e-commerce and online auctions). South Korea increased its sales 63%. In 2020 two companies were headquartered in this country: Samsung SDS (provider of IT services) and Naver (online platform) which did not exhibit strong variations in their sales. However, two new companies were included for 2021: Kakao (Internet company) and Daou Data (IT consulting and solution services).
In the case of China, Tencent Holdings (technology conglomerate holding company) remains the most profitable company in both years with sales increasing 12.7%. Baidu (internet-related services and products and artificial intelligence), NetEase (online services) and East Money Information (financial and stock information website provider) remain in both lists while 5 companies do not appear and other 5 companies were added to the 2021 list.
4.2.3. Retailing
This industry had an increase in sales of 8.3% between 2020 and 2021, and the companies headquartered in the USA have the largest amount of sales. Walmart and Amazon lead the list of this country and their sales increased 6.7% and 30% respectively. However, companies headquartered in South Korea, China, and Germany are the ones with the biggest increase.
In South Korea, Lotte Shopping (shopping center) and E-mart (discount store chain) increased their revenues, while Coupang (e-commerce company) appears in 2021. In the case of China, all companies remain in both lists except for Shanghai Yuyuan Tourist Mart (department stores and entertainment shops) which only appears in 2021. Finally, in Germany, three companies appear in both lists with increasing revenues in 2021, and a fourth also appears in 2021.
On the other hand, UK has less companies in 2021 than in 2021: in 2020 there were 6 companies Next (clothing), Inchcape (automotive distribution), Marks & Spences (clothing, home, and food products), Kingfischer (home products), and Dixons Carphone (telecommunications retailer); only the last two appear in 2021 with a new company JD Sports Fashion (sports-fashion retail). In Spain there is only one company in both years, Inditex (textile design company). Sweden and Philipines have one company each Hennes & Mauritz (clothing company) and SM Investment (mall development and management), respectively; both presented losses. Finally, in Mexico, two companies appear in 2020: Grupo Elektra (financial and retailing corporation) and El Puerto de Liverpool (department store) which does not appear in 2021.
Since retailing covers a wide range of companies such as e-commerce, department stores, and supermarkets, then it would be interesting to have a notion of the type of industries with the best and worst performance. Using the companies that appear for 2020 and 2021, the ones with the biggest increase in total sales are Pinduoduo (agriculture-focused technology platform headquartered in China), Wayfair (e-commerce headquartered in the USA), Chewy (pet food and pet-related products headquartered in the USA), Delivery Hero (online food-delivery service headquartered in Germany), and Amazon (e-commerce headquartered in the USA). On the other hand, the companies with the biggest decrease in total sales are Macy’s (department store headquartered in the USA), Inditex (clothing company headquartered in Spain), TJX Cos (department store headquartered in the USA), H&M Hennes & Mauritz (clothing company headquartered in Sweden), and Ross Stores (discount department store headquartered in the USA).
In this industry, we have mixed results since some countries increase their sales (USA, China, South Korea, Brazil), while others decrease them (United Kingdom, Spain, Sweden, Mexico, Philippines) building a mixed behavior per country. It would be convenient to research why Retailing industry exhibits this behavior when those firms in our dataset are grouped by country as shown in Fig. 11. However, when we analyzed separately the different Retailing sectors we found that most of the companies with a decrease in sales were department stores and clothing companies. Several studies point out that during the COVID-19 pandemic, people do not consider clothing as a priority28. Also, concerns over in-store shopping, resale or rental services, and shipping generated significant disruptions in clothing behavior at the beginning of the pandemic29. There are other studies that indicate that sales increased in large supermarkets and decreased in department stores30, and that sales in non-essential products (department stores, restaurants, entertainment, home improvement, professional and personal services) fell significantly31. Nevertheless, more comprehensive research is needed including more companies (not only the top ones analyzed here).

4.3. Industries’ performance
Table V shows the sales per capita for the six industries analyzed in the previous section. The data was obtained by dividing the total sales of an industry by the total number of employees. This information can give an insight into the industries’ performance during these years.
Table V Sales, employees and sales per capita of the most and less affected industries between 2020 and 2021.
| Industry | 2020 | 2021 | ||||
|---|---|---|---|---|---|---|
| Sales (USD) | Employees | Sales per capita | Sales (USD) | Employees | Sales per capita | |
| Hotels, Restaurants & Leisure | 2.58×10¹¹ | 3.09×10⁶ | 8.35 ×10⁴ | 1.59×10¹¹ | 2.45×10⁶ | 6.65×10⁴ |
| Oil & Gas Operations | 4.82×10¹² | 4.08×10⁶ | 1.18×10⁶ | 3.38×10¹² | 4.06×10⁶ | 8.32×10⁵ |
| Transportation | 1.26×10¹² | 4.17×10⁶ | 3.02×10⁵ | 9.40×10¹¹ | 3.79×10⁶ | 2.47×10⁵ |
| Semiconductors | 3.83×10¹¹ | 7.46×10⁵ | 5.13×10⁵ | 4.43×10¹¹ | 8.12×10⁵ | 5.46×10⁵ |
| IT Software & Services | 9.92×10¹¹ | 3.83×10⁶ | 2.58×10⁵ | 1.10×10¹² | 4.15×10⁶ | 2.64×10⁵ |
| Retailing | 2.67×10¹² | 8.91×10⁶ | 3.00×10⁵ | 2.90×10¹² | 9.11×10⁶ | 3.18×10⁵ |
The most negatively affected industries (first three rows) had a decrease in their sales per capita, while the next industries (last three rows) increased this value. The industries of Hotels, Restaurants & Leisure, Oil & Gas Operations, and Transportation were severely affected during the COVID-19 pandemic, with a decrease in sales, employees and sales per capita in 2021 (which, according to Forbes, corresponds from April 2020 to April 2021). During this time most countries had restrictions in mobility causing a temporal closure in hotels, resorts and cruises and a temporal reduction in oil and gas demand.
On the other hand, the industries of Semiconductors, IT Software & Services and Retailing grew during the pandemic in terms of sales per capita, employees and total sales. Quarantine rules and lockdowns in some parts of the world led to many jobs that had the possibility to work from home, making the demand for software services increase. Also, many companies digitized and turned to mobile applications and the internet.
5. Conclusions
G-2000 for years 2015, 2020 and 2021 (Fig. 1) exhibited a clear division into exponential and Pareto cumulative distributions in the lower and upper parts, respectively. However, according to Table I, the number of companies in the Pareto part decreased over time from 49.1% in 2015 to 5.6% in 2021. Also, the cut-off’s value xmin shifts to the right with the passage of time a factor of seven between 2015 and 2021. This can be explained with the phenomenon of globalization since it has led to a more exponential behavior with conservation of money in a global scale.
The domiciles of the employees in the G-2000 include practically all countries in such a way that they form a kind of global capillary system, so one should relate employee income to the per capita wealth of the company in a general overview. The most plausible hypothesis is that the firm’s per capita wealth values found here are directly correlated with employee income since a fraction of a firms’ wealth is obviously distributed to its employees mostly in the form of wages and salaries.
For years 2020 and 2021, Forbes classified the G-2000 firms in 27 different industries or economic sectors. The industries of Banking, Oil & Gas Operations, Insurance and Consumer Durables remain in the top position, while the industries of Hotels, Restaurants & Leisure, Semiconductors and Media remain in bottom positions in both years. It is also important to highlight those companies that had the largest and lowest decrease in sales during 2020 and 2021. Data of G-2000 2020 corresponds from April 2019 to April 2020 and data of G-2000 2021 corresponds from April 2020 to April 2021, so this global information gives an insight into the pandemic effects on sales, specifically in certain industries according to the Forbes classification. Although most of the companies listed in G-2000 operate worldwide, grouping them by their country headquarter can give an idea of how sales by country have changed.
The industry of Hotels, Restaurants & Leisure (in particular hotels, cruise operators and resorts) were the most affected: this industry has a loss of 38%. The Oil & Gas Operations industry presented a reduction of almost 30% of its total sales. Transportation (airlines in particular) reduced its sales by 25.6%. On the contrary, Semiconductors, IT Software & Services and Retailing had the biggest increase in sales with 15.7%, 10.9% and 8.3% respectively. Notice that the United States is the leading country in all 6 industries and the difference between its sales and that of the other countries is very significant in all industries.
In summary, this work analyzed two sets of data. First, the sales per capita of the companies belonging to the G-2000 show the industries’ performance. Second, the total value of sales, which gives an insight into the most and less affected industries during this period of time. To our knowledge, ours is the first sales per employee statistical adjustment that analyzes temporal changes in sales per capita (per employee) in Forbes G-2000. We believe that this work could serve as a guide for future research on regional and global economics since our list can be easily extended in the number of firms and employing the same methodology.

