


 nova página do texto(beta)
 Inglês (pdf)
 Artigo em XML
 Referências do artigo
 Enviar este artigo por email
 Citado por SciELO
  Similares em
SciELO
Similares em
SciELO 
 Permalink
Introduction
One of the potential area of application of this paper correspond to explosion related ionospheric anomalies. Jones and Spracklen (1974) found an explosion occurred on first of, June, 1974, at the Nypro plant at Flixborough, Lincolnshire, that produced a blast wave which crossed the atmosphere and penetrated into the ionosphere. Blanc and Jacobson (1989) described ionospheric anomalies as caused through the acoustic shock wave produced by a 5-kt chemical explosion. Andreeva et al. (2001) work used the ionosphere radiotomography method to detect the long-lived local distur-bances of the ionospheric density over the site of ground industrial explosions. Calais et al. (1998) found an ionospheric signature of surface mine blasts from Global Positioning System (GPS) receivers. The perturbation started 10 to 15 min after the blast, and lasted for about 30 minutes. The goal of this paper is to use Two-Dimensional Principal Component Analysis (2DPCA) to examine the ionospheric spatial distribution of any driven TEC anomaly associated with huge gas explosion in Kaohsiung (22°36′39″N 120°19′8″E), Taiwan at 15: 59 (UT) on July 31, 2014, without considering the atmosphere environment during this explosion but only the two-dimensional Total Electron Content (TEC) data. The sample time interval chosen was 16:00 to 16:10 (UT). The two-dimensional TEC data are derived from NASA Global Differential GPS system (GDGPS) and the global TEC maps (GIMs) are derived using TEC data from ~100 real-time GDGPS tracking sites with a time resolution of 5 minutes (Kechine et al., 2004; Ouyang et al., 2008).
Method
2DPCA
2DPCA signals are represented by a matrix A (n x m dimension). Linear projection of the form is considered as follows (Sanguansat, 2012),
where x is an n dimensional projection axis and y is the projected feature of signals on x, called principal component vector.
Here S x is the covariance matrix of the projected feature vector.
The trace of S x is defined as:
matrix G is thed signal covariance matrix. The vector x maximizing Eq.4 corresponds to the principal (largest) eigenvalue of G, and let the principal eigenvalue to be the most dominant component of the data, therefore the principal eigenvalue is a mathematical indicator representing the principal (main) characteristics of the data. Small signal size (SSS) problem (sparse data in a matrix) of two dimensional TEC data can be removed by 2DPCA (Sanguansat, 2012). The Principal Component Analysis (PCA), converts the measurements into one-dimensional data before covariance matrix calculation. The covariance matrix of PCA is based on an input matrix with m x n dimension, of which is reshaped from one-dimensional data (length of m multiplying n). Reshaping data will cause a computing error since PCA is a tool to deal with one-dimensional data. It means that the spatial structure and information can not be well preserved due to some original information loss when inverting to original dimension under the condition of the matrix being small sample size (SSS). Such information loss is called SSS problem. However, the covariance matrix in 2DPCA is full rank for a matrix of sparse data. Therefore the curse of dimensionality and the SSS problem (sparse data in a matrix) can be avoided (Sanguansat, 2012).
TEC Data Processing
The global TEC data prior to the explosion occurred at 15:55 (UT) on July 31, 2014, were examined to detect explosion-related TEC anomaly and GIMs are only used to observe TEC situation in this study. However the TEC anomaly is detectable in the time interval 16:00 to 16:10 (UTC) by 2DPCA and therefore the procedure of TEC data processing in the time interval is shown. Figure 1(a) shows the GIMs during the time from 16:00 to 16:10 on July 31, 2014. For GIMs in Figure 1(a), each GIM includes global coverage completely, which is divided into 600 small grids with respective size of 12° in longitude and 9° in latitude, respectively. The global TEC data are divided into 600 grids with respective size of 12° in longitude and 9° in latitude, respectively. The spatial resolution of the global TEC data for the GDGPS system is 5 and 2.5 degrees in longitude and latitude, respectively (Hernández-Pajares et al., 2009). Therefore 4 TEC data, which belong to two-dimensional data, are enough to take into a grid. The 4 TEC data in each grid are formed as a matrix A of Eq.1 with 2x2 dimensions, which is a small sample signal size (SSS) in each grid. This allows for 600 principal eigenvalues to be computed for each of the 600 smaller grids.
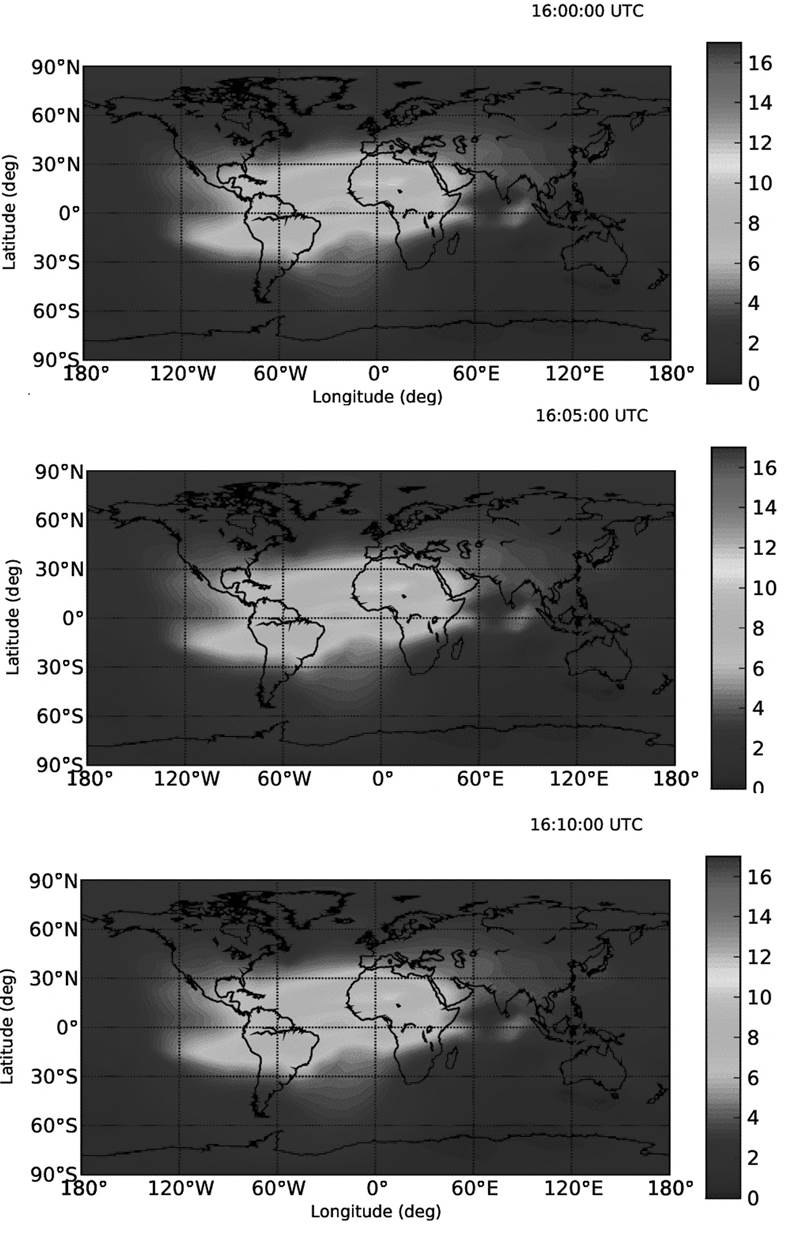
Figure 1a These figures show GIMs during the time from 16:00 to 16:10 (UT) on July 31, 2014. The geographic coordinates of Kaohsiung are (22°36′39″N 120°19′8″E) (TEC data Source: NASA Global Differential GPS system). They are different from the TEC data source of Lin (2011). They were extracted from FORMOSAT-3 satellite system (Belongs to Taiwan) with low spatial and time resolutions at that time.
Results
The large principal eigenvalues were shown to have relations to the earthquakes (Lin 2010; 2011). The explosions cause ground vibrations that are similar to the effects of the earthquakes and the volcanic explosions (Lin, 2013), causing acoustic shock waves and the large principal eigenvalues were found to represent volcanic explosions. Results have shown the explosion generated TEC anomaly that was represented by large principal eigenvalues. The large principal eigenvalue can indicate a TEC anomaly. However large principal eigenvalue could not show the actual time variations of TEC and their anomalies from clear reference time variations because a principal eigenvalue donates a mathematical indicator for the principal characteristics of the data. Therefore the large principal eigenvalues in Figs 1(b) show the existence of explosion-related TEC anomaly represented by a large principal eigenvalue from 16:00 to 16:05 on July 31, 2014, with a duration time of about 5 minutes. The possibility of other factors such as solar flare and geomagnetic effects affecting the results are considered by examining Kp and Dst indices (Fares Saba et al., 1997) and shown in Figure 2 (a) (b) that reveals that July 31, was a geomagnetic quiet day. The region of TEC anomaly may be due to ionospheric disturbances with very quick horizontal spreading.
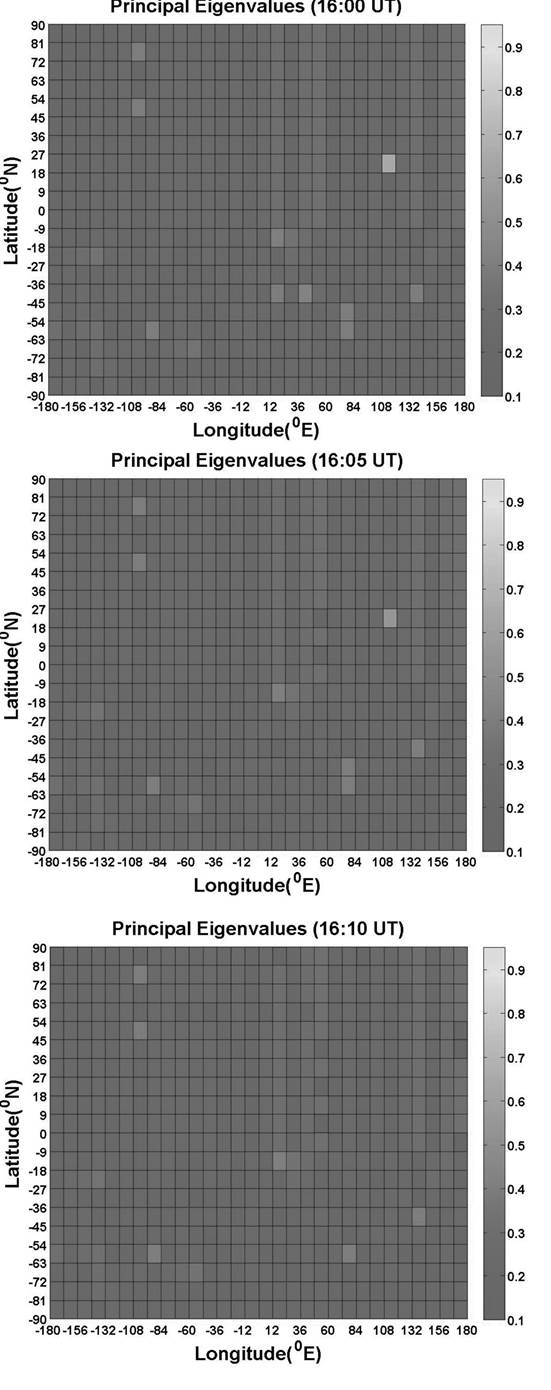
Figure 1b The figures give a color-coded scale of the magnitudes of principal eigenvalues corresponding to Figure 1 a. The color within a grid denotes the magnitude of a principal eigenvalue corresponding to Figure 1a, so that there are 600 principal eigenvalues assigned, respectively. The geographic coordinates of Kaohsiung city are (22°36′39″N 120°19′8″E). In these three figures, the values of the principal eigenvalues are between 0.11 and 0.93, therefore the colour bar is scaled between 0.1 and 0.95 instead of 0 and 1 in order to compare the strength of TEC anomalies with the three principal eigenvalues over Kaohsiung city. The TEC source from FORMOSAT-3 satellite system had low spatial and time resolutions, therefore the global TEC data are divided into 100 grids of 36° in longitude and 18° in latitude, respectively (Lin, 2011).
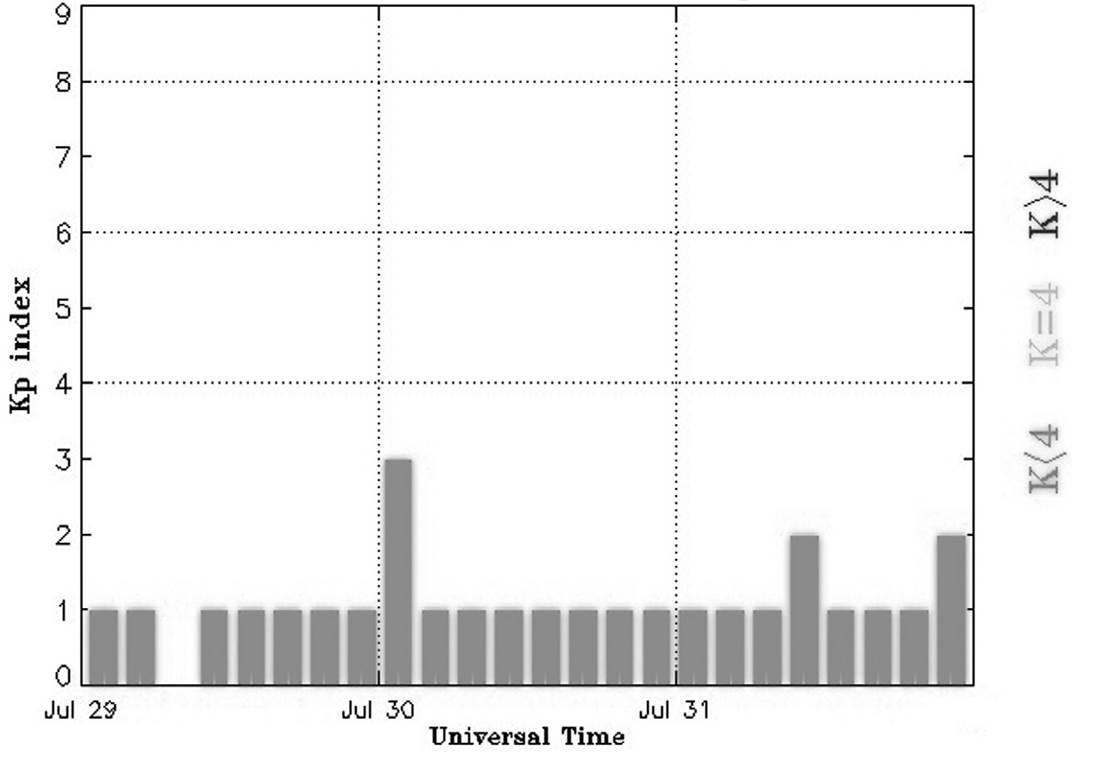
Figure 2a Shows the Kp index from July 29 to 31, 2014 (Space Weather Prediction Center). The Kp index was derived by calculating a weighted average of K-index from a network of geomagnetic observatories. Kp smaller than 4 represents geomagnetic quiet time (Bartels et al, 1939). In this figure, Kp index have no better time resolution to show geomagnetic effects, and therefore the Dst index will be shown for geomagnetic effects due to better time resolution in Figure 2b.
Figure 2b Shows the Dst index from July 29 to 31 (World Data Center for Geomagnetism, Kyoto). The Dst index is a measure of geomagnetic activity due to solar activity and the unit is nT (Hamilton, 1988).
Discussion
2DPCA was able to detect TEC anomaly detectable by 2DPCA from 16:00 to 16:05 UT on July 31, 2014, over Kaohsiung City and Taiwan. The most evident physical mechanism was acoustic shockwave waves (Blanc and Jacobson, 1989) creating large scale ionospheric density irregularities and traveling up into the ionosphere. The duration time of TEC anomaly was estimated at least 5 minutes. The speed of acoustic shock waves was difficult to estimate since only the large principal eigenvalue was shown as TEC anomaly. However the 2DPCA could not estimate the time from the beginning of the explosion to the beginning of TEC disturbance. Moreover the behavior of plasma in the ionosphere is very complicated from seismotraveling ionospheric distrubances (STIDS) after or during an earthquake and the distrubances are amplified in a large area of the ionosphere (Liu, 2011). Therefore the ionospheric distrubances was over Taiwan. For comparison, some studies are stated. Drobzheva and Krasnov (2003) have used a terrestrial atmospheric model due to a chemical explosion on the ground to describe the propagation of acoustic pulses and the effects of these pulses on the ionosphere above the explosion. The results agreed well with acoustic and radio sounding data measured for the 1981 Mill Race explosion at seven different altitudes approximately from 10 to 260 km. In their work, a terrestrial atmospheric model was given but a principal eigenvalue as a mathematical indicator was not necessary to give a model to detect sensitively a weak TEC anomaly without a realistic propagation model. Jones and Spracklen (1974) and Krasnov et al. (2003) described and re-analyzed an explosion of unprecedented magnitude occurred at the Nypro plant at Flixborough, Lincolnshire. The information regarding the time sequence of the explosion and the amplitude of the blast wave was considered to the Mill Race experiment. However, 2DPCA was used for TEC data to detect the anomaly related to the explosion without considering the atmosphere environment and traveling of acoustic shock waves. Moreover the research topics of studies of Drobzheva and Krasnov (2003) and Jones and Spracklen (1974) are different from the topic of this study. 2DPCA is shown to be more sensitive to detect weak TEC anomaly from TEC data. Therefore 2DPCA is a careful data handling description for the topic in this study. Afraimovich et al. (2001) researched the acoustic shock wave due to the occurrence of earthquakes to affect ionosphere. They studied the earthquake effects in Turkey on August 17, and November 12, 1999, and in Southern Sumatra on June 4, 2000, and found that the ionospheric response related to the earthquakes due to acoustic shock waves is 180-390 s. Compared with the result of this study, 2DPCA has shown its advantage and credibility to estimate the duration time of explosion-related TEC anomaly. It is worth noting that this explosion is very huge and then it is possible to predict explosion time due to high gas release a short time before the explosion to reduce the number of dead people when the time resolution of TEC is more high.
Conclusion
2DPCA had the advantage to detect an explosion-TEC anomaly due to acoustic shock waves. Results have shown that a local ranging TEC anomaly was detectable at 16:00 to 16:05 UT on July 31, 2014, over Taiwan. The TEC anomaly could be caused by acoustic shock waves with a duration of at least 5 minutes.

