


Servicios Personalizados
Revista
Articulo
 texto en
  Inglés (pdf)
 Artículo en XML
 Referencias del artículo
 Enviar artículo por email
Indicadores
-
 Citado por SciELO
 -
 Accesos
Links relacionados
-
 Similares en
SciELO
Similares en
SciELO
Compartir

 Permalink
Revista mexicana de ciencias pecuarias
versión On-line ISSN 2448-6698versión impresa ISSN 2007-1124
Rev. mex. de cienc. pecuarias vol.13 no.3 Mérida jul./sep. 2022 Epub 22-Ago-2022
https://doi.org/10.22319/rmcp.v13i3.5985
Review
Flow cytometry, a universe of possibilities in the veterinary field. Review
a Instituto Politécnico Nacional. Escuela Nacional de Ciencias Biológicas, Departamento de Inmunología. Prolongación de Carpio y Plan de Ayala s/n, Colonia Santo Tomás, Alcaldía Miguel Hidalgo, 11340, Ciudad de México, México.
b Instituto Politécnico Nacional. Escuela Nacional de Ciencias Biológicas, Central de Instrumentación. México.
c Instituto Nacional de Investigaciones Forestales, Agrícolas y Pecuarias. Ciudad de México, México.
Flow cytometry is a technology that has helped to rapidly advance many diverse areas of science by allowing the simultaneous measurement of multiple characteristics of each of the individual particles or cells in a sample as they pass at high speed through an area illuminated by one or more lasers. The information obtained includes data on the size and internal complexity, as well as other parameters inherent to each of the particles present in the sample, which are captured by the equipment as light signals. The most common particles analyzed in flow cytometers are cells, so the expression of molecules on their surface and inside, viability, functionality, cell proliferation, DNA content, cytokine production and many others can be analyzed. These determinations can be carried out by using antibodies coupled to fluorochromes or by using molecules whose fluorescence depends on the characteristic to be evaluated. Some flow cytometers are also sorters, which means that the equipment can physically sort those cells that exhibit the characteristics of interest; in addition, it is feasible that once they have been purified, they can be used in subsequent experiments. This review focuses on the fundamentals of flow cytometry and its main applications, which offer a great window of opportunity in the veterinary field, both in research and in the clinic.
Key words Flow Cytometry; Immunophenotyping; Viability; Cell Death; DNA Analysis; Cytokines
La citometría de flujo es una tecnología que ha favorecido el rápido avance de muchas y muy diversas áreas de la ciencia, ya que permite la medición simultánea de múltiples características de cada una de las partículas o células individuales que se encuentran en una muestra mientras pasan a gran velocidad a través de una zona iluminada por uno o varios láseres. La información obtenida incluye datos sobre el tamaño y la complejidad interna, así como otros parámetros inherentes a cada una de las partículas presentes en la muestra, los cuales son captados por el equipo como señales luminosas. Las partículas más comúnmente analizadas en los citómetros de flujo son células, así que puede analizarse la expresión de moléculas tanto en su superficie como en su interior, la viabilidad, la funcionalidad, la proliferación celular, el contenido de ADN y la producción de citocinas entre muchas otras. Estas determinaciones pueden realizarse gracias a la utilización de anticuerpos acoplados a fluorocromos o bien, al uso de moléculas cuya fluorescencia depende de la característica que se quiera evaluar. Algunos citómetros de flujo son además clasificadores (“sorters”), lo que implica que el equipo puede separar físicamente las células que presentan las características de interés y además, es factible que una vez que han sido purificadas, éstas puedan emplearse en posteriores experimentos. En esta revisión se concentran los fundamentos de la citometría de flujo y sus principales aplicaciones, las cuales ofrecen una gran ventana de oportunidad en el ámbito veterinario, tanto en investigación como en la clínica.
Palabras clave Citometría de flujo; Inmunofenotipo; Viabilidad; Muerte celular; Análisis de DNA; Citocinas
General information on flow cytometry
Flow cytometry (FC) allows the simultaneous analysis of several individual characteristics of cells or particles in suspension as they pass through one or more laser light beams. Flow cytometers can read thousands of cells per second with the possibility of regulating the speed of analysis, so that multiparametric analysis and the speed at which it is performed are two of its main and most powerful advantages. The type of sample that can be used is very diverse and includes blood, purified cell populations, cell lines, cell suspensions from solid organs, nuclei extracted from paraffin blocks, cell organelles, liposomes, extracellular vesicles, and body fluids, among others. The cells that can be studied in a flow cytometer can come from different animal and plant species, and it is even possible to perform studies directly on microorganisms1-5. Due to the possibility of studying also inert particles, it is feasible to analyze and quantify molecules in solution, which can be in samples of serum, plasma, urine, cerebrospinal fluid, colostrum, semen, culture supernatants, etc.6,7.
Given its great versatility, FC is currently one of the most widely used techniques in several areas. The relevance of its contributions and the transcendence of the results obtained has led to the integration of national and international associations that have made it possible to share information and establish unified protocols (Optimized Multicolor Immunofluorescence Panels, "OMIP") for various applications, mainly those related to the characterization of cell populations and clinical diagnostics, some of which are focused on the veterinary field8-11, as well as specialized magazines on the subject such as "Cytometry"12. The use of this technology in the veterinary field has been increasing slowly and gradually; multiple applications have been reported not only in research but also in the clinic, both for companion animals and wildlife animals. The aspects of veterinary medicine that have benefited most from FC are diagnosis, prognosis and artificial insemination13-19. Unfortunately, in Mexico, its use in the veterinary clinic is scarce, as no laboratories have any of these devices. And although, in the area of veterinary research, several educational institutions do have equipment in which this type of analysis can be carried out, little use is made of this technology. For this reason, in the present document, it was intend to emphasize its versatility and make known the multiple areas of opportunity that exist in the veterinary field to benefit from all the applications of flow cytometry, especially in the clinic.
Fundamentals of flow cytometry
Properties that can be measured by a flow cytometer include the size, internal complexity and fluorescence intensity of the cells analyzed. All these parameters are determined on a relative basis and no absolute values are generated, unless reference standards and controls are used20,21. The particles or cells to be analyzed must be in suspension, so that they are picked up by the equipment and directed to a physical space called by some authors as "interrogation point", which is the place where the laser beam or beams of the equipment hit the cells (Figure 1A). When the laser beam hits individual cells in the sample, it causes the light to be scattered in various directions, which provides information about their relative size and complexity (Figure 1B); if there are also fluorescent molecules present in the cell, the equipment captures the fluorescence emitted by these molecules, which can provide information about the expression of molecules and some cellular functions, among other characteristics, as detailed below (Figure 1C). The magnitude of each of the signals for size, complexity and fluorescence is recorded for each and every cell in the sample that passes through the laser beam, which allows this technology to perform an individual cell-by-cell analysis. Finally, the emitted signals are collected and transformed into values that can be analyzed by a computer and easily interpreted by the users (Figure 1C) 22.
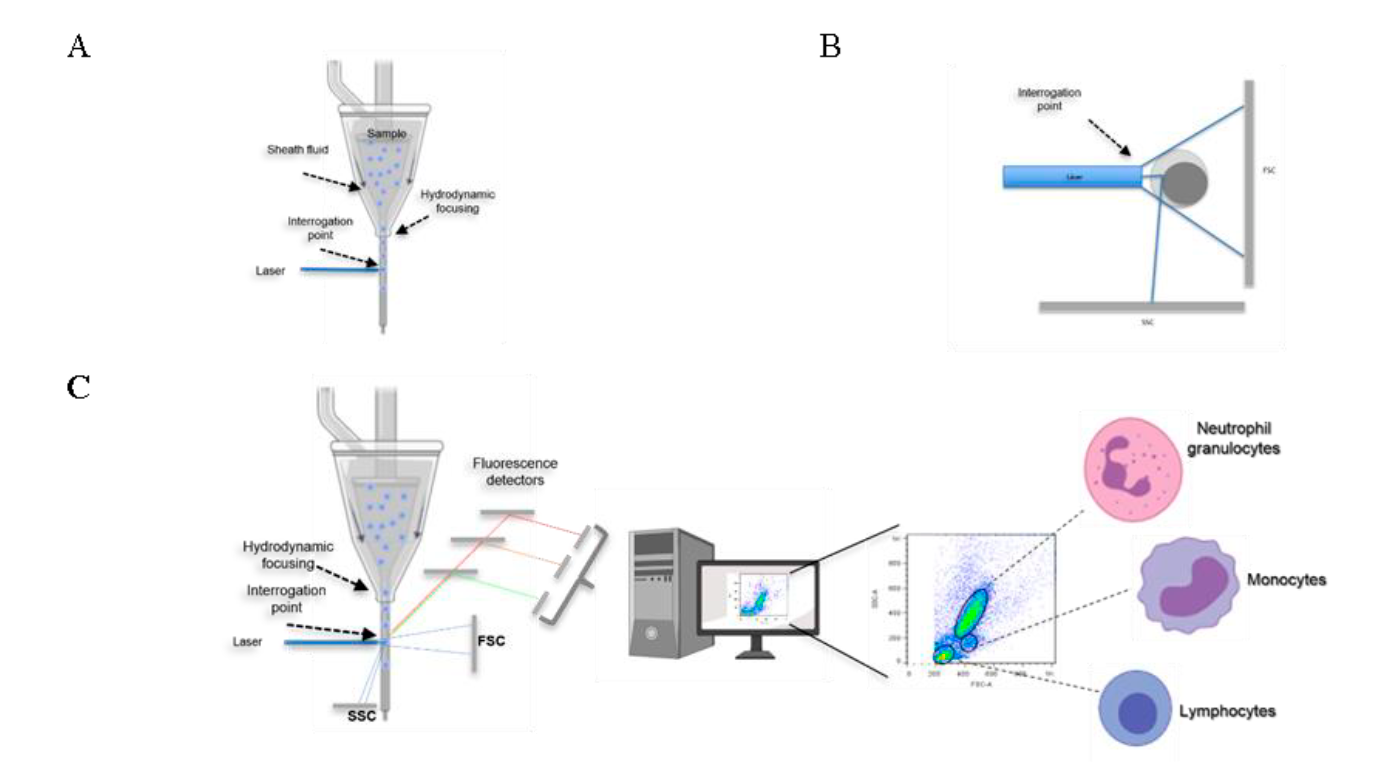
The sample is taken to the physical site, called the interrogation point, where the laser beam hits each of the cells. The alignment of the cells is achieved thanks to the pressure difference at which the solution circulates outside the sample (sheath fluid), generating the hydrodynamic focusing of the cells (A). When the laser beam hits each cell, it is deflected based on the cell’s size and internal complexity; these signals are detected in the forward scatter (FSC) and side scatter (SSC) detectors, respectively (B). Detectors of size and complexity, as well as detectors that pick up fluorescent signals, take the information to a computer in order to display it in easy-to-interpret graphs (C). Image partially created with BioRender.
Figure 1 General operation of a flow cytometer
Components of a flow cytometer
Flow cytometers are composed of three main systems: fluid system, optical system and electronic system2,23.
The fluid system takes the sample and directs the cells to the interrogation point. In order for the particles to be best illuminated, they must pass one by one through the center of the laser beam. This is achieved thanks to the hydrodynamic approach, which favors the alignment of the cells in the flow thanks to the pressure difference between the cell suspension and the liquid on the outside, called sheath fluid, as shown in Figure 1A(24,25.
The optical system is composed of two systems, the excitation system (laser beams) and the signal collector26. When the laser encounters a cell, it is scattered depending on the physical properties of the cell, in particular its size and internal complexity. The scattered light is captured by a front-end detector (forward scatter = FSC), and the value reported is proportional to the cell surface or size of the illuminated particle. On the other hand, the laterally scattered light is captured by another detector located at 90° to the laser (side scatter = SSC ), in this case, the value generated is proportional to the internal complexity of the cell or particle22-23. A representative scheme is shown in Figure 1B. Based on the FSC and SSC values of each cell in the sample, the electronic system of the cytometers constructs graphs that allow to place in different positions those cells in the sample that have sufficient differences between them in terms of their size or complexity. I.e., if is taken a peripheral blood sample, lyse its erythrocytes, and pass it through a cytometer, lymphocytes will appear in the graph in a different position than neutrophils, since the former are small and their internal complexity is low, while neutrophils are larger and are more complex inside because their nucleus is multilobed and has a large number of granules (Figure 1C)1-2. It is worth mentioning that the location on the FSC and SSC graph does not give the identification of the cell populations; as will be seen later, the use of antibodies is required in order to precisely define the identity of the cells present and the proportion in which each one is found in the sample being analyzed.
The electronic system is responsible for converting the optical signals into proportional electronic signals or voltage pulses. Light signals are generated as each cell passes through the laser beam. These light signals are transformed into electronic signals by photodetectors and, based on their intensity, are assigned a relative value on a scale. Signals with identical intensities accumulate at the same scale value, which increases the peak height and signals with higher intensities are plotted at higher values on the graph scale. Finally, all these values are presented in such a way that users can interpret the results obtained with the equipment, as shown below22,25,27.
In addition to the information that can be obtained about cells or particles with respect to their size and internal complexity, information about other characteristics can be analysed based on fluorescent signals28. A fluorescent compound or fluorochrome is capable of absorbing light within a certain range of wavelengths and, consequently, of emitting at a wavelength longer than the absorption wavelength. The range of wavelengths in which a fluorescent compound can be excited is called the absorption spectrum, and the range of wavelengths of the photons emitted is called the emission spectrum25.
The fluorescence that can be detected in a cytometer can be intrinsic or extrinsic, i.e. it can come from molecules that are part of the cell (riboflavin, NADPH, tryptophan, tyrosine, etc.) and are therefore often referred to as autofluorescence, or it can come from some fluorescent reagent that was added to the sample1. The most commonly used reagents in FC are antibodies, which bind to the molecule against which they are manufactured and which they are meant to detect. These antibodies, called primary antibodies, may be labeled with a fluorochrome (Figure 2A) or require a second antibody, or secondary antibody, that will recognize the primary antibody, and the secondary antibody may be the one that is conjugated to the fluorochrome (Figure 2B)23. Some of the applications of cytometry may use as tools, instead of antibodies, molecules whose emission wavelength or fluorescence intensity depends on the cellular characteristic to be evaluated (Figure 2C).
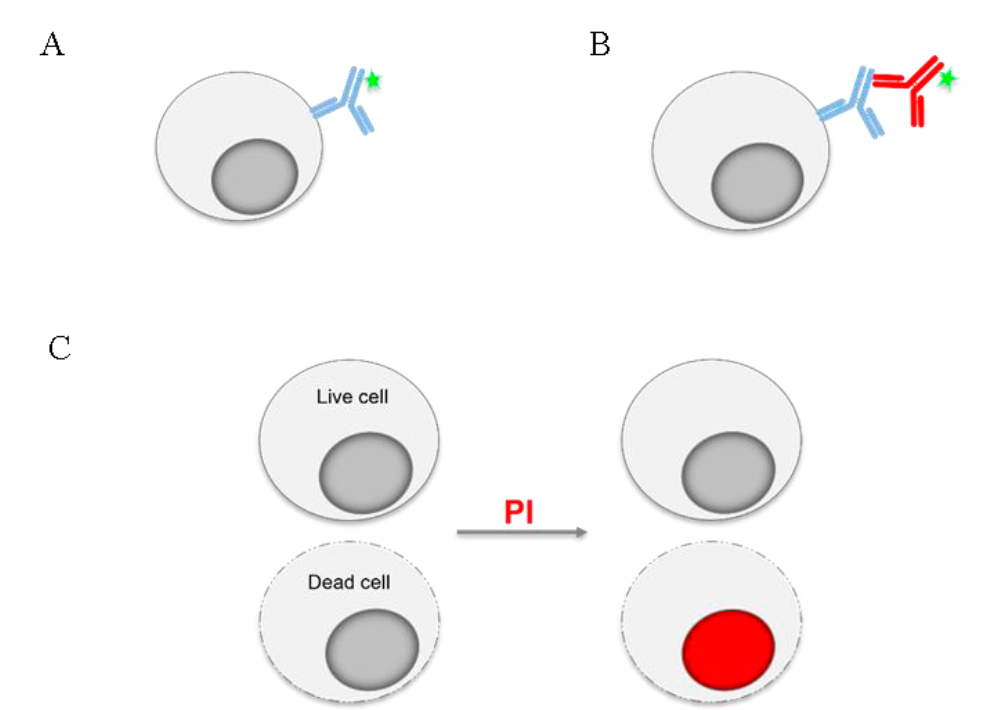
The expression of molecules in cells can be analyzed using cell-specific antibodies, which can be linked to a fluorochrome (green star) (A), or it may require a second antibody coupled to a fluorochrome to recognize the primary antibody (B). For some applications, molecules whose fluorescence indicates certain characteristic or function of the cell are used. The use of propidium iodide (PI), a fluorescent molecule added to the sample is exemplified in (C); living cells do not allow the fluorochrome to pass into their interior and therefore, they do not fluoresce, unlike dead cells, whose membrane is damaged and allows PI to pass through, staining the nucleic acids of the cell.
Figure 2 Flow cytometry staining with antibodies and fluorescent molecules
Current FC is considered multiparametric because it is possible to evaluate, in addition to size and complexity, several phenotypic and functional characteristics in the same cell simultaneously22,29. The number of fluorochromes and, consequently, the number of characteristics that can be analyzed in the same sample depends on the model and configuration of the cytometer used, as well as on the characteristics of each fluorochrome to be utilized.
The most commonly used laser in CF is the argon laser, which has a wavelength of 488 nm (blue). Most current flow cytometers have more than one laser beam, which increases their analytical potential and versatility26. The fluorochromes used in a cytometer are those that can be excited by one of the equipment's lasers beams and captured by its fluorescence detectors. The wavelengths captured by each fluorescence detector are defined by the filters in the equipment. Some applications that facilitate the selection of fluorochromes based on the configuration of the available equipment include BD Bioscience Spectrum Viewer, Biolegend Spectra Analyzer, FluoroFinder, and ThermoFisher Fluorescence Spectra Viewer.
Types of graphs and their interpretation
The data provided by flow cytometers for each and every cell in a sample must be presented in a way that makes interpretation easy, fast and integrative. Histograms are used to analyze a single parameter captured by the equipment, which is displayed on the x-axis, while the y-axis represents the number of events -cells or particles that meet that characteristic. Histograms are actually frequency graphs (Figure 3). With this type of graph, it is possible to distinguish between events that have the characteristic evaluated on the x-axis and those that do not have it. The simplest interpretation of this type of graph is all or nothing, i.e., either it has or does not have the molecule to be identified; however, the usefulness of this type of graph goes beyond this, since it allows to know how much it expresses it and to compare expression levels of a molecule between cells of the same sample or between samples that are in different conditions. In order to establish the percentage of positive cells for the label, a sample to which the fluorescent label was not added must be given to the cytometer to serve as a reference point between negative and positive signal. Figure 3 shows an example in which the expression of the CD3 molecule is evaluated in the cells of a sample. Figure 3A shows the histogram of an unstained sample, which implies that, when reading a stained sample, all cells appearing on the right (in the values of the scale comprising M1, Figures 3B and 3C) will be positive for the mark being determined, whereby it is possible to obtain the percentage of these cells1,23,30.
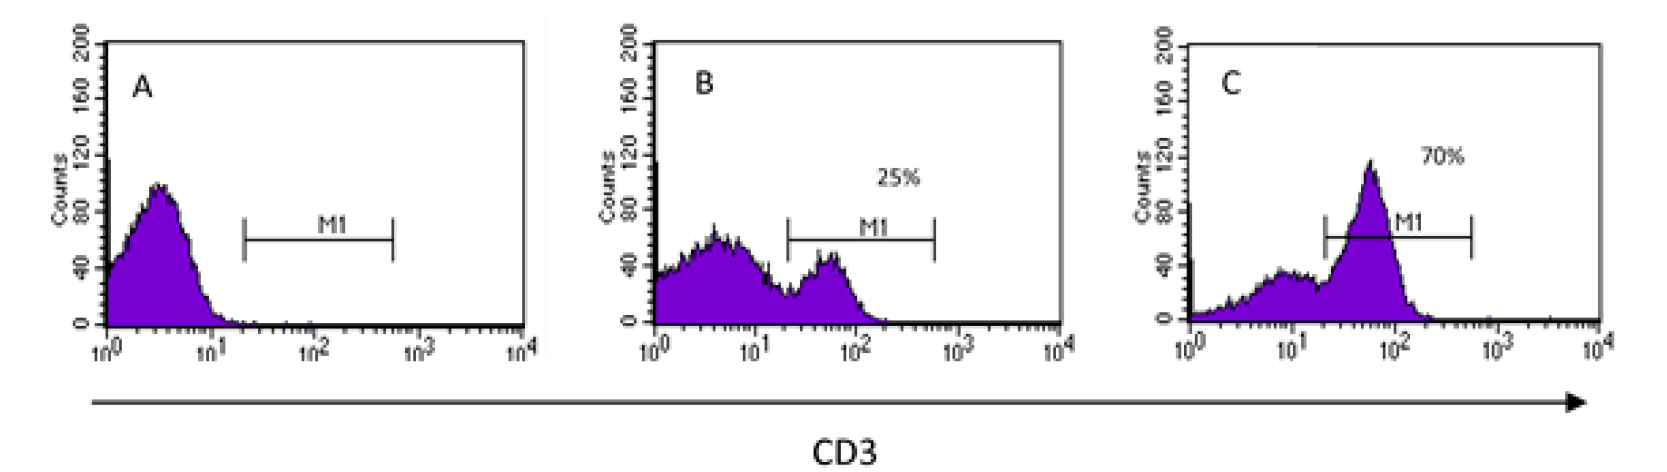
Histograms display only one feature at a time. In order to find out if the cells express the molecule of interest (CD3), first, a sample that has not been stained is introduced (A) and it establishes the values on the scale at which the cells will be considered positive (M1). Histograms (B) and (C) are shown for two different stained samples with 25 % and 70 % of cells expressing the CD3 molecule, respectively.
Figure 3 Unidimensional analysis
Dot plots, density plots, or contour plots are examples of graphs that allow two parameters to be correlated at the same time, one plotted on the x-axis, and the other, on the y-axis. The difference between these plots is the way in which the interaction is presented. The location of each cell on the graph is similar to what happens with coordinates on a Cartesian plane, where the position of each cell will depend on its individual values for the characteristic plotted on x and for the one plotted on y (Figure 4A). With this type of representation, is possible distinguish at least four possibilities: cells that exhibit neither of the two characteristics being evaluated and are located in the lower left quadrant; those that exhibit only one or the other and will, therefore, be displayed in the upper left or lower right quadrants, and those that exhibit both and are therefore located in the upper right quadrant (Figure 4B). When the results are analyzed, the flow cytometer will report the percentage of cells that have the characteristic(s) of interest23,30. Figures 4C-E show the biparametric analysis of a thymus suspension stained with an anti-CD4-FITC antibody (feature 1) and an anti-CD8-PE antibody (feature 2). It can be observed that the sample comprises 4 % of cells expressing neither CD4 molecule nor CD8 molecule, 17 % expressing only CD4, 6 % expressing only CD8, and 73 % of cells expressing both CD4 and CD8. Visualization of the expression and coexpression of both molecules can be done in dot plots (Figure 4C), density plots (Figure 4D), or contour plots (Figure 4E).
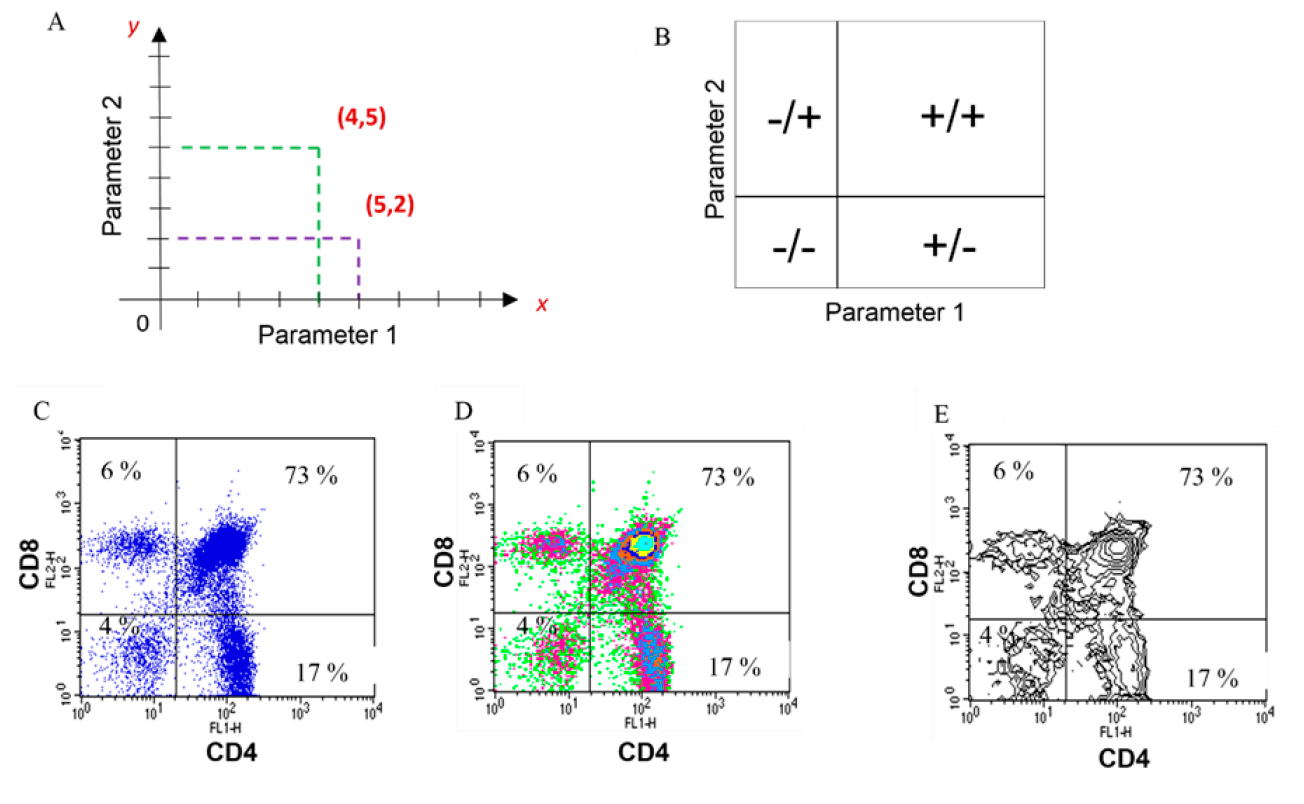
Two characteristics are displayed simultaneously, and correlations can be established between them. Each cell (point) has a value on the x and y-axis, as on a Cartesian plane (A); General interpretation for two-dimensional plots (B); Examples of two-dimensional plots: Dot plot (C), density plot (D) and contour plot (E) of the same sample.
Figure 4 Two-dimensional analysis
Undoubtedly, one of the areas of greatest progress in recent years in FC has to do with the development of increasingly robust software, which utilizes data mining and machine learning to make complex multivariate analysis possible. This has frequently allowed finding FC results organized in heat maps or in principal component analysis, among many other strategies, thanks to which the analysis of many parameters can be integrated into a single graph and to compare the results between individuals or conditions. The files generated by flow cytometers use the ".fcs" (flow cytometry standard) file format, which facilitates the analysis of files generated on different platforms, regardless of the flow cytometer on which the samples were acquired22,31,32.
“Cell sorting”
Some flow cytometers are capable of sorting, that is, of enriching a particular population, which is physically separated from the rest of the cells in the sample; at the end, the purified or enriched population or populations of interest are obtained aseptically in individual tubes or in the wells of culture plates, with the option of performing subsequent studies with the cells thus obtained, such as microscopy, cell culture and molecular biology analyses, among others33,34.
Classical applications of flow cytometry
As mentioned above, FC is an extremely versatile technology that evaluates several parameters simultaneously in each cell, allowing correlations to be established between them. Not only can FC analyze the presence of molecules on the surface or inside cells: it can also quantify them. It is possible to perform functional tests, biological evaluations of compounds in both eukaryotic and prokaryotic cells, purify cell populations even when they are present in a low proportion in the sample, or quantify soluble molecules and evaluate cell proliferation, cell viability, cell death, metabolic activity and intracellular signaling, just to mention some of them; Another very important aspect is that, by being able to evaluate many of these characteristics simultaneously, the sample volume required is reduced35,36. The techniques described below have application in both human and veterinary medicine, and within the latter, both in domestic animals and wildlife. It is worth mentioning that, on some occasions, the limitation is the availability in the market of antibodies that recognize specific molecules of the different animal species, but given the importance of the results that can be obtained by FC, the availability of antibodies with different specificities has grown in recent years, facilitating the work in the veterinary area both in research and in the clinic, especially for diagnosis. In addition, interspecies reactivity of different antibodies has been reported, which allows their use even in those for which they were not originally produced37.
Immunophenotype
Immunophenotyping refers to the characterization of cell populations based on the molecules expressed by a cell, allowing their identification through the use of antibodies28. In order to perform an immunophenotyping study, the antibodies used recognize particular molecules in the cells; based on their presence or absence, or on their level of expression, the identification or characterization is performed. It must keep in mind that there are molecules that are expressed in several cell types, while the expression of others is exclusive to certain cell populations or subpopulations, which implies that a correct selection of antibodies must be made. It should be taken into account that the molecules that identify each cell population may depend on the animal species being worked with38-42.
The detection of the different molecules of interest is performed using antibodies labeled with fluorochromes, so if a beam of light that excites the fluorochrome is shone on it, it will emit fluorescence at a certain wavelength that will be captured by a detector which will then identify the fluorochrome and, consequently, the molecule to which the antibody was bound. Identification or characterization of cell populations can be as detailed as needed. Some cytometers, as previously mentioned, only allow the simultaneous evaluation of 1-4 parameters based on fluorescence, i.e. only a maximum of four antibodies that recognize different molecules can be used, while in other equipment, the expression of more than 20 molecules can be studied in the same tube, which expands the possibilities and the detail of the characterization and quantification of cell populations28. Figures 4C-E are examples of immunophenotyping of different samples using two antibodies: an anti-CD4 and an anti-CD8.
Immunophenotyping has proved to be of vital importance in the diagnosis and prognosis of several veterinary diseases and a very adequate complement to the conventional morphological study. It is feasible to detect modifications in the proportions of the different cell populations, as well as to characterize neoplastic cells based on their phenotypic markers43, which allows an accurate diagnosis to be made. Currently, one of the main uses of immunophenotyping has been in the detection and characterization of hemato-oncological processes, both lympho- and myeloproliferative in small species13,14,16,44. As an example, it can be mentioned the case of canine lymphomas, which are the most frequent type of hematological tumor; 30 to 40% are T-cell lymphomas, and the rest are B-cell lymphomas, which can be differentiated according to the phenotypic markers they present. The antibody panels utilized can lead to a finer characterization that allows, if necessary, to identify even different subtypes. Information on the antibodies, the phenotypic markers of each population and cell subpopulation, as well as the analysis strategy can be consulted in different papers published recently45, in which it is mentioned that FC can also be used to follow up on the treatment and detect in these animals minimal residual disease, which may indicate a relapse. Thanks to FC, certain phenotypes with a worse prognosis have been identified45. Interestingly, some antibodies obtained for humans show cross-reactivity with canine antigens, which allows their use. The rapidity with which the diagnosis can be obtained is an additional advantage.
On the other hand, in dairy herds, the quantification of somatic cells in milk is a common strategy to detect the presence of clinical and subclinical infections in cows. FC allows a differential count of the cell populations and subpopulations present in milk, which has been suggested as an excellent alternative to identify inflammatory processes in the udder, even when somatic cell counts are low. Early detection of infectious processes prevents their progression and thus, produces changes in the quantity and quality of milk, reducing possible economic losses40,46.
Cell viability
Determining the viability of the cells in a sample allows to assess the state in which they are, a factor that can constitute an internal quality control within the laboratory47,48. The viability of the cells in a sample depends on many factors, including the collection procedure, transport (if necessary), sample processing during staining, storage, etc., so that if the sample exhibits low viability, it is necessary to determine which factor or factors are affecting this biological parameter. It is important to mention that the presence of dead cells in a sample favors the binding of antibodies independently of their specificity, so if dead cells are not removed from the analysis, they can lead to erroneous results and conclusions due to the presence of false-positive events48,49. On the other hand, it is possible that there is a decrease in viability (and therefore an increase in cell death) as a consequence of infection, treatment with chemotherapeutics, in vitro cell stimulation, etc., an event that should attract attention and require a detailed study of the causes and implications. In the particular case of chemotherapeutics, an increase in the percentage of dead cells may indicate a good response to treatment.
Reagents to quantify the percentage of viability (or cell death) or to exclude dead cells from a FC assay fall into two main groups. In the first case, the rationale implies that since dead cells have a damaged cell membrane, the fluorochrome enters and stains the dead cell, whereas living cells do not pick up the fluorochrome because their membrane is intact, and the two can be distinguished as stained and unstained, respectively (Figure 2C). Examples of such molecules are propidium iodide (PI) and 7-amino, actinomycin D (7-AAD); once stained, the cells cannot be fixed. In the second case, once the reagent is added, it is washed and the cells are fixated, which means that the reading in the cytometer does not have to be carried out immediately, and the samples can be stored. In this case, the fluorescent molecules used are covalently bound to cell proteins. In living cells, since the membrane is intact, the only proteins that will react with the reagent will be those on the surface. In the case of dead cells, the reagent will also react with the proteins inside the cell and stain them more intensely than live cells, making it possible to distinguish between them47,50. The graphs obtained in both cases and their interpretation are similar regardless of the type of reagent used. The determination of sperm viability before and after the cryopreservation process is an example of the routine use of this application of FC and constitutes an indispensable evaluation in artificial insemination in different animal species51,52.
Cell death
The study of cell death and the possible mechanisms that can induce it has been a topic of great interest. Since the description of apoptosis and subsequently of all the other mechanisms described to date, the techniques to demonstrate, quantify and characterize apoptosis have increased year by year, given the greater knowledge of the signaling pathways that are activated and lead to cell death49,53,54.
Cell death can be studied generally from two perspectives. The first involves establishing the percentage of dead cells in a cell suspension, as well as to establish the effect of different stimuli without the mechanism of death being of interest. This type of determinations is very common when performing biological activity studies of new molecules with possible antibiotic or antineoplastic activity. For the above, stainings similar to those described for viability are performed, but what is reported is the percentage of dead cells in the sample analyzed and, as already mentioned, the studies can be performed not only on infected eukaryotic cells, but also on microorganisms directly, which is very helpful for antibiotic resistance studies and the evaluation of new antimicrobial molecules55,56.
When it is necessary to identify the mechanism of cell death, it is important to establish a strategy to separate the potential biological events involved in cell death, such as the expression of specific molecules of each death mechanism, the activation of enzymes, the alteration of cellular functions such as mitochondrial membrane potential and the production of reactive oxygen species, the rearrangement of phospholipids in the membrane, the fragmentation of DNA, and the production of reactive oxygen species, etc. These events are related to the different types of cell death described so far and the signaling pathways that are activated in each one53,57. To date, more than ten different mechanisms of cell death are known, some of which are interconnected. One of the most frequent uses of cell death analysis in the veterinary field is to complete the study of semen quality in different animal species52.
Functional tests
FC also allows the functional capacity of cells to be evaluated; the detection of alterations in the normal capacities of cells can be indicative of pathologies, and their identification can aid in the diagnosis. The following are some of the techniques most commonly used and reported in the literature.
Phagocytosis. Phagocytosis is part of the innate immune response mechanisms that allows the containment of infections, that alterations in any of the steps of this process have repercussions on the health of the animals. Neutrophils are the most abundant phagocytic cells in the blood circulation of many mammals, although their proportion may vary; in most carnivores and horses they account for more than 50 % of the cells in blood, in pigs they are at 50 %, while in rodents and ruminants, they are at an average of 25 %. In reptiles, birds, rabbits and fish, phagocytic cells are called heterophils, and their percentage is variable among them58.
FC allows the study of phagocytosis from several points of view; the most common is by measuring the capacity to phagocytose particles or by evidencing the intracellular biochemical changes that occur in the cells after phagocytosis and that lead to the intracellular destruction of the microorganisms. In the first case, bioindicators such as bacteria or yeast can be used, or inert particles coupled to a fluorochrome, so that the percentage of cells that phagocytose and the level of phagocytosis can be determined59. In addition, it is feasible to monitor the pH change once the biomarkers or inert particles have been phagocytosed. For this purpose, fluorescent probes sensitive to pH changes are used, which allows monitoring each stage of the phagocytosis process, from the formation of phagosomes to their fusion with lysosomes (phagolysosomes), given the differences in the pH between the two compartments (pH 6.7 and 4.7, respectively)60,61. This type of analysis allows the detection of alterations in phagocytosis, which have been reported in veterinary diseases such as anaplasmosis, chlamydiosis, canine parvovirus, leukocyte adhesion deficiency, and chronic granulomatous disease, among others58,62.
Cell activation. Activation of cells is the result of their interaction with foreign agents or mitogens and may occur in vivo or in vitro; in some cases, activation is manifested by the expression de novo, or as increased basal expression of characteristic molecules, and may or may not be accompanied by cell proliferation and synthesis of soluble molecules such as cytokines and chemokines that are released into the microenvironment, among other events. The detection of activated cells in an organism implies that an immune response is being elicited either against a microorganism or against a vaccine agent, and, together with immunophenotyping, it can provide important information in cases of infectious diseases.
Proliferation. Cell proliferation can be assessed in vitro and in vivo by adding nucleotide analogues such as bromodeoxyuridine (BrdU) so that, if there is proliferation and, therefore, DNA synthesis, this molecule is incorporated into the new nucleic acid chains. Antibodies directed against BrdU labeled with fluorochromes are used to determine whether the molecule was incorporated; thus, if the cells proliferated, they will give a fluorescent signal, and then it will be possible to quantify the percentage of positive cells63. It is worth mentioning that BrdU has other uses, such as evidencing DNA fragmentation; therefore, the rationale for its use in each case and the interpretation of the results should not be confused.
Another technique used is DNA analysis. In this case, molecules are used that bind to DNA in a stoichiometric manner and therefore fluoresce with an intensity that is proportional to the nucleic acid content64; thus, cells that are in the G0 or G1 phase of the cell cycle will be located at a value on the scale that is half the value at which cells in early G2 or mitosis (M) phase, prior to cytokinesis, are located. Cells that are in the different stages of the S phase, i.e. from the beginning to the end of the duplication of genetic material, will be located between the position of cells in G0/G1 and G2/M (Figure 5A). When a cell population is proliferating, as occurs in cancer, the percentage of cells in S phase and in G2/M will increase with respect to the control sample in which there is no proliferation. In this case, permeabilization of the cells is also necessary so that the fluorochrome can enter the nucleus and bind to the DNA. Among the most commonly used molecules are PI, 7-amino-actinomycin D (7-AAD) and Hoechst 33342. The study of the cell cycle can be extended and completed with the analysis of molecules involved in each of the phases of the cycle by using the multiparametric potential of the FC. It is worth mentioning that this type of analysis can also identify the presence of cells with fragmented DNA, which appear in what is known as the "Sub-G0 peak" (Figure 5B), which correlates with some types of cell death. With this technique it is also possible to assess genome stability by comparing the ploidy of the G0/G1 peak between tumor cells and healthy cells64,65. In addition to the above, and as mentioned below, this technique allows distinguishing between X and Y spermatozoa based on their DNA content.
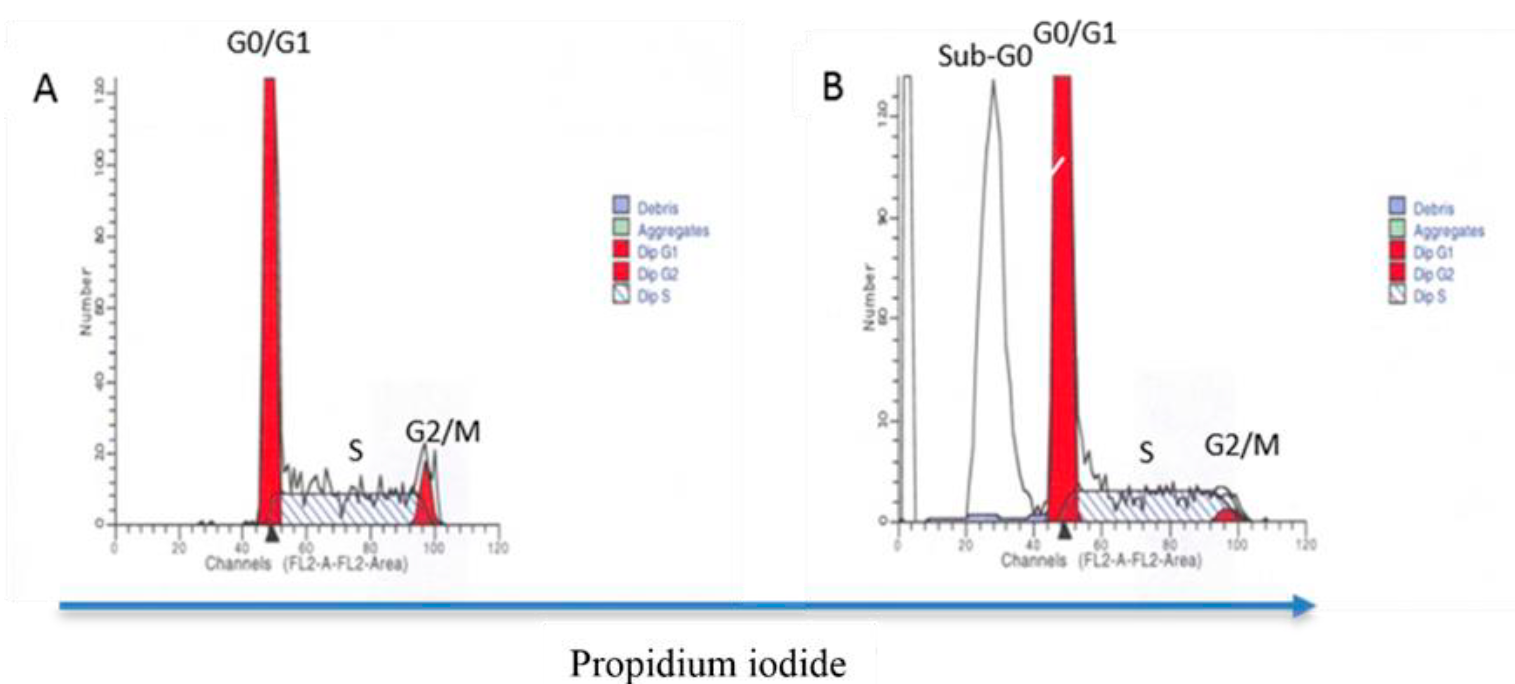
Cells are fixed and stained with propidium iodide. DNA analysis allows quantification of the percentage of cells in different phases of the cell cycle: G0/G1, S and G2/M based on the relative DNA content. The intensity of the staining is directly proportional to the amount of DNA in the cells at each stage (A). This type of analysis also makes it possible to quantify the percentage of cells with fragmented DNA, a peak identified as Sub-G0 (B).
Figure 5 DNA content analysis
Perhaps the most widely used technique to assess proliferation is the carboxyfluorescein diacetate succinimidyl ester (CFSE) dilution assay. This technique utilizes the compound CFDA, which is non-fluorescent and lipophilic and can penetrate the cell membrane; once inside, the action of esterases in living cells converts it into CFSE, which fluoresces. This molecule binds to cellular proteins, leaving all the cells in the sample marked; if the cells proliferate, each of the daughter cells will have half the fluorochrome of the cell from which it came, whereby it will be possible to establish the percentage of proliferating cells and proliferation cycles based on the progressive dilution or reduction of the label with each cell division66.
In addition to the above, the expression of Ki67, a molecule located in the nucleus that is associated with cell proliferation, can be detected using an antibody directed against it as proposed in OMIP-06514, which is the first optimized FC staining panel specific for dogs. Ki67 detection has been associated with the most aggressive canine cancers and can therefore be taken as a prognostic biomarker67.
Cytokine production. Cytokines are soluble molecules that are synthesized in response to a stimulus, and their main function is cell-to-cell communication. There are two general strategies to detect cytokine production: one that detects them intracellularly, allowing simultaneous identification of the producing cells68, and one in which they can be quantified in a solution once they have been released into the microenvironment in which they are found (plasma, serum or other body fluid, or in the culture medium if it is an in vitro system). In the latter strategy, it is not possible to know which cell produced them unless the cells have been previously purified. In the first case, a reagent that prevents the secretion of cytokines such as brefeldin or monensin must be added to the cells, which are then permeabilized, after which antibodies labeled with fluorochromes directed against the cytokines to be determined are added69. In the second case, the detection is made in a solution -either in a body fluid or in the culture medium. This strategy utilizes particles that have two characteristics; they emit fluorescence and, attached to their surface, they have antibodies directed against the cytokine or molecule of interest, which will act as capture antibodies (Figure 6A). The particles, or beads, as they are also known, have a particular fluorescence intensity depending on the molecule recognized by the antibodies on their surface, so that several soluble molecules can be detected in the same sample7.
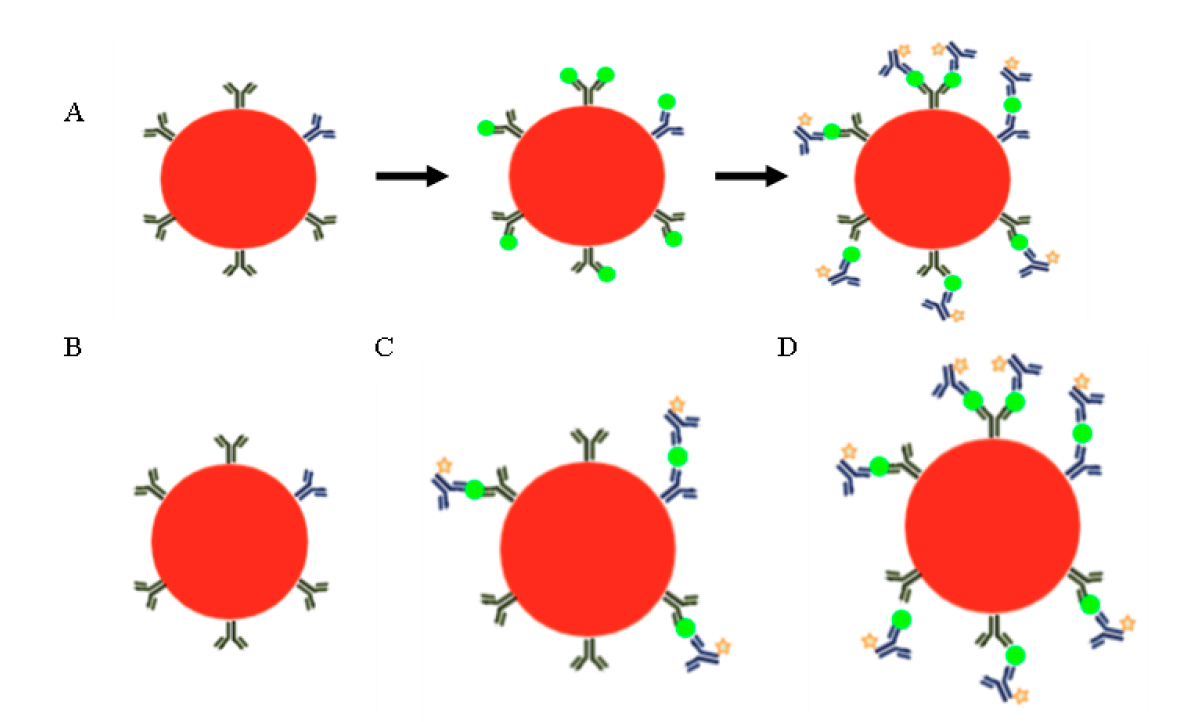
The most common ones utilize fluorescent inert particles (red circle) to which capture antibodies for the molecule to be quantified are attached (A). If the soluble molecule to be quantified (green circle) is present in the sample, it will bind to the antibodies. In the last step, a "reporter" antibody is added, which is bound to a fluorochrome (orange star) that is different from that of the bead, and, consequently, its fluorescence intensity will be proportional to the amount of molecule to be quantified. In this application, there are standards of known concentration; therefore, it is a quantitative technique. In B, C and D, three possible results of a bead array are schematized. Sample that does not have the molecule to be quantified (A), sample that has the molecule, but in a small quantity (C), and sample that has a high concentration of the molecule (D). The concentration is directly proportional to the fluorescence intensity emitted by the reporter antibody. Beads with capture antibodies for different molecules are used in the same assay. Image created with BioRender.
Figure 6 Pearl arrangements
Soluble molecules are quantified based on the fluorescence intensity emitted by a reporter antibody added at the end and coupled to a fluorochrome different from that of the bead; Consequently, the fluorescence intensity of the reporter antibody is directly proportional to the concentration of the molecule under study (Figure 6B -D). Thanks to the use of standards of known concentration of each molecule to be quantified, the concentration present in the sample can be obtained. Based on the above, the analysis of the results is biparametric: the intensity of the bead identifies the molecule to be quantified, and the fluorescence intensity of the reporter antibody, its concentration in the sample.
Commercial kits known as "bead arrays" or "bead-based multiplex assays" for quantifying molecules in a solution are available on the market. Unlike ELISA assays, in which a given volume of sample is used to quantify each molecule, here, multiple molecules can be analyzed simultaneously with the same volume6,70. Given their great versatility and potential in several areas, equipment has been developed for the reading of this type of assays that can detect up to 500 soluble molecules with a maximum sample volume of 50 μl, which can be chosen and requested from the manufacturer, based on the particular needs of the buyer. Although commercial supply is still limited in the veterinary field, Christopher-Hennings et al. have proposed this type of assay as an excellent alternative for the quantification of cytokines, chemokines, hormones, pathogens and antibodies in the veterinary field71. As an example of this, we can mention the serological diagnosis of leishmaniasis in dogs, in which recombinant antigens of the parasite are attached to the beads, rather than to capture antibodies, and what is detected in the sample are antibodies, so that the reporter antibodies recognize the canine antibodies present in the sample72.
Sperm sexing. Based on DNA analysis, X chromosomes can be differentiated from Y chromosomes in a sperm sample of any animal species, since the former have a higher content of genetic material. It is estimated that, in general terms, this difference is approximately 3 to 4 %, and, given the high sensitivity of flow cytometers, the two types of chromosomes can be differentiated and even physically separated into different tubes thanks to the "sorter" function of some equipment, which attains a degree of purity of over 90 %. Separated spermatozoa have been used in artificial insemination with varied results depending on the animal species73,74. It should not be forgotten that spermatozoa can be evaluated for several of the parameters mentioned above, such as the expression of molecules on their surface or intracellularly, the integrity of their membrane, the presence of molecules involved in some of the types of cell death, etc. Therefore, the studies that can be performed on spermatozoa go beyond DNA analysis, allowing studies on the quality and function of the spermatozoa19.
Concluding remarks
The main use of FC in the veterinary field is currently in research; the contributions that have been made through the use of this technology have had a great impact on the knowledge of cells, organs and systems under certain physiological and pathological conditions in different species. The use of flow cytometers in the clinical area has many advantages, given their high sensitivity, specificity and versatility in terms of the tests that can be performed with them. The cost of these devices and reagents, in addition to their scarce availability, has become an obstacle to their implementation in Mexico in veterinary medicine. Fortunately, both situations have been overcome thanks to the great demand for this kind of equipment in different areas, which has reduced its price and expanded the availability of reagents, making their use gradually more accessible and opening the possibility of their introduction into veterinary clinical laboratories in our country. In Mexico, there are several alternatives for training in FC, both theoretical and practical, which are provided in some universities in the country, as well as at the National Laboratory of Flow Cytometry (Laboratorio Nacional de Citometría de Flujo, LabNalCit) and in the Cytometry Chapter of the Mexican Society of Immunology, the latter being a pioneer in the teaching and dissemination of the use of flow cytometers and the correct interpretation of the results obtained with this technology.
Literatura citada
1. Shapiro HM. Practical flow cytometry. 4th ed. New Jersey, USA: Wiley; 2003. [ Links ]
2. Cossarizza A, Chang HD, Radbruch A, Acs A, Adam D, Adam-Klages S, et al. Guidelines for the use of flow cytometry and cell sorting in immunological studies (Second ed). Eur J Immunol 2019;49(10):1457-973. [ Links ]
3. D’Hondt L, Höfte M, Van Bockstaele E, Leus L. Applications of flow cytometry in plant pathology for genome size determination, detection and physiological status. Mol Plant Pathol 2011;12(8):815-28. [ Links ]
4. Zamora JLR, Aguilar HC. Flow virometry as a tool to study viruses. Methods 2018;134-135:87-97. [ Links ]
5. Duquenoy A, Bellais S, Gasc C, Schwintner C, Dore J, Thomas V. Assessment of gram- and viability-staining methods for quantifying bacterial community dynamics using flow cytometry. Front Microbiol2020;11:1469. [ Links ]
6. Mandy FF, Nakamura T, Bergeron M, Sekiguchi K. Overview and application of suspension array technology. Clin Lab Med 2001;21(4):713-729. [ Links ]
7. Morgan E, Varro R, Sepulveda H, Ember JA, Apgar J, Wilson J, et al. Cytometric bead array: a multiplexed assay platform with applications in various areas of biology. Clin Immunol 2004;110(3):252-66. [ Links ]
8. Pantelyushin S, Ranninger E, Bettschart-Wolfensberger R, vom Berg J. OMIP-065: Dog immunophenotyping and t-cell activity evaluation with a 14-color panel. Cytometry A 2020;97(10):1024-7. https://pubmed.ncbi.nlm.nih.gov/32583607/. [ Links ]
9. Donaldson MM, Kao SF, Foulds KE. OMIP-052: An 18-color panel for measuring Th1, Th2, Th17, and Tfh responses in rhesus macaques. Cytometry A 2019;95(3):261-263. https://europepmc.org/articles/PMC6414258. [ Links ]
10. Pedreira CE, Costa E, Lecrevise Q, Grigori G, Fluxa R, Verde J, et al. From big flow cytometry datasets to smart diagnostic strategies: The EuroFlow approach. J Immunol Methods 2019;475. [ Links ]
11. Kalina T. Reproducibility of flow cytometry through standardization: Opportunities and challenges. Cytometry A 2020;97(2):137-147. [ Links ]
12. International Clinical Cytometry Society. https://www.cytometry.org/web/journal.php [ Links ]
13. Marconato L, Comazzi S, Aresu L, Riondato F, Stefanello D, Ferrari R, et al. Prognostic significance of peripheral blood and bone marrow infiltration in newly-diagnosed canine nodal marginal zone lymphoma. Vet J 2019;246:78-84. https://www.sciencedirect.com/science/article/pii/S1090023319300115. [ Links ]
14. Meichner K, Stokol T, Tarigo J, Avery A, Burkhard MJ, Comazzi S, et al. Multicenter flow cytometry proficiency testing of canine blood and lymph node samples. Vet Clin Pathol 2020;49(2):249-257. [ Links ]
15. Dudley A, Byron JK, Burkhard MJ, Warry E, Guillaumin J. Comparison of platelet function and viscoelastic test results between healthy dogs and dogs with naturally occurring chronic kidney disease. Am J Vet Res 2017;78(5):589-600. [ Links ]
16. Thamm DH, Gustafson DL. Drug dose and drug choice: Optimizing medical therapy for veterinary cancer. Vet Comp Oncol 2020;18(2):143-151. [ Links ]
17. Seidel GEJ. Sexing mammalian sperm - Where do we go from here? J Reprod Dev 2012;58(5):505-509. [ Links ]
18. Petrunkina AM, Harrison RAP. Fluorescence technologies for evaluating male gamete (dys)function. Reprod Domest Anim 2013;48 (Suppl 1):11-24. [ Links ]
19. Ortega-Ferrusola C, Gil MC, Rodríguez-Martínez H, Anel L, Peña FJ, Martín-Muñoz P. Flow cytometry in Spermatology: A bright future ahead. Reprod Domest Anim 2017;52(6):921-931. [ Links ]
20. Picot J, Guerin CL, Le Van Kim C, Boulanger CM. Flow cytometry: retrospective, fundamentals and recent instrumentation. Cytotechnology 2012;64(2):109-130. [ Links ]
21. Mizrahi O, Ish Shalom E, Baniyash M, Klieger Y. Quantitative flow cytometry: concerns and recommendations in clinic and research. Cytometry B Clin Cytom 2018;94(2):211-8. [ Links ]
22. McKinnon KM. Flow cytometry: An overview. Curr Protoc Immunol 2018;120:5.1.1-5.1.11. [ Links ]
23. Macey MG. Flow cytometry: Principles and applications. 1st ed. Marion G. Macey, editor. Flow Cytometry: Principles and Applications. London UK: Humana Press Inc.; 2007:1-290. [ Links ]
24. Kachel V, Fellner-Feldegg H, Menke E. Hydrodynamic properties of flow cytometry instruments. Flow Cytom Sorting 1990;27-44. [ Links ]
25. Büscher M. Flow cytometry instrumentation - An Overview. Curr Protoc Cytom 2019;87(1):e52. [ Links ]
26. Shapiro HM, Telford WG. Lasers for flow cytometry: Current and future trends. Curr Protoc Cytom 2018;83:1.9.1-1.9.21. [ Links ]
27. Snow C. Flow cytometer electronics. Cytometry 2004;57A(2):63-9. http://doi.wiley.com/10.1002/cyto.a.10120. [ Links ]
28. Delmonte OM, Fleisher TA. Flow cytometry: Surface markers and beyond. J Allergy Clin Immunol 2019;143(2):528-537. [ Links ]
29. Maciorowski Z, Chattopadhyay PK, Jain P. Basic multicolor flow cytometry. Curr Protoc Immunol 2017;117:5.4.1-5.4.38. [ Links ]
30. Adan A, Alizada G, Kiraz Y, Baran Y, Nalbant A. Flow cytometry: basic principles and applications. Crit Rev Biotechnol 2017;37(2):163-176. [ Links ]
31. Wang S, Brinkman RR. Data-Driven flow cytometry analysis. Methods Mol Biol 2019;1989:245-265. [ Links ]
32. Montante S, Brinkman RR. Flow cytometry data analysis: Recent tools and algorithms Int J Lab Hematol 2019;41 (Suppl 1):56-62. [ Links ]
33. Göttlinger C, Mechtold B, Meyer KL, Radbruch A. Setup of a flow sorter. In: Flow cytometry and cell sorting. Springer Berlin Heidelberg; 1992:153-158. [ Links ]
34. Jayasinghe SN. Reimagining flow cytometric cell sorting. Advanced biosystems. Wiley-VCH Verlag; 2020(4).doi.org/10.1002/adbi.202000019. [ Links ]
35. Claassen M. Shooting movies of signaling network dynamics with multiparametric cytometry. Curr Top Microbiol Immunol 2014;377:177-189. [ Links ]
36. Goetz C, Peng LJ, Aggeler B, Bonnevier J. Phenotyping CD4+ hTh2 cells by flow cytometry: Simultaneous detection of transcription factors, secreted cytokines, and surface markers. Methods Mol Biol 2017;1554:175-184. [ Links ]
37. Conrad ML, Davis WC, Koop BF. TCR and CD3 antibody cross-reactivity in 44 species. Cytometry A 2007;71(11):925-933. [ Links ]
38. Mahnke YD, Roederer M. Optimizing a multicolor immunophenotyping assay. Clinics in Laboratory Medicine. Elsevier; 2007;(27):469-85. [ Links ]
39. Herold NC, Mitra P. Immunophenotyping. In Treasure Island (FL); 2021. [ Links ]
40. Grandoni F, Scatà MC, Martucciello A, Carlo E De, Matteis G De, Hussen J. Comprehensive phenotyping of peripheral blood monocytes in healthy bovine. Cytometry A 2021. https://onlinelibrary.wiley.com/doi/full/10.1002/cyto.a.24492. [ Links ]
41. Agulla B, García-Sancho M, Sainz Á, et al. Isolation and immunophenotyping by flow cytometry of canine peripheral blood and intraepithelial and lamina propria duodenal T lymphocytes. Vet Immunol Immunopathol 2021;239. https://pubmed.ncbi.nlm.nih.gov/34352607/. [ Links ]
42. Rütgen BC, Baszler E, Weingand N, Wolfesberger B, Baumgartner D, Hammer SE, et al. Composition of lymphocyte subpopulations in normal and mildly reactive peripheral lymph nodes in cats. J Feline Med Surg 2021;65-76. https://doi.org/101177/1098612X211005310. [ Links ]
43. Burkhard MJ, Bienzle D. Making sense of lymphoma diagnostics in small animal patients. Clin Lab Med 2015;35(3):591-607. http://www.labmed.theclinics.com/article/S0272271215000505/fulltext. [ Links ]
44. Giantin M, Vascellari M, Lopparelli RM, Ariani P, Vercelli A, Morello EM, et al. Expression of the aryl hydrocarbon receptor pathway and cyclooxygenase-2 in dog tumors. Res Vet Sci 2013;94(1):90-99. [ Links ]
45. Comazzi S, Riondato F. Flow cytometry in the diagnosis of canine T-cell lymphoma. Front Vet Sci 2021;8. https://pubmed.ncbi.nlm.nih.gov/33969027/. [ Links ]
46. Pilla R, Bonura C, Malvisi M, Snel GG, Piccinini R. Methicillin-resistant Staphylococcus pseudintermedius as causative agent of dairy cow mastitis. Vet Rec 2013;173(1):19. https://pubmed.ncbi.nlm.nih.gov/23723102/. [ Links ]
47. Coder DM. Assessment of cell viability. Curr Protoc Cytom 2001;Chapter 9:Unit 9.2. https://doi: 10.1002/0471142956.cy0902s15. [ Links ]
48. Johnson S, Nguyen V, Coder D. Assessment of cell viability. Curr Protoc Cytom 2013;64(1):9.2.1-9.2.26. https://onlinelibrary.wiley.com/doi/10.1002/0471142956.cy0902s64. [ Links ]
49. Galluzzi L, Aaronson SA, Abrams J, Alnemri ES, Andrews DW, Baehrecke EH, et al. Guidelines for the use and interpretation of assays for monitoring cell death in higher eukaryotes. Cell Death Differ 2009;16(8):1093-1107. [ Links ]
50. Perfetto SP, Chattopadhyay PK, Lamoreaux L, Nguyen R, Ambrozak D, Koup RA, et al. Amine reactive dyes: an effective tool to discriminate live and dead cells in polychromatic flow cytometry. J Immunol Methods 2006;313(1-2):199-208. [ Links ]
51. Jäkel H, Henning H, Luther AM, Rohn K, Waberski D. Assessment of chilling injury in hypothermic stored boar spermatozoa by multicolor flow cytometry. Cytometry A 2021;99(10):1033-1041. https://onlinelibrary.wiley.com/doi/full/10.1002/cyto.a.24301. [ Links ]
52. Caamaño JN, Tamargo C, Parrilla I, Martínez-Pastor F, Padilla L, Salman A, et al. Post-thaw sperm quality and functionality in the autochthonous pig breed Gochu asturcelta. Anim 2021;11(7):1885. https://www.mdpi.com/2076-2615/11/7/1885/htm. [ Links ]
53. Wlodkowic D, Telford W, Skommer J, Darzynkiewicz Z. Chapter 4 - Apoptosis and Beyond: Cytometry in studies of programmed cell death. Methods Cell Biol 2011;103: 55-98. https://www.sciencedirect.com/science/article/pii/B9780123854933000048. [ Links ]
54. Programmed Necrosis. Methods and protocols. Anticancer Res 2018;38(11):6585-6. https://ar.iiarjournals.org/content/38/11/6585.6. [ Links ]
55. Ambriz-Aviña V, Contreras-Garduño JA, Pedraza-Reyes M. Applications of flow cytometry to characterize bacterial physiological responses. Biomed Res Int 2014. https://pubmed.ncbi.nlm.nih.gov/25276788/. [ Links ]
56. Andrade OS, Chacón VKF, Correa BJ, Rodríguez VLM, Moorillón GVN, Sánchez TLE. Rational design of new leishmanicidal agents: In silico and in vitro evaluation. The Battle Against Microbial Pathogens: Basic Science, Technological Advances and Educational Programs. Méndez-Vilas A. editor. Formatex Research Center. ISSBN: (13):2015 ;978-84-942134-6-5. [ Links ]
57. Galluzzi L, Vitale I, Aaronson SA, Abrams JM, Adam D, Agostinis P, et al. Molecular mechanisms of cell death: Recommendations of the nomenclature committee on cell death. Cell Death and Differentiation 2018;25:486-541. https://doi.org/10.1038/s41418-017-0012-4. [ Links ]
58. Fingerhut L, Dolz G, de Buhr N. What is the evolutionary fingerprint in neutrophil granulocytes?. Int J Mol Sci 2020;21(12):4523. doi: 10.3390/ijms21124523. [ Links ]
59. Lehmann AK, Sornes S, Halstensen A. Phagocytosis: measurement by flow cytometry. J Immunol Methods 2000;243(1-2):229-242. [ Links ]
60. Neaga A, Lefor J, Lich KE, Liparoto SF, Xiao YQ. Development and validation of a flow cytometric method to evaluate phagocytosis of pHrodoTM BioParticles® by granulocytes in multiple species. J Immunol Methods 2013;390(1):9-17. https://www.sciencedirect.com/science/article/pii/S0022175911001517. [ Links ]
61. Simons ER. Measurement of phagocytosis and of the phagosomal environment in polymorphonuclear phagocytes by flow cytometry. Curr Protoc Cytom 2010;51(1):9.31.1-9.31.10. https://onlinelibrary.wiley.com/doi/10.1002/0471142956.cy0931s51. [ Links ]
62. du Preez K, Rautenbach Y, Hooijberg EH, Goddard A. Oxidative burst and phagocytic activity of phagocytes in canine parvoviral enteritis. J Vet Diagn Invest 2021;33(5):884-893. https://doi: 10.1177/10406387211025513. [ Links ]
63. Rothaeusler K, Baumgarth N. Assessment of cell proliferation by 5-bromodeoxyuridine (BrdU) labeling for multicolor flow cytometry. Curr Protoc Cytom 2007;Chapter 7:Unit7.31. [ Links ]
64. Darzynkiewicz Z, Traganos F, Zhao H, Halicka HD, Li J. Cytometry of DNA replication and RNA synthesis: Historical perspective and recent advances based on “click chemistry.” Cytometry A 2011;79A(5):328-37. http://doi.wiley.com/10.1002/cyto.a.21048. [ Links ]
65. Jacobberger JW, Sramkoski RM, Stefan T, Woost PG. Multiparameter cell cycle analysis. In: Methods in molecular biology. Humana Press Inc.; 2018:203-247. [ Links ]
66. Lyons AB, Blake SJ, Doherty KV. Flow cytometric analysis of cell division by dilution of CFSE and related dyes. Curr Protoc Cytom 2013;64:9.11.1-9.11.12. [ Links ]
67. Rout ED, Avery PR. Lymphoid Neoplasia: Correlations between morphology and flow cytometry. Vet Clin North Am Small Anim Pract 2017;47(1):53-70. [ Links ]
68. Yin Y, Mitson-Salazar A, Prussin C. Detection of intracellular cytokines by flow cytometry. Curr Protoc Immunol 2015;110:6.24.1-6.24.18. [ Links ]
69. Lamoreaux L, Roederer M, Koup R. Intracellular cytokine optimization and standard operating procedure. Nat Protoc 2006;1(3):1507-1516. [ Links ]
70. Varro R, Chen R, Sepulveda H, Apgar J. Bead-based multianalyte flow immunoassays: the cytometric bead array system. Methods Mol Biol 2007;378:125-52. [ Links ]
71. Christopher-Hennings J, Araujo KP, Souza CJ, et al. Opportunities for bead-based multiplex assays in veterinary diagnostic laboratories. J Vet Diagn Invest 2013;25(6):671-91. Available from: https://pubmed.ncbi.nlm.nih.gov/24153036/. [ Links ]
72. Ker HG, Coura-Vital W, Valadares DG, Aguiar-Soares RDO, de Brito RCF, Veras PST, et al. Multiplex flow cytometry serology to diagnosis of canine visceral leishmaniasis. Appl Microbiol Biotechnol 2019;103(19):8179-90. https://link.springer.com/article/10.1007/s00253-019-10068-x. [ Links ]
73. Yadav SK, Gangwar DK, Singh J, Tikadar CK, Khanna VV, Saini S, et al. An immunological approach of sperm sexing and different methods for identification of X- and Y-chromosome bearing sperm. Vet World 2017;10(5):498-504. [ Links ]
74. Squires E. Current reproductive technologies impacting equine embryo production. J Equine Vet Sci 2020;89:102981. https://www.sciencedirect.com/science/article/pii/S0737080620300721. [ Links ]
Received: April 28, 2021; Accepted: November 17, 2021
 Este es un artículo publicado en acceso abierto bajo una licencia Creative Commons
