


 nueva página del texto (beta)
 Inglés (pdf)
 Artículo en XML
 Referencias del artículo
 Enviar artículo por email
 Citado por SciELO
  Similares en
SciELO
Similares en
SciELO 
 Permalink
1. Introduction
The impacts of aerosols on the radiation budget and precipitation are topics of many climate studies on both global (e.g., Charlson et al., 1992; Boucher and Lohmann, 1995; Takemura et al., 2005) and regional (e.g., Qian and Giorgi, 1999; Giorgi et al., 2002; Huang et al. 2007; Kim et al., 2012; Salah et al., 2018) scales. Atmospheric aerosols, which are suspensions of solid and liquid particles in air, affect the global climate system by scattering and potentially absorbing shortwave (SW) and thermal (LW) radiation (direct effects). Through their role as cloud condensation and ice nuclei, aerosols can indirectly modify the microphysical and radiative properties of clouds. An increase in aerosol concentrations from anthropogenic sources can lead to increased cloud droplets number concentration with smaller radii, causing more reflected solar radiation (1st indirect or cloud albedo effect [Twomey, 1977]). The smaller cloud droplets decrease precipitation efficiency and consequently increase cloud lifetime, and by adding more cloud water, the fractional cloud cover will increase (2nd indirect or cloud lifetime effect, [Albrecht, 1989]). The absorption of solar radiation by aerosols, such as black carbon, warms the troposphere and contributes to a reduction in cloudiness (semi-direct effect).
The aerosol radiative forcing (ARF) is a common metric to quantify the influence of aerosols on the Earth’s energy balance. The direct and 1st indirect aerosol forcing accounts for a large source of uncertainty in IPCC climate change projections (Lohmann et al., 2010). This uncertainty is due to the wide variety of aerosol composition (e.g., sulfate [SO4 -2], black carbon [BC], organic carbon [OC], dust, sea salt, and nitrate), sources (e.g., rural, urban, deserts, or oceans), the short lifetime of the aerosols in the air, and the chemical and microphysical processes occurring in the atmosphere, including the aerosol-cloud interactions (Menon, 2007; USCCSP, 2009). ARF is defined as the difference in the net radiative flux between the present day total aerosol loading (natural and anthropogenic) and an initial state, which can be defined as no aerosols, pre-industrial aerosol concentrations, or the current estimation of natural aerosol loading. ARF, therefore, varies according to each initial state implemented in model simulations (USCCSP, 2009).
Generally, the sum of direct and 1st indirect ARFs calculated at the top of the atmosphere (TOA) due to anthropogenic aerosols is negative (cooling effect), and estimated to be -1.2 [-0.2 to -2.3] (IPCC, 2007). The other aerosol effects on clouds such as the 2nd indirect and the semi-direct effects cannot be evaluated by the usual definition of ARF, but they can be treated as feedbacks (Lohmann et al., 2010) with changes in the global mean precipitation ranging from 0 to -0.13 mm day-1 (IPCC, 2007).
Anthropogenic aerosols resulted from the rapid industrialization over Asia during the last decades, could be one of many factors causing an observed weakening trend of the East Asian Summer Monsoon (EASM) and the southward shift of rain belt (Xu, 2001; Menon et al., 2002; Zhao et al. 2006; Chen et al., 2016; Dong et al., 2019). EASM, which is a subtropical monsoon system, influences most of East Asia regions, resulting in heavy rainfall during the summer. The EASM has large effects on water resources, agriculture and human society in different East Asian countries, because it provides most of their annual precipitation (Wang et al., 2018). Jiang et al. (2013) suggested that all anthropogenic aerosols lead to a precipitation reduction in North China and an increase in South China and regions near the Pacific Ocean. Guo et al. (2013) found that precipitation reduces in September by 26.4% for SO4 2- and 14.6% for BC based on the emissions levels of 2000.
Regional climate model studies using the ICTP Regional Climate Model (RegCM) estimated the cooling at TOA due to the direct and 1st indirect effects of SO4 2- over eastern Asia by -8 Wm-2 and -15 Wm-2 in winter and summer, respectively (Qian and Giorgi, 1999; Giorgi et al. 2002). Huang (2005) and Huang et al. (2007) investigated the effects of three anthropogenic aerosols (SO4 2-, BC and OC) with different auto-conversion parameterizations and found that the combined effects of direct, semi-direct and 1st and 2nd indirect over East Asia reduced precipitation up to 30%.
Using the same procedures than Salah et al. (2018) to study aerosol effects on the West African Monsoon, we continued the investigation of the impact of various autoconversion parameterization rates on different meteorological parameters over East Asia, by focusing on EASM. Section 2 presents the methods of parameterization of the indirect effects used in the simulations. Section 3 describes the model structure and the simulation setup. Results and conclusions are presented in sections 4 and 5, respectively.
2. Model description and simulation setup
2.1 Model description
We used the ICTP regional climate model (RegCM4.1.1), which is a hydrostatic model with sigma-vertical levels (Giorgi et al., 2012). The radiative transfer processes have been parameterized using the NCAR Community Climate Model (CCM3) (Kiehl et al., 1996). The solar spectrum optical of the cloud properties depend on three parameters: (a) the cloud liquid water path, which is derived from the amount of cloud liquid water content calculated by the model, (b) the fraction of the cloud cover, which is calculated as a function of relative humidity, and (c) the effective radius of the cloud droplets, which is represented as a function of temperature and land sea mask for a liquid phase cloud, and as a function of height for an ice phase cloud (Giorgi et al., 2012). The Biosphere-Atmosphere Transfer Scheme (BATS) (Dickinson et al., 1993) was used for land-surface processes, and the scheme of Holtslag (Holtslag et al., 1990) to represent the boundary-layer processes. For convection, we used a modified version of the Kuo scheme of Anthes (1977), as described by Anthes et al. (1987). Non-convective clouds and precipitation were based on the Subgrid Explicit Moisture Scheme (SUBEX) (Pal et al., 2000). The simulations presented here used a simplified aerosol scheme designed for long-term climate simulations. Solmon et al. (2006) implemented an aerosol model including SO4 2-, OC and BC. The scattering and absorption of solar radiation by aerosols are also included based on the aerosol optical properties, including the absorption coefficient and single-scattering albedo, which are both depend on aerosol composition (Solmon et al., 2006).
2.2 Parameterization of auto-conversion processes
In RegCM4, the formation of non-convection precipitation is represented by the SUBEX, in which a Kessler-type formula (KS) (Kessler, 1969) converts cloud drops to rain drops by a defined auto-conversion rate. Precipitation (P) is assumed to form in any atmospheric level when the cloud water content (W L ) exceeds the threshold value (W L th ), as in the following relation:
where P is the raindrop formation rate (kg index-kg-1 s-1), 1/C ppt is the characteristic time for which cloud droplets are converted into raindrops, and f c is the cloud fraction. The threshold value is obtained as a function of temperature according to the following relation derived by Gultepe and Isaac (1997):
where T is the temperature in ºC, and C acs = 0.4 is the autoconversion scale factor (Pal et al., 2000). Thus to include the effect of aerosols on the lifetime of clouds and their efficiency to precipitate (2nd indirect effect), the auto-conversion rate is modified to depend on the number of cloud droplets (N c ) and their effective radius (r e ) as well as cloud liquid water content (W L ). In this regard, we tested three autoconversion schemes, which have been used and mentioned in details by Salah et al. (2018): (1) Beheng (1994, based on a study by Lohmann and Feichter (1997), hereinafter the BH scheme; (2) Tripoli and Cotton (1980), referred here as the TC scheme, and (3) the auto-conversion parameterization (R6 scheme) of Liu and Daum (2004a , b).
Our baseline control simulation is similar to the one used by Huang et al. (2007), with an updated version of the model RegCM4.1.1, and an additional auto-conversion scheme (R6) with another kind of data.
2.3 Data and experimental design
Simulations were conducted over East Asia, a region characterized by high concentrations of anthropogenic and natural aerosols. The model domain was centered over 34º N and 120º E, with 80 × 104 model grid cells at a spatial resolution of 60 km. The atmosphere was represented by 18 sigma levels, with the model top at 10 hpa. All simulations used the reanalysis global data NNRP2 for the meteorological initial and lateral boundary conditions, the NOAA Optimum Interpolation Sea-Surface Temperature weekly data (OI_WK) V2 as sea surface temperature, the Emission Database for Global Atmospheric Research (EDGAR) for aerosol emissions, and the MOZART4 model output as the chemical boundary conditions. The 15-month simulations ran from June 1, 1994 to September 1, 1995, with the first two months being removed for model spin-up. We simulated aerosols included SO4 -2, and hydrophobic and hydrophilic BC and OC with source emissions from the EDGAR database.
To investigate the aerosol effects on EASM, we performed 10 sensitivity analyses with a varying treatment of aerosols in the atmosphere. In the control runs (ctrl_run, ctrl_BH, ctrl_TC, and ctrl_R6), four different auto-conversion schemes were used (KS, BH, TC, and R6, respectively). In these control simulations, the radius of the cloud droplets was constant (10 µm); these simulations did not include the effects of aerosols on radiation and clouds.
As illustrated in Table I, the runs of dirBC and dir0 included the direct effect of all aerosols with and without BC, respectively, with a constant cloud droplet size. The first indirect effect of aerosols was explored with an additional simulation (Indir1); this simulation allowed the size of cloud droplets to change according to the aerosol concentrations. The combined effects of all aerosols (direct, 1st indirect, and 2nd indirect) were included in the runs of all_BH, all_TC, and all_R6 for the three new auto-conversion schemes.
Table I List of the experiments performed in this study.
| Experiment | ctrl_run | ctrl_BH | ctrl_TC | ctrl_R6 | dir0 | dirBC | Indir1 | all_BH | all_TC | all_R6 |
| Auto- conversion scheme | KS | BH | TC | R6 | KS | KS | KS | BH | TC | R6 |
| Aerosols | All1 | All | All | All | All - BC | All | All | All | All | All |
| Aerosol effect | none | none | none | none | Direct | Direct | Direct+ 1st indirect | Direct+ 1st +2nd indirect | Direct+ 1st +2nd indirect | Direct+ 1st +2nd indirect |
| Cloud droplet number | Fixed (10µm) | Fixed (10µm) | Fixed (10µm) | Fixed (10µm) | Fixed (10µm) | Fixed (10µm) | predicted | predicted | predicted | predicted |
1All: SO4 2 + BC + OC (biomass burning and anthropogenic).
The observational climate data set used to evaluate the model performance and to assess the anthropogenic aerosol effects has been developed by the Climate Research Unit (CRU) of East Anglia University (Mitchell and Jones, 2005), which includes monthly surface air temperature and precipitation over land from 1901 to 2009 gridded at a resolution of 0.5º.
3. Results and discussion
3.1 Control runs (without aerosol climate interactions)
In Figure 1, the spatial distribution of seasonal temperature differences between the ctrl_run and CRU shows that a warm bias exists in northern China, especially in winter and summer (Fig. 1b, d, respectively), and a cold bias exists in the southern domain in fall and winter (Fig. 1a, b, respectively). Figure 2 represents the spatial distribution of seasonal precipitation differences between ctrl_run and CRU. The cold bias in winter is accompanied by more precipitation inland than observed in southern regions (Figs. 1b and 2b). However, in the summer (Fig. 1d) when a warm bias occurs over much of the domain, the model simulates more precipitation than CRU inland in the eastern regions and less precipitation in the southern regions (Fig. 2d) in conjunction with the warm bias.
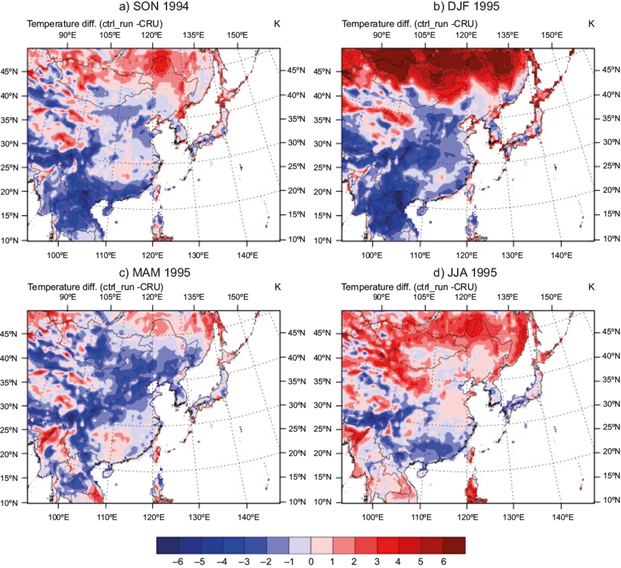
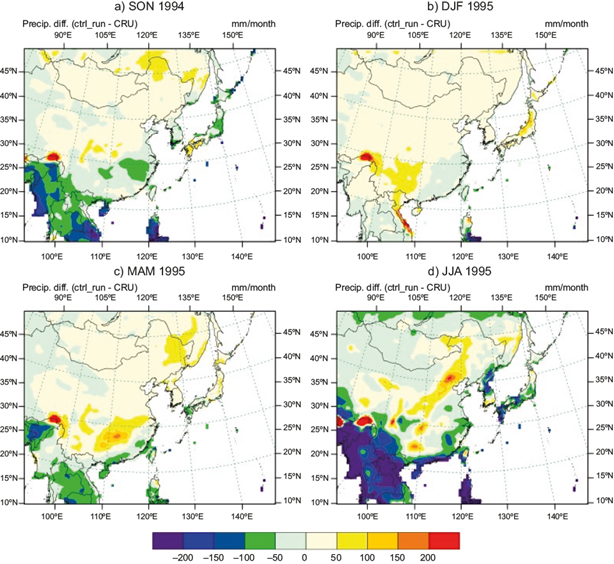
Fig. 2 Seasonal mean difference between the ctrl_run and CRU observations for precipitation (in mm month-1).
Figure 3 shows the variation in monthly mean surface-air temperature, precipitation, and total cloud cover in the control run simulations when changing the auto-conversion parameterizations. It can be noticed from Figure 3a that all the various control runs produce a warm bias in the winter months relative to the CRU surface-air temperature, and the KS and BH auto-conversion schemes give higher temperatures than CRU during the summer months. The TC and R6 parameterizations (ctrl_TC, and ctrl_R6, respectively) produce less precipitation over the domain than the Kessler parameterization (ctrl_run), but the BH scheme (ctrl_BH) simulates more precipitation than ctrl_run (Fig. 3b). All model configurations reproduce the seasonal variations of the East Asian climate with a dry cold winter and a wet warm summer with an onset of the monsoonal precipitation in spring. In general, the four control runs produce less precipitation than CRU in summer (Fig. 3b), actually underestimating the monsoon precipitation by a factor of two. The three schemes of BH, TC, and R6 lead to less total cloud cover than the control run using the KS scheme (Fig. 3c), but all these parameterizations produce a cloud cover greater than the CRU observations by about 40% in summer and more than 90% in winter.
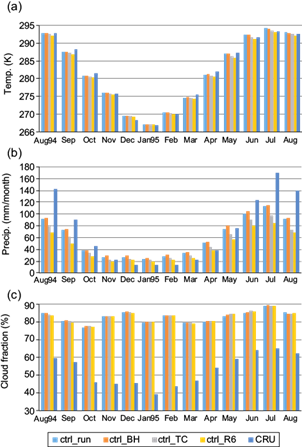
Fig. 3 Monthly means of simulated and observed parameters averaged over the simulation domain: (a) simulated surface air temperature (K) with CRU observations, (b) simulated precipitation (mm month-1) with CRU observations, and (c) simulated total cloud fractional cover (%) with CRU observations. Results represent four control runs.
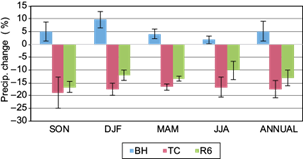
Figure 4 shows the variations in rainfall produced by the control run of simulations with different auto-conversion parameterizations with respect to the base model control run (ctrl_run). The runs of ctrl_TC, and ctrl_R6 produced less precipitation over the domain than ctrl_run, but ctrl_BH simulates more precipitation than ctrl_run. Precipitation decreases in all seasons for the TC scheme, with the greatest decrease in the fall (-19%) and a decrease of up to -17% in spring, with similar patterns for the R6 scheme (-17% in the fall and -10% in the spring). For the BH scheme, precipitation increases slightly in the winter (10%) and summer (< 2%). These varying responses are due to the different auto-conversion treatments. For example, in the KS scheme the cloud droplets are converted to rain drops when the cloud liquid water content (W L ) exceeds a critical value. In the TC scheme, rain can occur if the number of cloud droplets have a radius of 20 µm (N c20 ) that exceeds 103 m-3, so that at low liquid water content, the auto-conversion is activated, provided the aerosol concentrations are sufficient to achieve this condition. In the R6 scheme, the auto-conversion occurs when R6 exceeds R6c that increases with low W L and vice versa. In contrast, the BH scheme without a threshold simulates more rainfall than the other scheme.
3.2 Aerosol direct, semi-direct, and 1st indirect effects
We investigated the seasonal changes in the ARF, temperature, and precipitation resulting from the direct, semi-direct and 1st indirect effects of aerosols. Table II summarizes the seasonal means of aerosol optical depth (AOD), column concentration of SO4 2-, OC and BC, ARF at the surface (RF_SRF) in the clear and cloudy sky, and at TOA (RF_TOA), and changes in surface air temperature and precipitation as simulated in the basic control run (ctrl_run), the dir0, dirBC, and Indir1 simulations relative to ctrl_run.
Table II Seasonal mean AOD, column concentration of simulated aerosols (µg m-2), differences in net solar radiation reaching the surface (RF_SRF) and TOA (RF_TOA), surface-air temperature change (∆T; K), and precipitation change (∆P; mm month-1) relative to ctrl_run using the original scheme of auto-conversion rate of Kessler.
| Experiment | SON | DJF | MAM | JJA | Annual | |
| AOD | ctrl_run | 0.21 | 0.20 | 0.20 | 0.27 | 0.22 |
| SO4 (µg m-2) | ctrl_run | 18.01 | 13.88 | 15.61 | 20.03 | 16.88 |
| OC*1e3 (µ m-2) | ctr__run | 20.54 | 16.62 | 17.86 | 17.45 | 18.12 |
| BC*1e3 (µg m-2) | ctrl_run | 18.35 | 14.80 | 16.03 | 15.82 | 16.25 |
| ARF_SRF (Wm-2) clear sky | dir0-ctrl_run | 0.07 | 0.00 | 0.02 | -0.06 | 0.01 |
| dirBC-ctrl_run | 0.00 | 0.01 | -0.02 | -0.13 | -0.03 | |
| Indir1-ctrl_run | 0.01 | -0.01 | 0.02 | -0.03 | 0.00 | |
| ARF_SRF (Wm-2) all sky | dir0-ctrl_run | -0.25 | -0.56 | -0.92 | -0.74 | -0.59 |
| dirBC-ctrl_run | -0.85 | -0.49 | -0.87 | -1.03 | -0.81 | |
| Indir1-ctrl_run | -3.03 | -2.58 | -4.54 | -5.68 | -3.96 | |
| ARF_TOA (Wm-2) all sky | dir0-ctrl_run | -0.30 | -0.57 | -0.89 | -0.55 | -0.58 |
| dirBC-ctrl_run | -0.83 | -0.50 | -0.83 | -0.96 | -0.78 | |
| Indir1-ctrl_run | -3.60 | -2.98 | -5.01 | -6.64 | -4.56 | |
| ∆T (K) | dir0-ctrl_run | -0.06 | -0.08 | -0.04 | 0.02 | -0.04 |
| dirBC-ctrl_run | -0.07 | -0.07 | -0.04 | 0.02 | -0.04 | |
| Indir1-ctrl_run | -0.29 | -0.48 | -0.26 | -0.33 | -0.34 | |
| ∆P (mm month-1) | dir0-ctrl run | -346.68 | -0.59 (-2.28) | -0.73 (-1.27) | -1.05 (-0.89) | -0.91 (-1.85) |
| dirBC-ctrl_run | -0.97 (-2.35) | -0.61 (-2.38) | -0.59 (-1.09) | -1.93 (-1.77) | -1.03 (-1.90) | |
| Indir1-ctrl_run | -4.41 (-9.28) | -2.39 (-9.19) | -2.87 (-5.80) | -3.62 (-3.47) | -3.32 (-6.94) |
Notes: All values were averaged over the land only; the relative change in total precipitation is given in percent (in brackets).
3.2.1 Seasonal mean of simulated aerosols
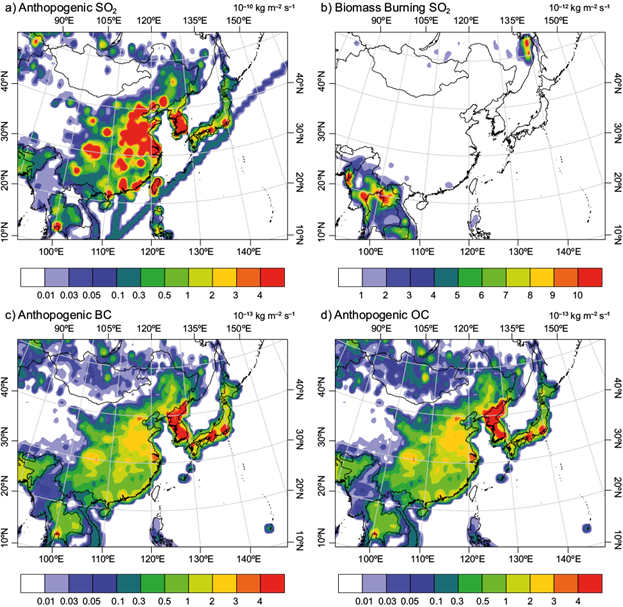
Fig. 5a, b shows the distributions of the anthropogenic and biomass burning emissions of SO2, respectively, along with the anthropogenic emissions of BC and OC (Fig. 5c, d, respectively). The monthly mean aerosol column burden included in our simulations (Table II) shows that SO4 2- decreases in winter and increases in summer and fall months, while BC and OC decrease in winter and increase in the fall. In addition, Table II shows the highest seasonal mean of AOD of 0.3 occurs in summer coincident with the maximum column burden of SO4 2-.
3.2.2 Direct effects of SO4 2- and OC (dir0 experiment)
Changes in the seasonal averaged solar radiation reaching the surface due to the aerosol direct effect (RF_SRF) are listed in Table II. For clear sky, there is no substantial change in solar radiation resulting from the addition of SO4 2- and OC (e.g., dir0 relative to the ctrl_run), with domain average changes less than ± 0.1 Wm-2. For all-sky, there is a negative forcing in all seasons with the maximum in spring and summer of -0.9 and -0.7 Wm-2, respectively. The annual change of solar radiation at the surface (-0.59 Wm-2) results in a decrease in surface air temperature (-0.04 K) due to the direct effect of sulfate and organic carbon. The largest percentage decreases in precipitation occurred in the fall and winter, when the direct effect of SO4 2- and OC (dir0) causes reduction of rainfall of -3% and -2.3% in fall and winter, respectively (Table II).
3.2.3 BC effect (dirBC experiment)
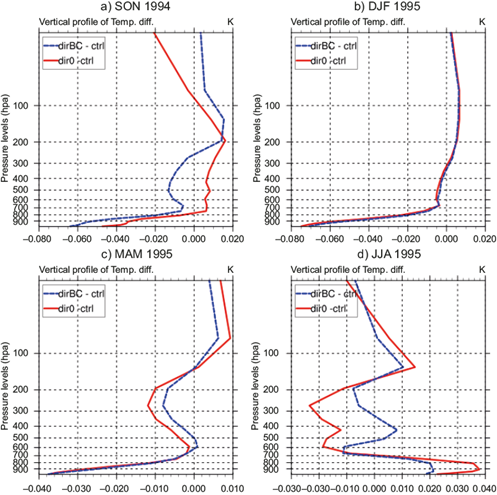
We will now examine the effects of adding BC to SO4 2-and OC aerosols, which are treated as externally mixed in the model (Solmon et al., 2006). BC increases cooling at the surface by absorbing solar radiation, and at the same time it heats the atmosphere by absorbing the downward solar radiation and the scattering shortwave from the surface and clouds (Seinfeld and Pandis, 2006). For our simulations, BC slightly reinforces the negative cooling at the surface in all seasons in the clear-sky cases except the winter, which has the lower column concentration of BC (Table II). The total annual effect is a slight cooling at the surface (-0.03 Wm-2). In the cloudy sky, this cooling increased due to the presence of clouds, increasing the annual mean cooling effect 26% more than the clear-sky case to reach the value of -0.81 Wm-2 (Table II). The direct ARF at TOA, which is defined as the summation of the forcing at the surface and in the atmospheric column, is stronger in the fall and summer (-0.8 and -1 Wm-2 as compared to -0.3 and 0.6 W m-2, respectively, in dir0), and weaker in the winter and spring (-0.5 and -0.8 Wm-2 as compared to -0.6 and -0.9 Wm-2, respectively, in dir0). The results in Table II suggest that BC’s effect is relatively weak on the surface temperature in this region in all seasons (e.g., less than 0.1 K). However, there is an obvious effect of BC on the vertical temperature profile in between the levels from 600 to 200 hpa in fall, spring, and summer with little change in winter (Fig. 6). By adding black carbon, the precipitation reduction decreases in the fall and spring and increases slightly in winter and summer, relative to the direct effect without BC. In summer and spring, the addition of BC decreases lower tropospheric temperatures (from the surface up to 700 hpa), but causes warming in a layer from 700 to 200 hpa, especially in summer (Fig. 6d). This increases the stability of the boundary layer and can decrease the development of clouds, consequently decreasing the precipitation as observed by Huang et al. (2007) and Jiang et al. (2013).
3.2.4 1st indirect effect (Indir1 experiment)
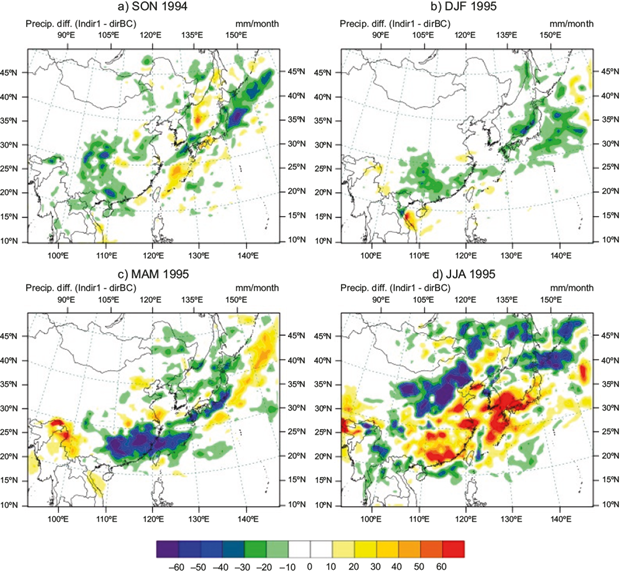
The simulation of Indir1 (including direct, semi-direct and 1st indirect effects) reinforces the negative forcing of the direct effect by decreasing the cloud droplet size and increasing cloud reflectivity. This also increases the cooling at the surface with the maximum in the summer (-6 Wm-2) under cloudy sky (Table II). Adding the 1st indirect effect (Indir1) generally cools the surface-air temperatures over continental areas by about -0.3 degrees annually (Table II), and reduces precipitation by -9% in SON and DJF and -6% in MAM, with weaker effects on JJA with a precipitation reduction of -3%. As shown in Figure 7d, adding the 1st indirect effect to dirBC increases the precipitation more than 60 mm month-1 over the eastern coasts of East Asia, and decreases it over the inland north regions. Whereas in the fall, winter and spring (Figures 7a, b, and c, respectively) the decrease in rainfall is the dominant impact of Indir1 simulation with small areas of surplus rainfall.
3.3 Aerosol effects on EASM
Here we discuss the aerosol effects (direct, semi-direct, and 1st and 2nd indirect effects) on temperature and precipitation during EASM, using the different auto-conversion parameterizations (KS, BH, TC, and R6, as in section 2). The EASM is an important source of precipitation in the region and the dominant climatological feature in the summer.
3.3.1 Combined aerosol effects (all_BH, all_TC, and all_R6) on EASM
Table III summarizes the changes in the atmospheric and radiative quantities due to the parameterization of the indirect effects, including the mean of total cloud fractional cover (ΔCLD) and cloud liquid water path (weighted by cloud fraction) (ΔCLWP), the planetary albedo (ΔPALB), SW and LW radiation flux at TOA, surface temperature and total precipitation during the summer season. In Table III, results are presented as spatially averaged over the land-only model domain for the four auto-conversion parameterization experiments relative to the corresponding control experiments (i.e. all_BH - ctrl_BH, all_TC - ctrl_TC, and all_R6 - ctrl_R6).
Table III Changes in summer (JJA) mean of total cloud fractional cover (ΔCLD), cloud liquid water path weighted by cloud fraction (ΔCLWP), planetary albedo (ΔPALB), short-wave (SWR), long-wave (LWR) at TOA, temperature (ΔT) and precipitation (ΔP) for the combined aerosol effects with different auto-conversion schemes (all_BH, all_TC, and all_R6) relative to their control runs (ctrl_BH, ctrl_TC, and ctrl_R6). All results were averaged over the model domain land grid only.
| Experiments | all_BH | all_TC | all_R6 |
| ACLD (%) | -0.24 | 0.18 | -0.25 |
| ACLWP (%) | 12.53 | 6.64 | 3.96 |
| APALB (%) | 4.79 | 3.14 | 2.17 |
| SWR (Wm-2) | -5.94 | -3.92 | -3.84 |
| LWR (Wm-2) | 0.13 | 0.60 | 1.35 |
| ∆T (K) | -0.44 | -0.41 | -0.42 |
| ∆P (%) | -7.60 | -5.03 | -7.56 |
Including all aerosol effects, cloud cover decreased by less than -0.2% with the BH and R6 schemes, whereas it increased 0.2% with TC (Table III). CLWP increases from 4-13% in the three auto-conversion simulations. These results show that the auto-conversion scheme of BH has the strongest impact on CLWP and precipitation as compared to the R6 and TC schemes. This could be due to the lack of a critical threshold for cloud droplet conversion in the BH scheme as is present in the other schemes. These changes in cloud cover and CLWP due to including combined aerosol effects, resulted in an increase in the planetary albedo of up to 5% using the BH scheme (Table III).
The combined aerosol effects further reduced the SW radiation in the BH auto-conversion scheme as compared to the TC and R6 schemes. However, there is an increase in the TOA LW radiation, especially for the BH parameterization (Table III). The experiments of all_BH, all_TC, and all_R6 reinforce the reduction of temperature and precipitation (ΔT, and ΔP, respectively) resulting from the 1st indirect effect (Indir1; Table II). Specifically, the BH and R6 experiments reduce precipitation by -8% and temperature by -0.4 K (Table III).
3.3.2 Different aerosol effects on EASM ARF, temperature and rainfall
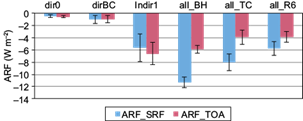
Figure 8 illustrates the surface and TOA ARF (RF_SRF and RF_TOA, respectively) due to direct and indirect aerosol effects in JJA 1995. BC adds more cooling to SO4 2- and OC at the surface and TOA, but this cooling does not exceed -1 Wm-2. Whereas Indir1 run makes ARF_SRF and ARF_TOA more negative (< -5 and -6 Wm-2, respectively). By adding the 2nd indirect effect, the cooling at the surface increases with all auto-conversion schemes (ARF_SRF < -11 Wm-2 with BH scheme), but at TOA there is a warming with all auto-conversion schemes compared to Indir1 simulation (ARF_TOA = -6 Wm-2).
Figures 9 and 10 show the spatial distribution of the summer temperature and precipitation change due to the aerosol direct and indirect effects for the simulations of (a) dir0, (b) dirBC (c) Indir1, (d) all_BH, (e) all_TC, and (f) all_R6 relative to ctrl_run, to show their different impacts on temperature and rainfall during the summer monsoon. Figure 9a shows that the direct effect of SO4 2- and OC (dir0) results in relatively small decreases in temperature (less than 0.5 K) over the eastern coast of China with some temperature increase over the inland. By adding BC, the area of higher temperature over the ocean increased but temperature changes are still relatively small (< 0.5 K) (Fig. 9b). However, the addition of the 1st indirect effect decreased the temperature by about -1K over most of the region.
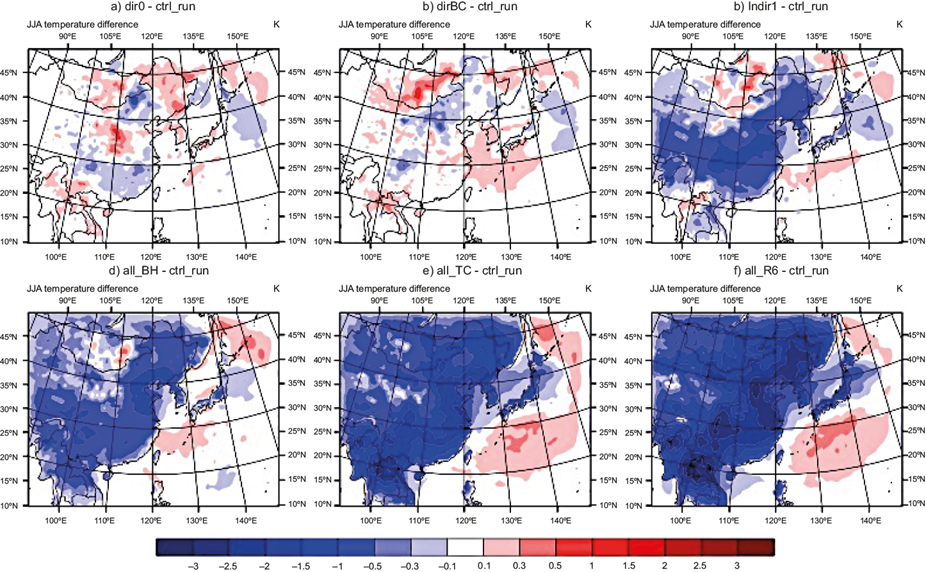
Fig. 9 JJA temperature change (K) resulting from the variations of aerosol direct and indirect effects for the simulations of (a) dir0, (b) dirBC (c) Indir1, (d) all_BH, (e) all_TC, and (f) all_R6. All changes are relative to the basic control run (ctrl_run).
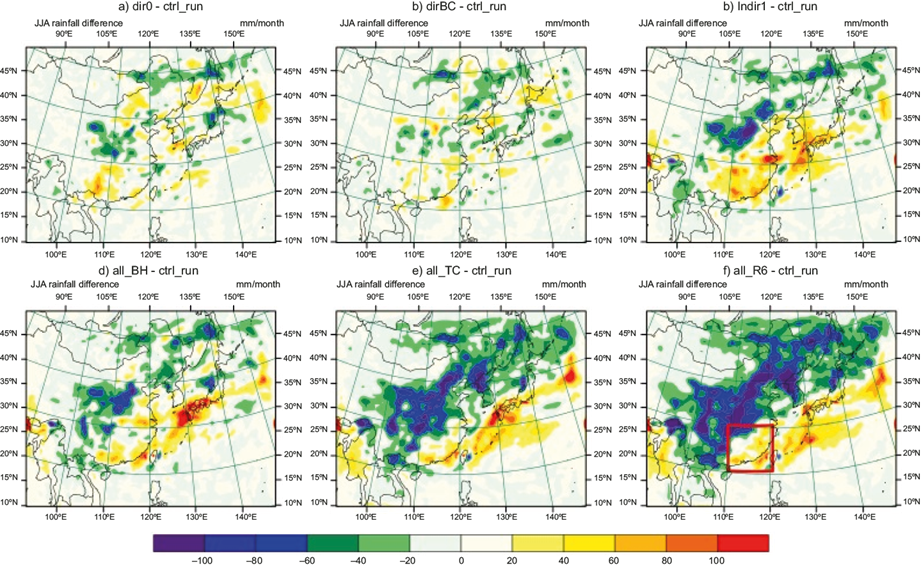
Fig. 10 JJA total precipitation change (mm month-1) resulting from the variations of aerosol direct and indirect effects for the simulations of (a) dir0, (b) dirBC (c) Indir1, (d) all_BH, (e) all_TC, and (f) all_R6. All changes are relative to the basic control run (ctrl_run).
The inclusion of the 2nd aerosol effect with the different auto-conversion parameterizations (all_BH, all_TC, and all_R6) further decreased the temperature over almost all the continental regions (Fig. 9d, e, f, respectively). Cold biases are up to 3 K in some regions with the R6 scheme. This suggests that surface temperatures are most sensitive to the combined effects of the direct and indirect parameterizations.
As shown before in Figure 3d, the basic control run reproduced the main features of the JJA rainfall but underestimated the magnitude of precipitation as compared to the CRU dataset, especially over the regions on the Bay of Bengal and the Korean peninsula. As noted with the surface temperature, changes in precipitation are relatively small and spatially inhomogeneous in the direct effects experiments (dir0 and dirBC; Fig. 10a, b, respectively); they decrease inland precipitation and increase precipitation near the coasts. This increased precipitation on the eastern coast of China and near Japan is enhanced by adding the 1st indirect effect (Fig. 10c), and the amount of rainfall changing up to ± 100 mm month-1 in some regions. Closely linked to temperatures, the largest changes in the simulations occur when all effects of aerosols are included, which leads to large changes in precipitation within the region (-6, -20, and -30% using BH, TC, and R6 auto-conversion parameterizations, respectively).
This spatial change in precipitation patterns is consistent with a weakening of the EASM, where cooler land temperatures reduce the land-ocean temperature gradient that drives the monsoon inward, leading to more precipitation near the coast and less precipitation inland as observed in other modeling studies (Huang et al., 2007; Liu et al., 2011; Jiang et al., 2013). This effect of the temperature gradient on the summer monsoon is strengthened substantially by including the 2nd indirect effect with the different auto-conversion schemes (all_BH, all_TC, and all_R6; Fig. 10d, e, and f, respectively), which leads to intense reduction of rainfall along the eastern regions of East Asia and limit the rainfall surplus in the adjacent ocean regions. The most increases of precipitation over the land occurred in the region between 20-30º N and 110-120º E on the China eastern coast (surrounded by a red square in Fig. 10f).
4. Summary and conclusions
The RegCM4 model was used to investigate the effects of sulfate and carbonaceous aerosols on the regional climate over East Asia, focusing on their impacts on EASM using different auto-conversion parameterizations. The direct, semi-direct, and indirect effects were investigated individually and in a combined simulation to explore the role of aerosols in the climate of the region. It was found that the direct, semi-direct, and 1st indirect aerosol effects generate a surface cooling that is reinforced when simulating precipitation inhibition. The largest reduction of rainfall occurred in fall and winter, when the direct effect decreased precipitation by 2-3% with no substantial difference between the influence of direct and semi-direct effects on precipitation. However, the inclusion of the first indirect effect further decreased precipitation up to about 9% in SON and DJF. The cooling effect of SO4 -2 was dominant in all seasons, and the BC effect was relatively weak in our simulations. The combined effects in the simulations (including the direct, semi-direct, 1st and 2nd indirect effects) indicated that the model exhibits more sensitivity in precipitation when including the indirect effects than the direct effects alone. The results showed that the presence of atmospheric aerosols could alter the migration and magnitude of the monsoon system. The simulations revealed that the EASM system is likely to be very sensitive to the indirect effect parameterization or treatment in models, and this inclusion can improve these models' accuracy.

