


 nueva página del texto (beta)
 Inglés (pdf)
 Artículo en XML
 Referencias del artículo
 Enviar artículo por email
 Citado por SciELO
  Similares en
SciELO
Similares en
SciELO 
 Permalink
Introduction
Two recent earthquakes in the Mexican Republic generated subsidence and morphologic modifications in Mexico City and its environs. The earthquakes occurred on September 8, 2017 with a magnitude of Mw 8.1 and on September 19, 2017 with a magnitude of Mw 7.1. A project was then undertaken to study and quantify the resulting responses. In particular, interest in the subsidence and morphologic modifications was identified associated with the construction of a new airport in the northeast part of Mexico City. Subsidence is the sudden sinking or gradual downward settling of the ground's surface with little or no horizontal motion. The definition of subsidence is not restricted by the rate, magnitude, or area involved in the downward movement. It may be caused by natural processes or by human activities.
To investigate this, a set of Sentinel satellite radar images for the performance of interferometric synthetic aperture radar (InSAR) analysis was considered. Four sets of interferometric pairs were used: one pair before the earthquakes, one pair spanning the earthquake of September 19 and two pairs after the earthquakes (Table 1). In addition, two SPOT (Satellite Pour l'Observation de la Terre) 6/7 images captured in November were used in conjunction with a Sentinel-1 IW GRD radar image to quantify the texture and spectral modifications in the study area (Table 2). The joint use of radar and optical images was dubbed radar/optic synergism.
Table 1 Technical characteristics of Sentinel-1 radar images.
| Pair | Date | Polarization | Mode | Rg, Az (m) | Base Line (m) | Doppler (Hz) |
| 1 | August 12, 2017 | VV, VH | Descending | 5 × 20 | 14.88 | 1.17 |
| August 24, 2017 | VV, VH | Descending | 5 × 20 | |||
| 2 | September 11, 2017 | VV, VH | Descending | 5 × 20 | 32.7 | -1.47 |
| September 23, 2017 | VV, VH | Descending | 5 × 20 | |||
| 3 | October 5, 2017 | VV, VH | Descending | 5 × 20 | 30.21 | -0.19 |
| October 17, 2017 | VV, VH | Descending | 5 × 20 | |||
| 4 | November 16, 2017 | VV, VH | Descending | 5 × 20 | -5.96 | 1.28 |
| November 28, 2017 | VV, VH | Descending | 5 × 20 |
Rg - Range. Az - Azimuth.
The acquisition mode is IW TOPS, SLC. The acquisition time difference is 12 days for all pairs.
Table 2 Basic technical details of the SPOT 6/7 and Sentinel-1 images for synergism.
| Dimension (pixels) | Pixel (m2) | Date | Sensor |
| 9,650 × 8,260 | 5 × 5 | November 12, 2017 | SPOT 6 |
| 9,651 × 10,193 | 5 × 5 | November 20, 2017 | SPOT 7 |
| 25,261 × 16,772 | 20 × 20 | November 16, 2017 | Sentinel-1 |
Level 1A - Correction of radiometric anomalies for SPOT images. Cartographic projection UTM, WGS84 for all images.
Studies of subsidence in the Mexico City area and at several airports and cities have been published in the scientific literature (Du et al., 2018). To study the regional-scale deformation of Pudong international airport in China, Persistent Scatterer SAR Interferometry (PSI) was applied to high resolution TerraSAR-X radar images (Jiang et al., 2016). An assessment of the spatial and temporal deformation in the area of the airport was conducted. This assessment confirmed that PSI is a reliable method for obtaining deformation patterns due to subsidence phenomenon. In Jassar and Rao (Jassar and Rao, 2011; Kampes, 2006), the PSI technique was applied to overcome the limitations introduced by decorrelations and atmospheric interference. This technique has proved to be particularly useful whenever highly reflective, stable structures exist in the area of interest, such as an airport or a city.
To study the temporal variations of deformations, a time-series interferometric analysis must be considered. A time series using TerraSAR-X radar images to study ground subsidence in Hong Kong international airport was performed by Sun and coworkers (Sun et al., 2016) who employed a nonlocal interferogram estimation to improve the differential interferogram and to derive a map of the deformation rate in the area of the airport.
A set of Radarsat-2 radar images was used by Short and coworkers (Short et al., 2014) to derive the spatial patterns of seasonal ground displacement in the area of the Iqaluit Airport on Baffin Island, Canada. Comparison with ground data indicated a good agreement with the interferometric results for dry areas. However, for wet zones with saturation and flooding, the interferometric results underestimated the true settlement, and the coherence resulted in low values making the interferometric procedure unreliable.
Mexico City is located on a lacustrine basin formed by highly compressible clays. The basin was the site of seven lakes that were desiccated as the city grew from Spanish colonial times up to the present. The extraction of ground water by means of artesian wells has caused an important subsidence phenomenon, in some spots reaching up to nine meters in the 20th century.
Land subsidence in the area of Mexico City has been studied by several authors (Strozzi and Wegmüler, 1999; Osmanoğlu et al., 2011; Chaussard at el., 2014; Sowter et al., 2016). Strozzi and Wegmüller (Strozzi and Wegmüler, 1999) prepared a map of the subsidence rate by means of interferometric processing of a stack of ERS1/2 radar images. Ground water extraction in the area of Mexico City for human consumption has generated a variable spatial pattern of subsidence. Using a set of 23 radar images captured by the ENVISAT/ ASAR Satellite, a PSI study of subsidence in Mexico City was conducted by Osmanoğlu and coworkers (Osmanoğlu et al., 2011). The results of this study confirmed the earlier results of Strozzi and Wegmüller (Strozzi and Wegmüler, 1999). Data from field work acquired by means of GPS (Global Positioning System) were also in good agreement with the interferometric results (Osmanoğlu et al., 2011). The spatial patterns derived from the work of Osmanoğlu and co-workers indicated that ground water extraction greatly exceeded aquifer recharge during the rainy season.
The Sentinel constellation has provided high quality radar images in a timely fashion for extended regions of Earth's surface, and the PSI technique has provided accurate deformation rates for urban areas since buildings and street structures generate stable scatterers over time (Osmanoğlu et al., 2011). However, the PSI technique has failed to produce reliable results for rural areas and agricultural farmlands. The Intermittent Small Baseline Subset (ISBAS) method has been demonstrated to be wellsuited for analyzing wide-areas with a broad range of land classes. An ISBAS time-series analysis of 18 interferometric radar images in Mexico City and its environs was used to calculate subsidence velocities (Sowter et al., 2016).
Subsidence was generated in the Mexico City area due to the earthquakes that occurred in the south-central area of Mexico in September of 2017. In particular, at the construction site for the new airport, a complex pattern of subsidence was observed. In addition to the subsidence, the texture of the Mexico City area shows a change in pattern related to modifications of the surface. To evaluate the subsidence of the study area, four interferometric pairs and four displacement maps derived from Sentinel-1 radar images were considered. Interferometric pairs were selected from before and after the earthquake. To obtain the texture, a synergism of Sentinel-1 radar images and SPOT 6/7 optical images was considered. Technical data of acquired images are given in Section 2.1. Details about the interferometric procedure are provided in Sections 2.2.1 and 2.2.2 The synergism is explained in detail in Section 2.2.3. A detailed discussion of the results is provided in Section 3.
2. Materials and methods
2.1 Materials
A set of radar images from the Sentinel-1 sensor were acquired from the Copernicus Hub. The acquisition mode was IW,TOPS and SLC. The basic technical characteristics of such images are given in Table 1. Four interferometric pairs of these images were considered (Table 1). In addition to the Sentinel-1 radar images, two optical images captured by the SPOT 6/7 satellite were acquired. Both the radar images and the optical images cover the area of study (Figure 1). The basic technical characteristics of the optical images are provided in Table 2. For the synergism task, the radar and optical images were coregistered and resampled to have the same pixel size. A subset covering most of Mexico City was extracted from the intersection of the images (Figure 1).
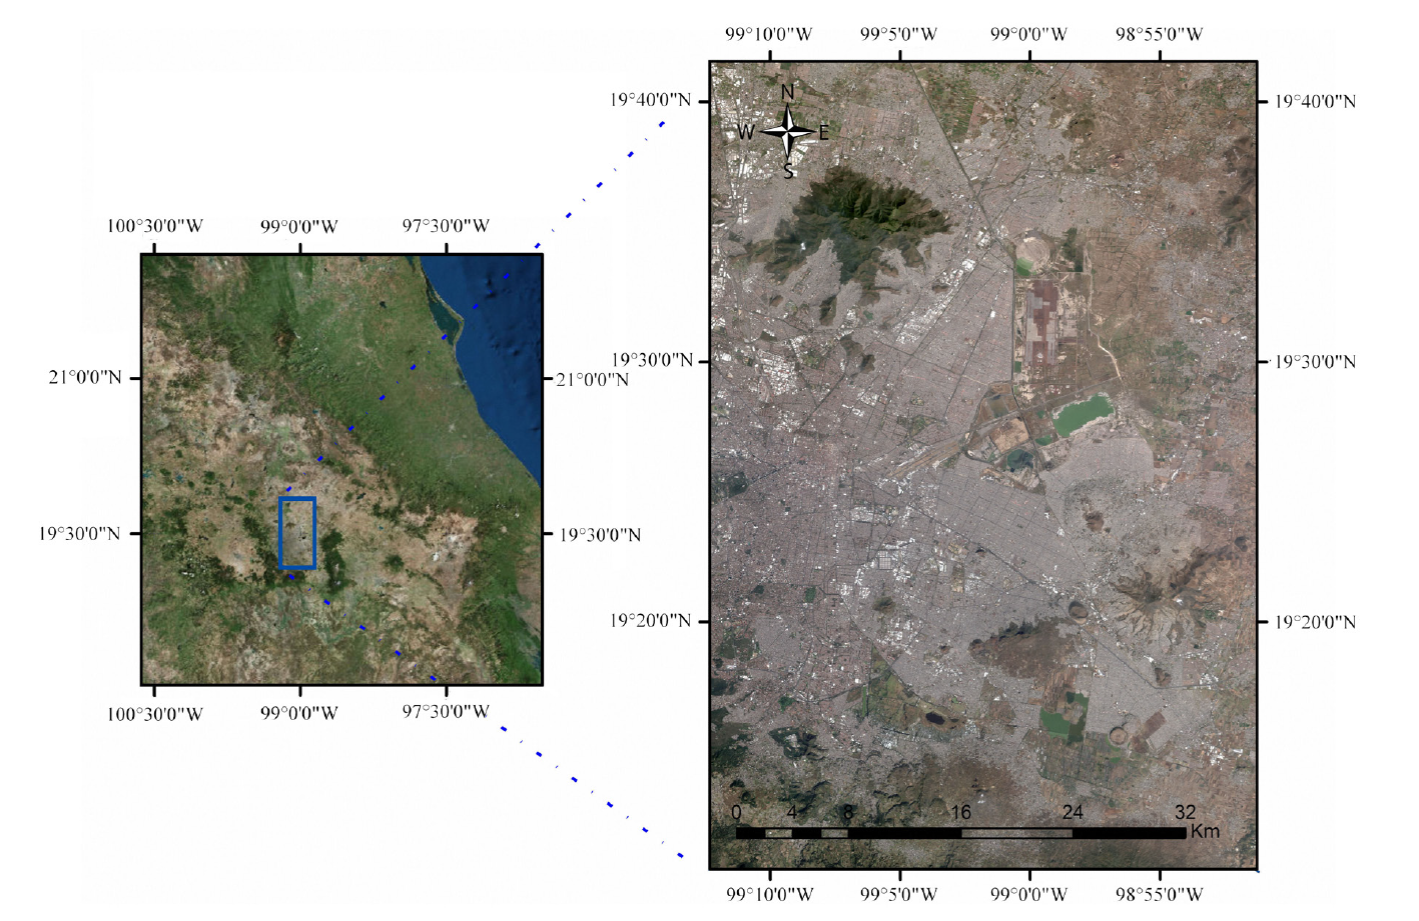
Figure 1 Area of study located in the center of the Mexican Republic. Regional image is shown on the left. The area within the blue box is shown in greater detail in the image on the right. The new airport lies at the center of this image. (Image from GoogleEarth).
The study area comprises the Valley of Mexico (Figure 1). The Valley of Mexico is located between 19° 40' 0" N - 19° 10' 0" N and 99° 05' 0" - 98° 50' 0" W. The Valley of Mexico is a basin with an average elevation of 2,240 meters above sea level and a surface area of 1,958,201 km2. The Valley is formed by intermountain valleys, plateaus, and canyons as well as plains and was once occupied by the Texcoco, Xochimilco, and Chalco Lakes. The metropolitan urban area of Mexico City is located within the Valley. The area of urban buildup is 16,150 km2, located at the center of Figure 1, and the new airport is visible to the center of the area of study.
2.2.1 Basic principles
An interferometric pair is a set of two radar images of the same scene acquired from two different locations (Figure 2). The distance from location 1 to the ground is R1 and from location 2 to the ground is R2. The distance from any location to the ground is called the range. The distance between locations 1 and 2 is B and is called the base line. The height of the radar satellite orbit is h. The elevation of the ground is Az with respect to an arbitrary datum level. The radar images acquired from locations 1 and 2 are complex quantities written as
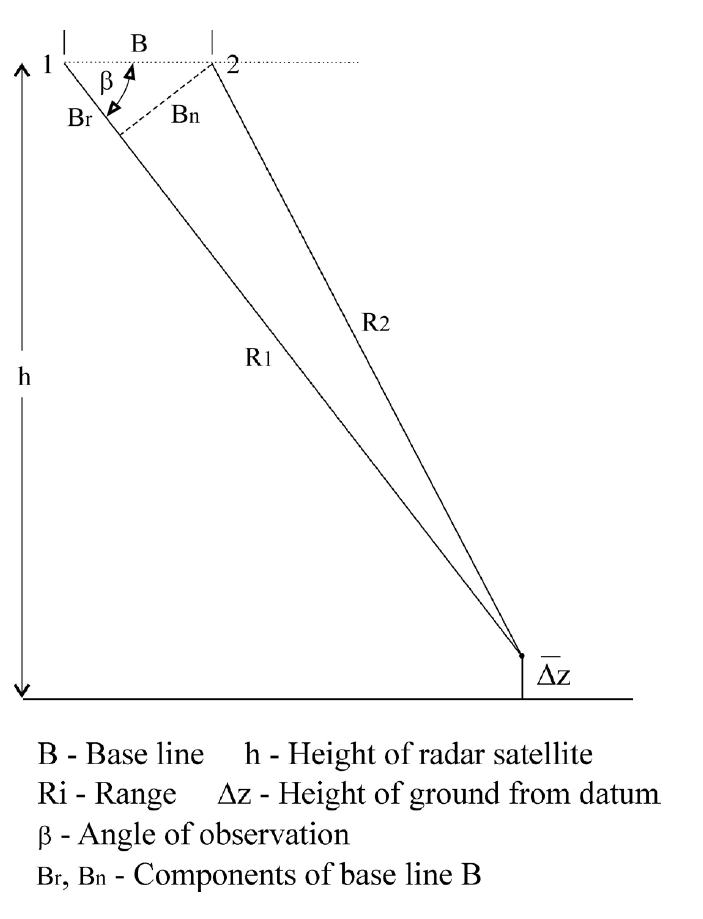
where Ai is the amplitude and φ ί is the phase of the back-scattered radar signal from the ground. The elevation change Az of the ground is written as
where β is the angle of observation and
And
With ΔR = | R1 - R2 | and the wavelength of the radar signal represented by λ.
The phase difference Δφ from the interferometric images f1 and f2 is proportional to changes in the topography Δz of the scene (equation 2). None the less, the phase difference is modified by several factors pertaining to the scene and the atmosphere. The contributions to the phase difference Αφ, besides the ground height, are written as
where:
Αφflat - Contribution from Earth curvature.
Αφelevation - Contribution from scene topography
Αφdisplacement.- Contribution from surface deformation of the scene.
Αφatmosphere - Contribution from changes in atmospheric features such as humidity, temperature, and pressure.
Αφnoise - Contribution from temporal changes in scatterers: different look angle and different volume scattering.
The Αφflat and Αφelevation contributions can be determined. The Αφatmosphere contribution cannot be determined unless the atmospheric conditions are known at the time of the acquisition of images f1 and f2. The Δφnoise contribution cannot be determined unless the conditions of the scene are known. It is assumed that atmospheric conditions and temporal changes in the scatterers do not vary significantly between the acquisition times of images f1 and f2. Once the above assumptions are met, the Δφdisplacement contribution can be obtained from equation (5). The changes in the topography of the scene generated by the earthquakes are measured by the Δφdisplacement contribution. The final product derived from equation (2) is referred to as the displacement map.
The atmospheric effects in the interferometric procedure have been discussed in detail by Al Jassar and Rao (Jassar and Rao, 2011). The displacement maps shown by these authors indicate a number of fringes associated with the phase shift due to atmospheric interference. To apply a proper atmospheric correction, pressure, humidity, and temperature values are required for the time of acquisition of the radar images. Such values are not available for the area of Mexico City. From a visual inspection of the displacement maps generated in this research, no observable fringes associated with atmospheric effects are present. Therefore, no atmospheric correction was applied.
2.2.2 Interferometric analysis
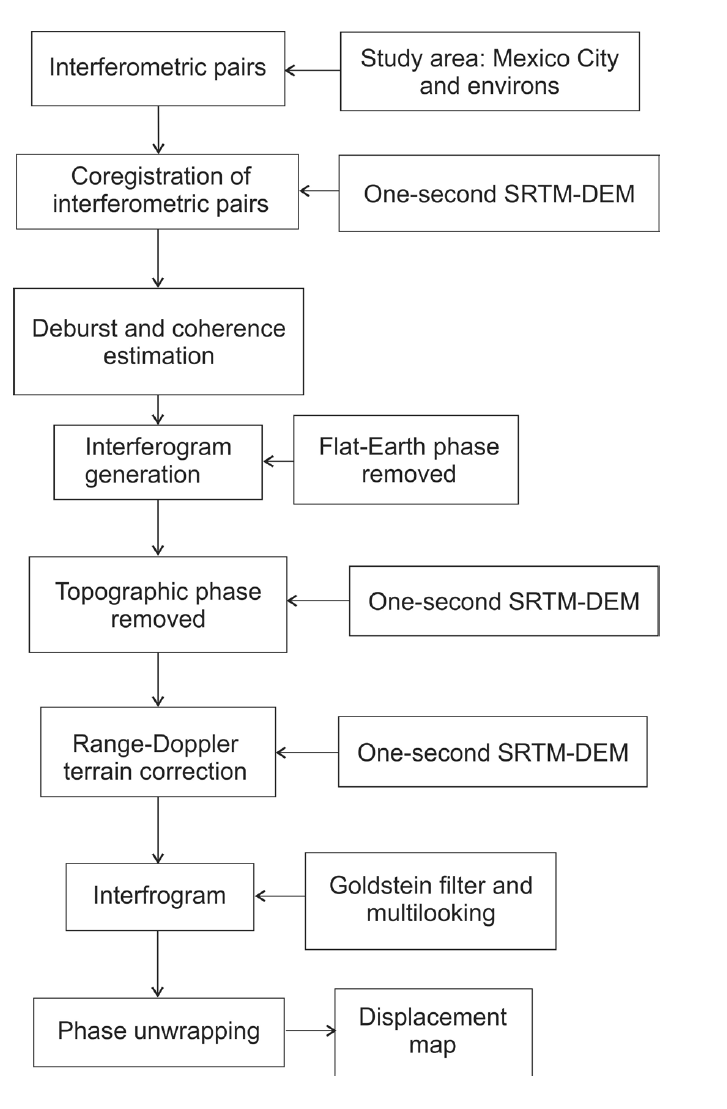
The Sentinel-1 radar images were analyzed using the SNAP 6.0 and Snaphu packages. The radar images were imported into SNAP, and the deburst procedure was applied. The Sentinel-1 IW SLC products consist of three sub-swaths: IW1, IW2, and IW3. Thus, the next step was to select the sub-swath that covers the study area. To derive an extraction of the phase shift Αφ, a precise coregistration of the interferometric pair is required. In this step, SNAP uses a precise orbit file and performs a DEM-assisted back-geocoding registration. A one-second (Shuttle Radar Topography Mission) SRTM-DEM was selected to perform the back-geocoding registration.
The quantity
is called the interferogram, and | f1 f2 | = A is the magnitude of the interferogram. The phase difference is given by equation (5). In the interferometric procedure, the Flat-Earth Phase is removed; this eliminates the contribution Αφflat from Δφ (equation 5). Figure 3 depicts a block diagram of the interferometric analysis.
The coherence is defined as
Where the complex multiplication between brackets is written as
Where p i and p j are the pixel values of the radar images f1 and f2 and * signifies the complex conjugate.
The coherence is a measure of the similarity between the f1 and f2 images. The values of coherence in the range [0.5 - 1.0] are acceptable whereas the range [0.3 - 0.5] indicates poor coherence and may lead to unreliable interferometric results. Coherence may be lost by changes that the scene experiences during the time period between the acquisition of images f1 and f2. Coherence may also be lost by modifications in vegetation and by errors in the orbit file.
The next step was to remove the topographic phase associated with the topography of the scene. This eliminates the Δφelevation contribution to Δφ (Equation 3). The interferogram may be contaminated by noise due to temporal decorrelation, geometric decorrelation from orbit file errors, and volume scattering from changes in vegetation. Thus, the Goldstein filter was applied to the interferogram (Goldstein and Werner, 1998) to reduce the Δjnoise contribution (Figure 3).
To obtain the absolute value of the displacement, an unwrapping of the phase must be applied. Before the unwrapping task, a multilooking procedure was applied to generate an interferogram with a square pixel of 20 x 20 m2. Then the interferogram was exported to Snaphu where the unwrapping of the phase was carried out. The results were in turn imported to SNAP and a phase was applied to the displacement. Finally, a Range-Doppler terrain correction was applied to derive the displacement map (Figure 3).
Geometric distorsion in the radar image is introduced by two aspects of radar operation: the side-looking operation of the radar sensor and the topographic variations of the secene under obvervation. Such distortion increases as the distance from the radar sensor to the scene surface increases from the local Nadir. The Range-Doppler terrain correction introduces an orthorectification using a DEM to derive a precise geocoding of the radar image. The final products are a corrected interferogram and a displacement image map geocoded to a pixel size of 20 ' 20 m2.
2.2.3 Synergism of radar and optical images
The Sentinel-1 IW GRD dual polarization image of November 16, 2017 was considered for the synergism scheme (Table 2). This image carries a two-band amplitude with VV and VH polarizations. Both bands of the GRD radar image were taken into account. The speckle of the image bands was reduced using the enhanced Lee filter (Lee and et al., 1991).
An orthorectification procedure was applied to the SPOT 6/7 images and a mosaic was prepared to cover the study area. Even though the SPOT 6/7 images differ by one week in time, no significant variations of the scene are observed. Therefore, the mosaic shows no border in the union of the images. The four bands of the mosaic with a pixel size of 5 x 5 m2 were considered. Figure 4 shows a block diagram of the synergism procedure.
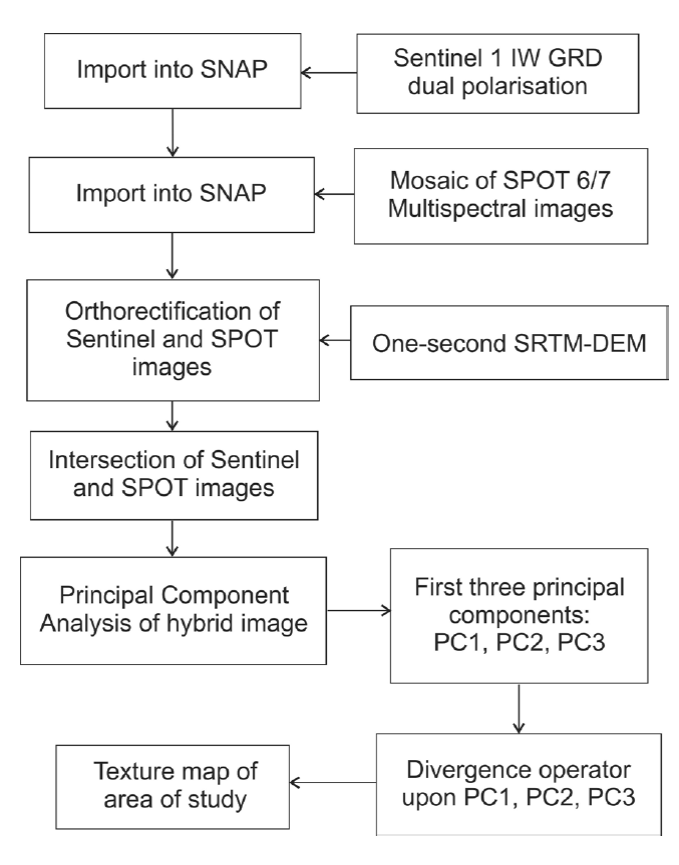
The bands of the radar image and the optical mosaic image were resampled to a pixel size of 20 x 20 m2. Both images were coregistered using a one second-arc SRTM-DEM. An intersection of the images that cover the study area was obtained. A hybrid image of the radar bands and optical bands was formed by the two bands of the radar image and the four bands of the optical image. Principal component analysis (PCA) was applied to the hybrid image, and only the first three components were retained.
Principal component analysis is defined as
Where fj are the bands of the hybrid image, (k,l) are the coordinates of the pixels of such image and Λ satisfy the eigenvalue and eigenvector equation
Where λ represents the eigenvalues of the covarianch funj)ion K f and ׳Л(/,к) are the components of the meigenvectors of the covariance function.
A divergence operator was applied to the three-dimensional vector field formed by the first three components PC1, PC2, PC3 of the hybrid image. The divergence operator of the n-dimensional vector field U is defined as (Lira and Rodriguez, 2006).
Where xi is the ith coordinate of a Cartesian coordinate system of an Euclidian space, and uxi is the component of the vector field U = u(x1,x2, . . . xn) along the direction defined by xi. The derivatives involved in equation (11) cannot be obtained in analytic form for a digital image; hence, a finite difference approximation was introduced (Lira and Rodriguez, 2006). In our research xi = PCi, i = 1,2,3.,
The divergence operator produced the texture map taking into account the spatial and radiometric contributions from the radar and optical images. Using control points, the texture map was coregistered to the interferogram and the displacement map of November 2017. An RGB (Red, Blue, Green) false color composite image with the texture map, the interferogram, and the displacement map of September was prepared.
3. Results and discussion
Four interferometric pairs and one synergism were processed (Tables 1, 2). The final products of this research were the interferograms and the displacement maps derived from the interferometric pairs. A texture map was obtained from the synergism of radar and optical images. The texture map was prepared by means of the divergence operator. These products were intended to study the morphologic changes in the area of Mexico City generated by the two earthquakes of September 2017.
All four interferometric pairs were of descending mode (Table 1). From visual inspection, an assessment of the interferometry procedure shows that better results were obtained using descending mode rather than ascending mode pairs. In addition, results were better using the VV polarization than VH polarization (Table 1).
Figures 5 - 8 show the interferograms for the radar images considered in this research. Figure 9 shows a plot of coherence values of a transect of the water body Nabor-Carrillo. Figures 10 - 13 show the corresponding displacement maps. Figure 14 shows a mosaic of an enlarged section of the interferograms of August, September, October and November. Figure 15 shows a mosaic of an enlarged section of the displacement maps of August, September, October and November. Figure 16 shows the texture map. Figure 17 shows an RGB false color composite of the interferogram, the texture and the displacement of November 2017. Figure 18 shows an RGB false color composite of the displacement map, the location of damage produced by the earthquake, and the DEM of September 2017. Figure 19 shows the accumulation of displacement from August to November, 2017. In the following sections, a detailed discussion of each type of product is provided.

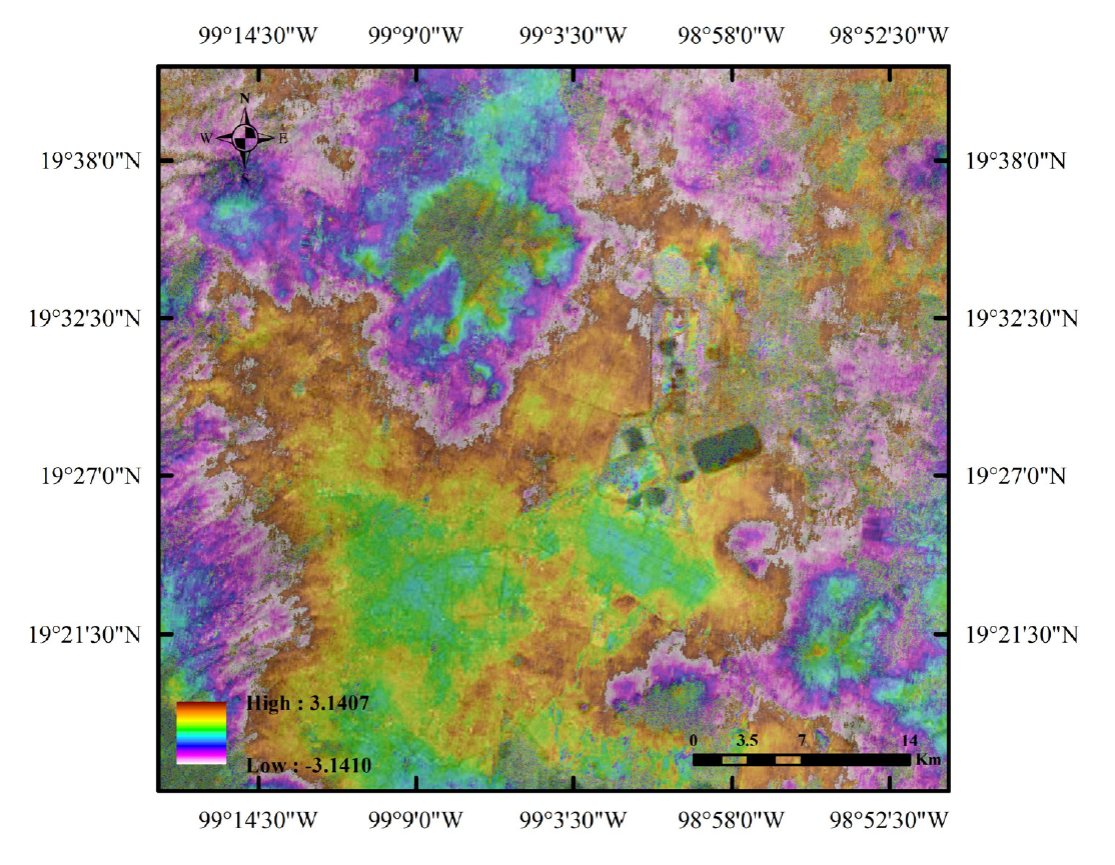
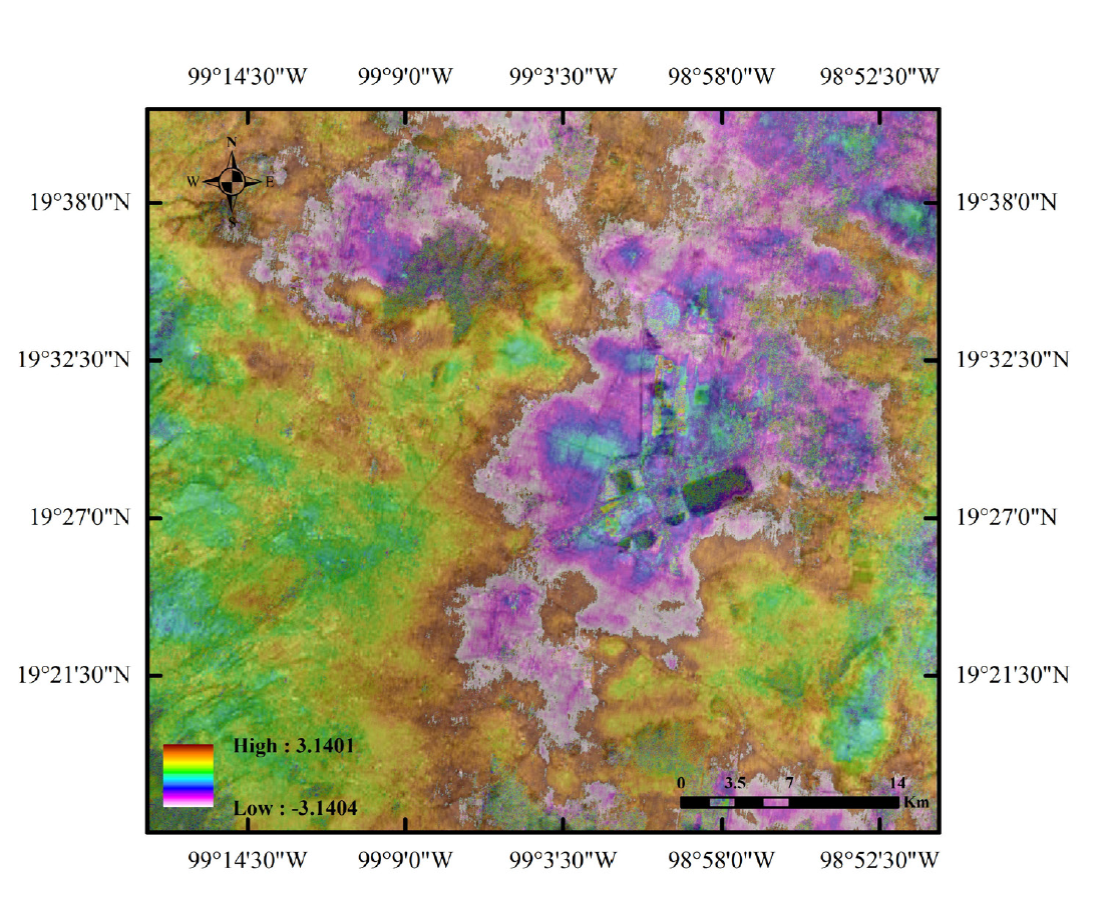

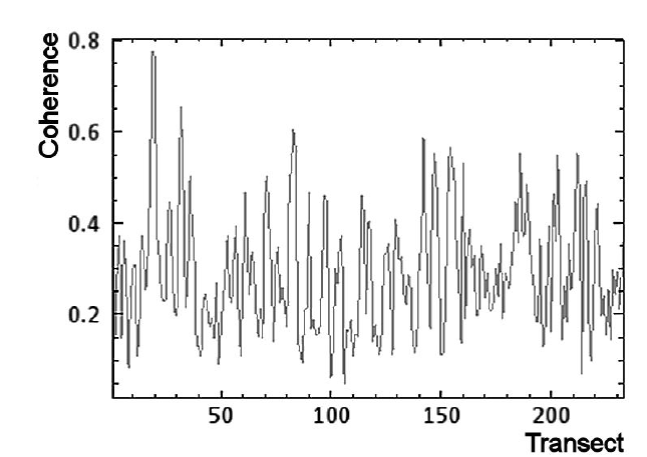
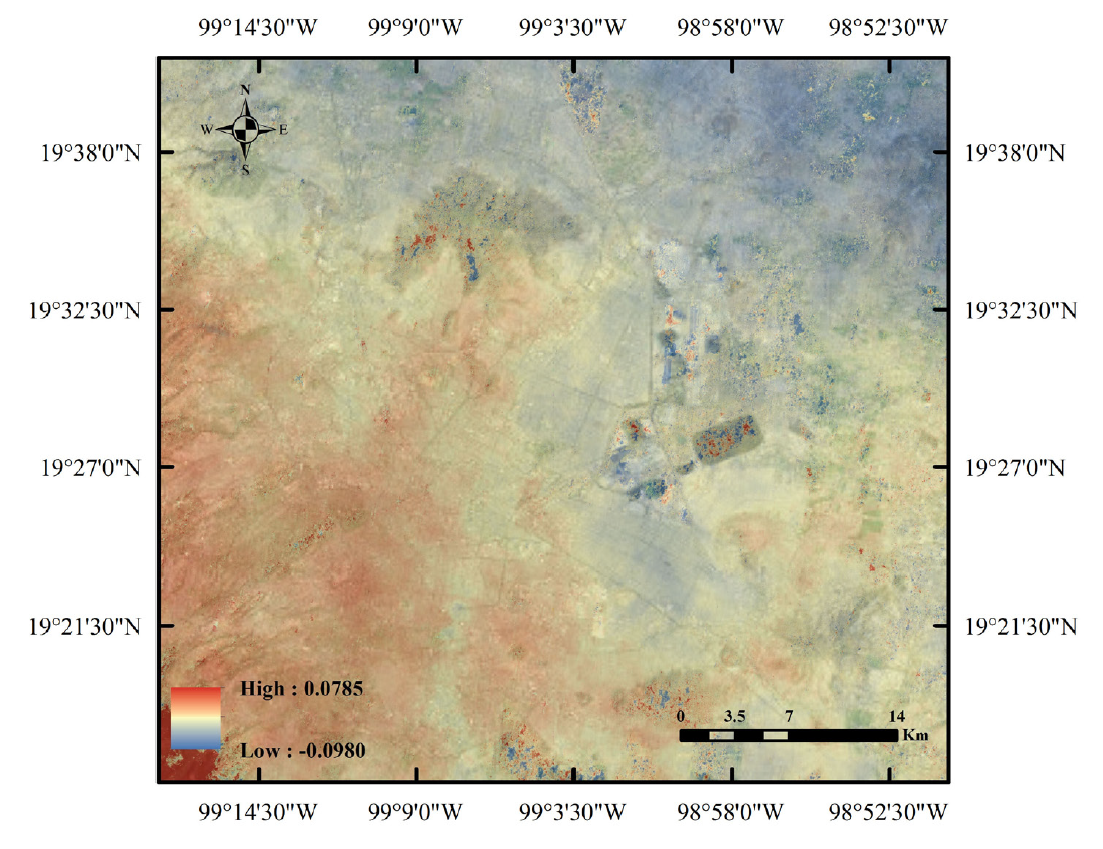
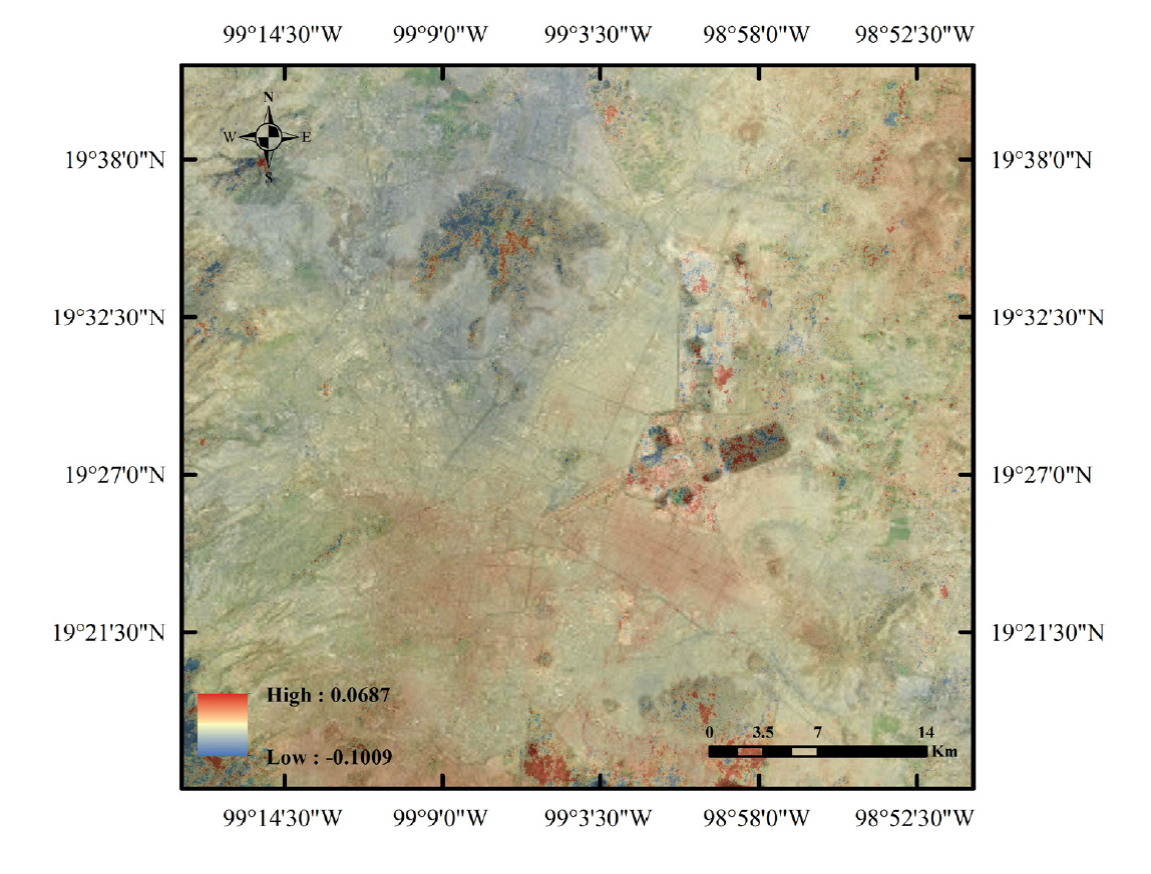
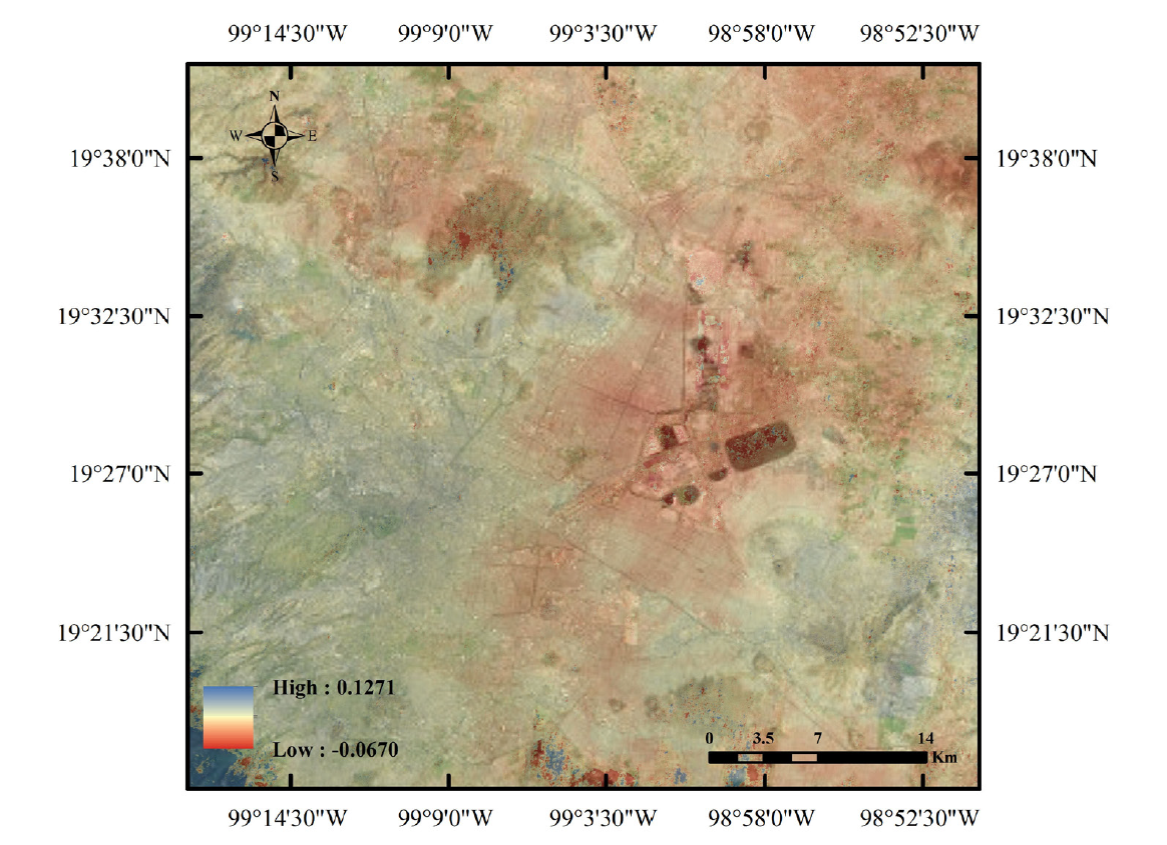
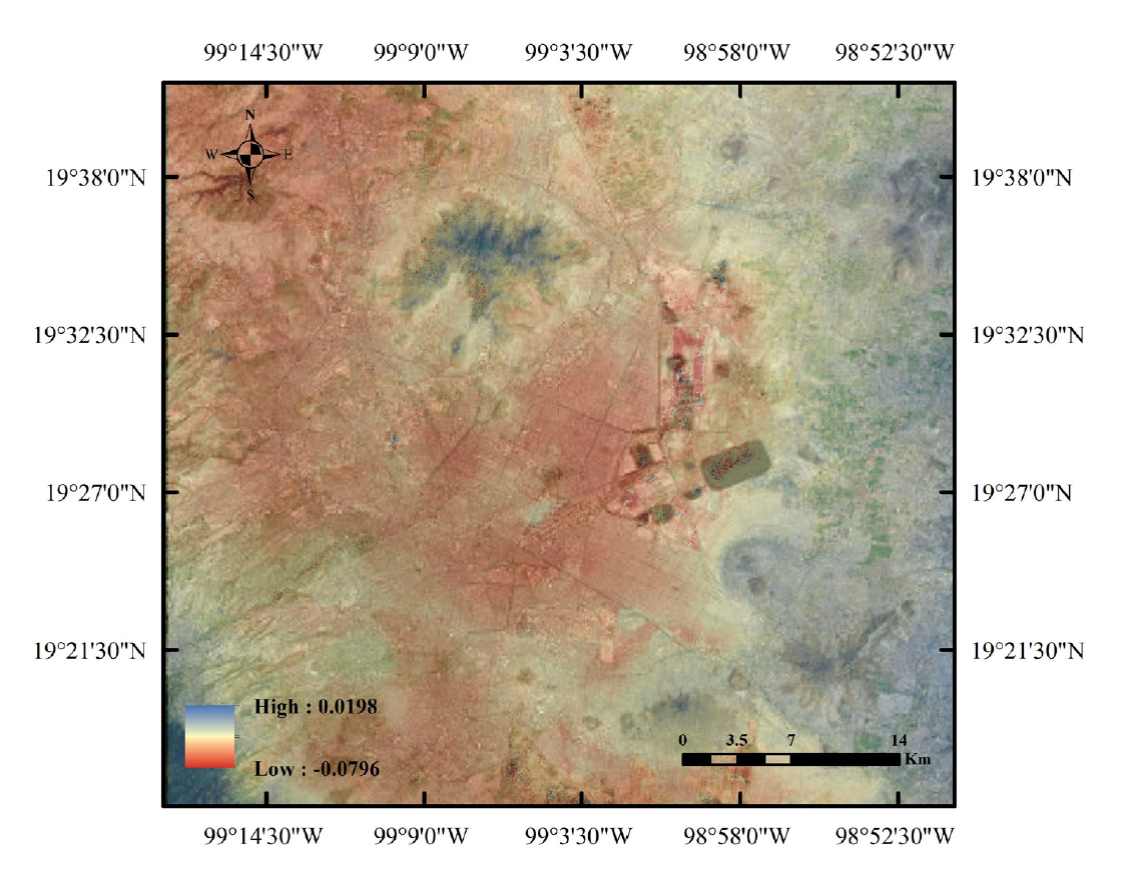
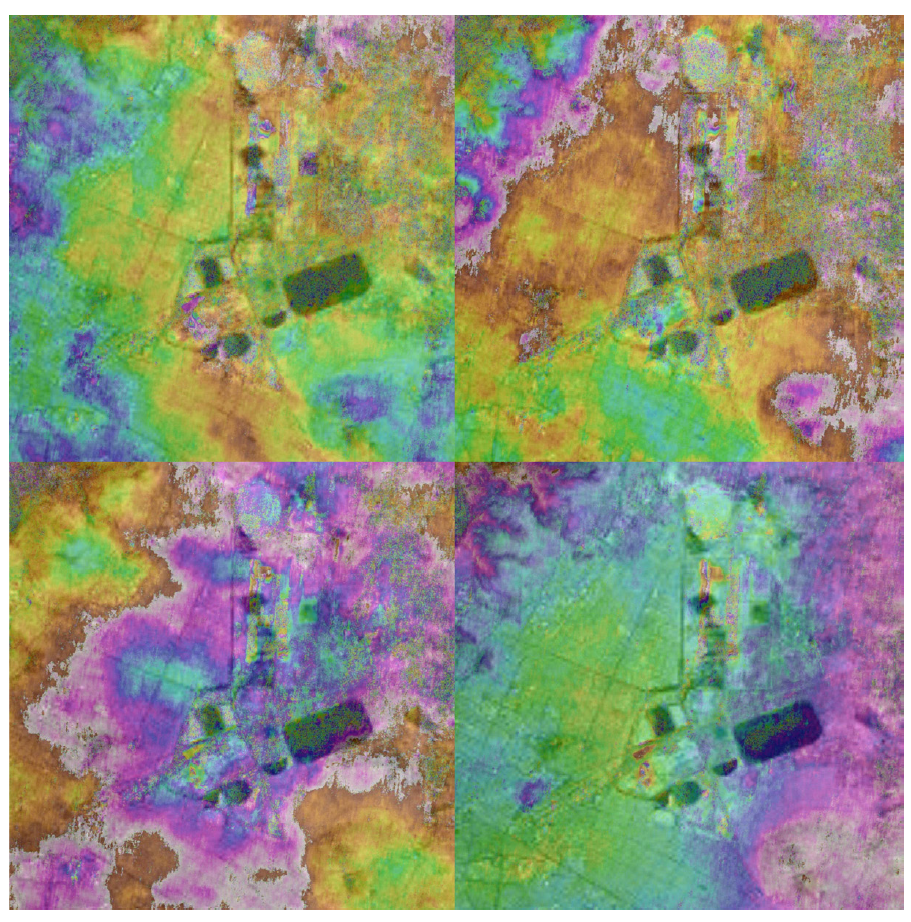
Figure 14 Mosaic of enlarged section of the interferogram of August, September, October and November. The new airport lies at the center of the image.
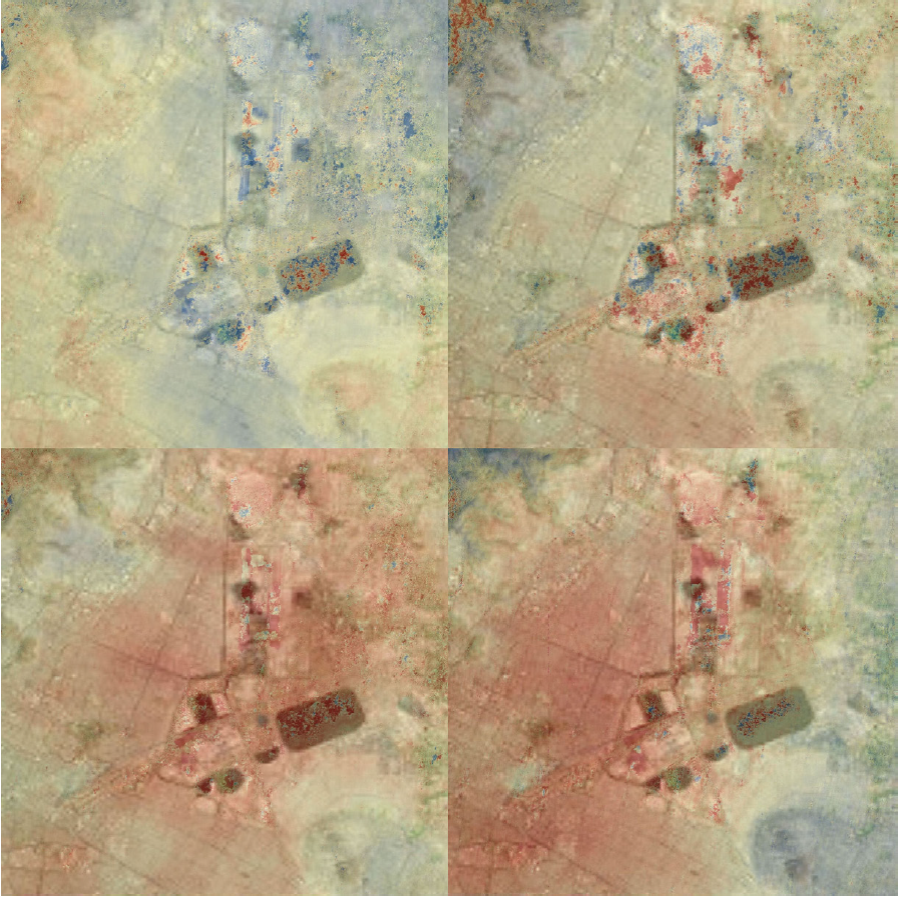
Figure 15 Mosaic of enlarged section of the displacement map of August, September, October and November. The new airport lies at the center of the image.

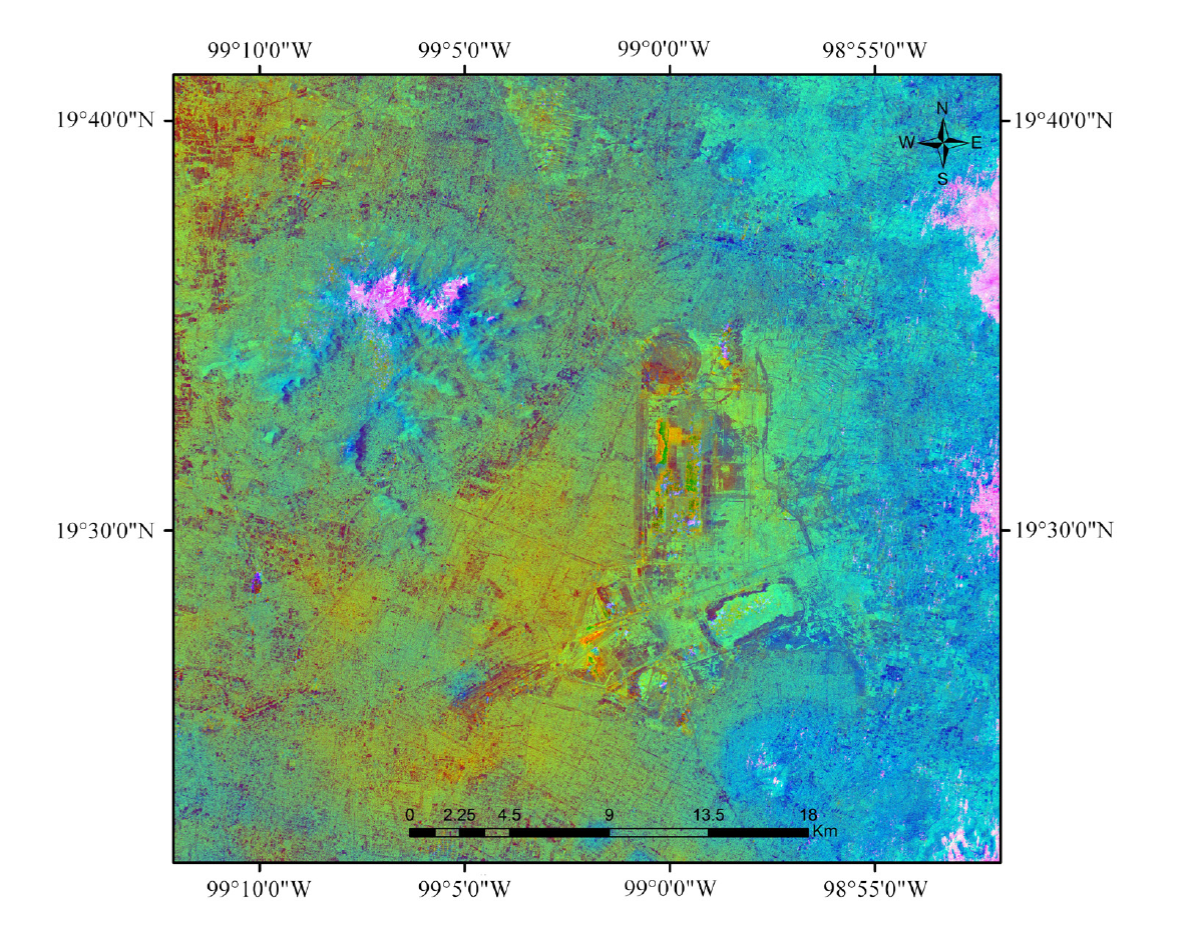
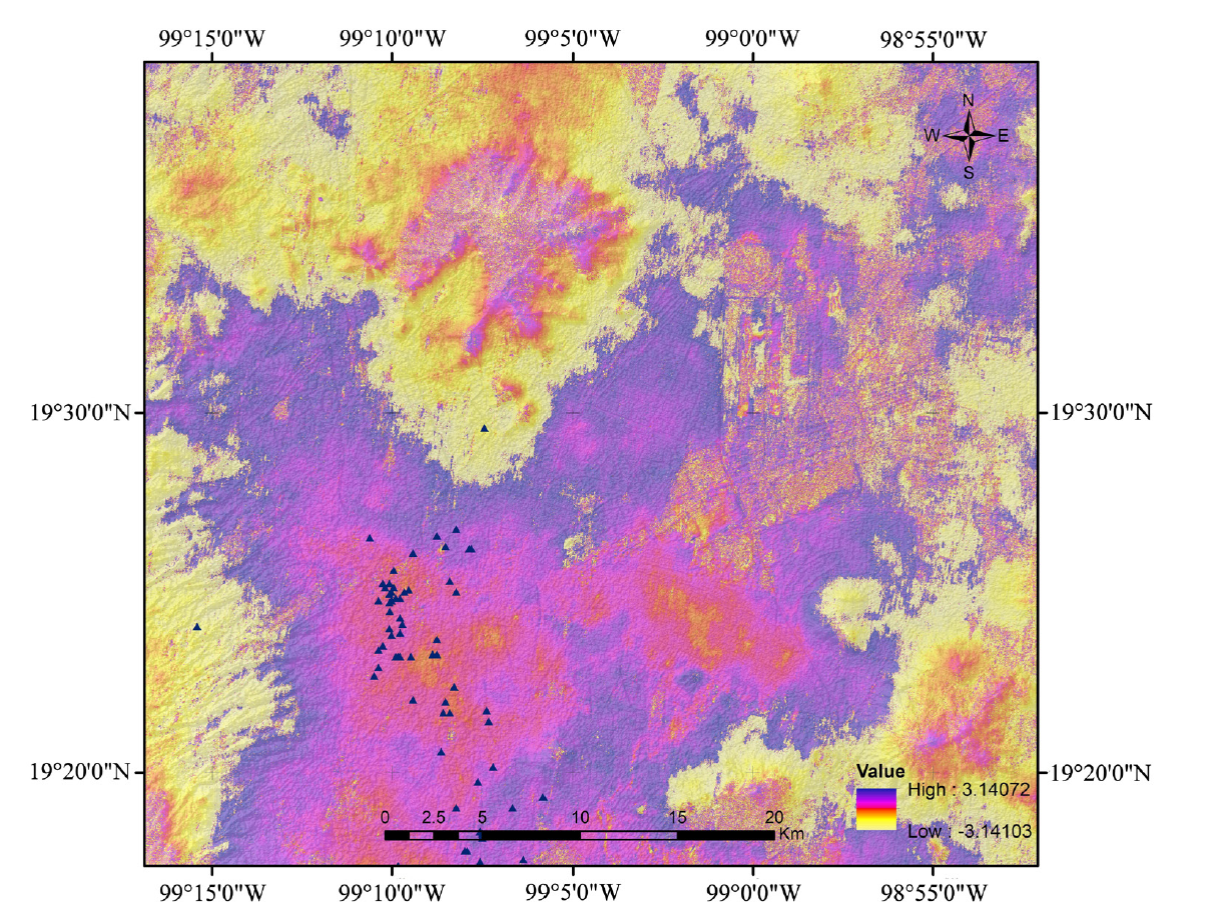
Figure 18 RGB = [Displacement, Damage, DEM] for September 2017. Black triangles indicate the accumulated damages due to the earthquake of September, 2017.
3.1. Interferometric analysis
The interferograms of August (Figure 5), September (Figure 6), October (Figure 7), and November (Figure 8) show a complex pattern related to changes in the scene. Due to the rainy season, the vegetation located in the northeast experienced visible modifications associated with the growth and disposition of the foliage (Brancato and Hajnesk, 2018). The intensive construction works at the new airport, in the landing strips and terminal sites are represented by small spots and a complex pattern of changes in the interferogram.
The interferograms of August, October, and November appear with varying fringes due to changes in the disposition of vegetation and minor displacements of the ground. In contrast, the interferogram of September depicts the modifications that occurred in the urban area located in the center. The central fringe of this interferogram coincides with the urban area modified by the earthquake. The scale located at the lower left indicates the range of the interferogram fringes from -π to π.
No atmospheric nor topographic artifacts are visible in any interferogram. However, a set of faint parallel strips, in the direction of the satellite orbit can be appreciated. Such strips are a remnant of the deburst procedure (Figure 3).
An artificial water body of rectangular form is located southwest to the new airport. This body is named Nabor-Carrillo. A clear water body produces specular scattering of incoming radiation and hence the backscattering signal to the radar antenna is very weak. In the interferometric analysis, this generates a low coherence. However, the Nabor-Carrillo body is contaminated by sediments and organic matter clearly visible in the Spot images (Figure 1). Such sediments produce a backscattering signal of medium strength. The consequence of this, is a medium level of coherence values (Figure 9) which generates a pattern in the interferogram. Since the sediments evolve in time, a modification of the interferogram pattern is visible in figures 5 - 8.
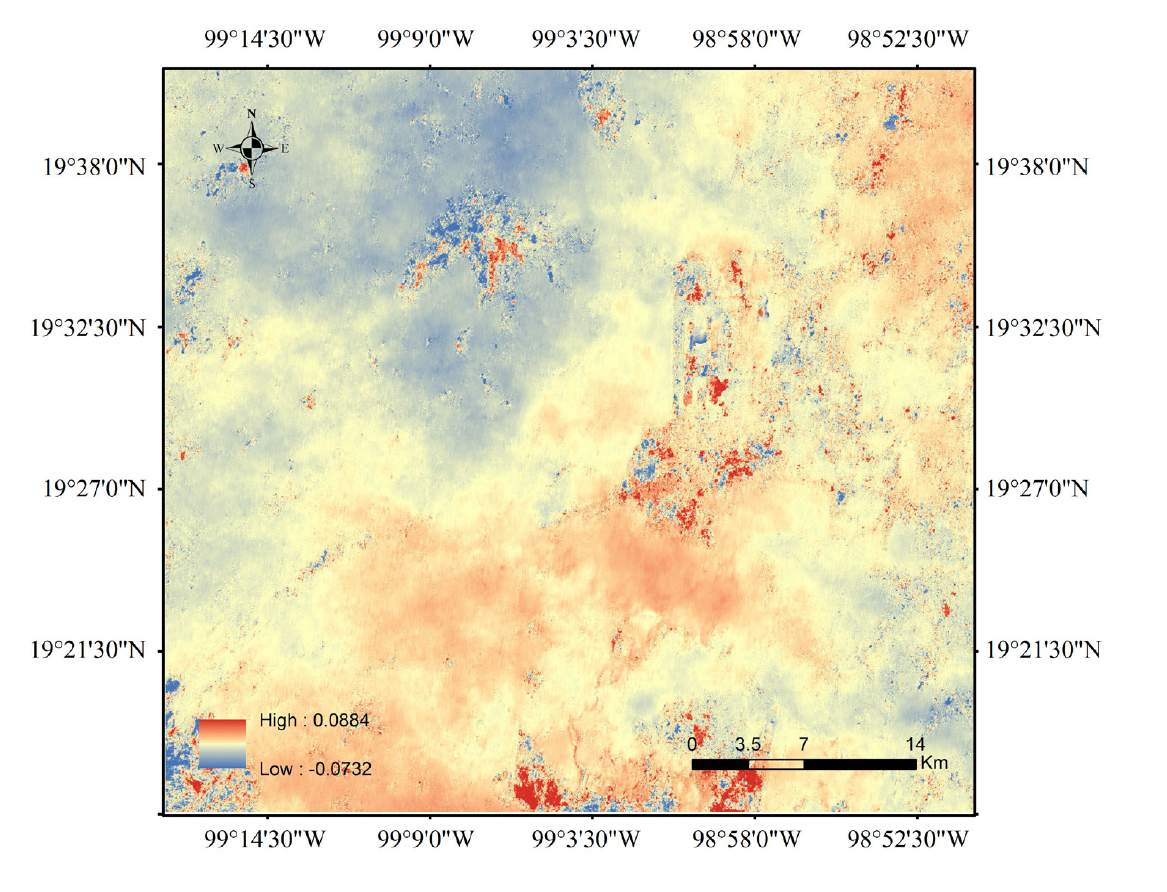
3.2. Displacement maps
The displacement maps of August (Figure 10), September (Figure 11), October (Figure 12), and November (Figure 13) show slight elevation changes of the scene that amount to a few centimeters. The scale at the lower left indicates the color code associated with modifications of elevation, the precision of which is on the order of a few millimeters. Positive elevation changes are depicted in blue - gray tones, whereas negative changes are depicted in yellow-red. A complex pattern of elevation changes is visible in the area of the new airport due to the construction work on the landing strips, the control tower, and the terminal. The dates for the displacement maps include the second half of the rainy season. The elevation modifications in zones outside the urban area are generated by vegetation growth and soil erosion due to the rain. In the September displacement map, the elevation changes are mostly noticeable in the northern part and the urban area. The elevation modifications in the urban area are related to the earthquakes of September 2017.
3.3. Texture map
The texture map shows the roughness of the surface (Figure 16) using a gray scale to depict the variations in roughness. Smooth roughness is shown in dark gray while rougher textures appear in increasingly brighter gray tones. The false color composite RGB = [Interferogram, Texture, Displacement] of November 2017 shows a pattern of interesting features (Figure 17). The bright area to the northwest is the texture associated with dense vegetation at the top of a mountain. The urban area is observed in yellow-orange where the greatest displacement occurred due to the earthquake of September. At the center, a complex pattern of changes in various tones of blue to orange and dark brown is associated with the intense work at the new airport. The shades of blue to the east are related to scarce vegetation.
3.4. Damage pattern
A map of the damage generated by the earthquakes of September 2017 was considered along with the interferogram and DEM (CENAPRED, 2018). The false color composite RGB = [Interferogram, Damage, DEM] of September 2017 shows a correlation between the spatial pattern of the interferogram, the location of damage, and the elevation model in the urban area (Figure 18). The buildings damaged by the September earthquake are identified as dark triangles. The location of damage is mostly concentrated in the areas of greatest displacement identified by the interferogram. The DEM provides the context of the elevations in the area of study. The urban buildup is in flat terrain surrounded by moderate changes in terrain slope. A mountain is located in the north where the changes are related to modifications in vegetation. Figure 19 shows the accumulation of displacement from August to November, 2017.
4. Conclusions
A project was developed to study and quantify the morphologic changes that occurred in the area of Mexico City over the time period spanning the months of August, September, October, and November 2017. The study was conducted employing interferometric techniques using radar satellite images of Sentinel-1. Interferometric and displacement maps were derived for the mentioned months. Two optical images from the SPOT satellite were considered to undertake a synergism procedure that considered optical and radar images. As a result of the synergism procedure, a texture map was derived. The RGB false color composite of the texture map, the interferogram, and the displacement map shows interesting morphologic features of the study area, and the interferometric and displacement maps show a complex pattern of morphologic changes in the area of study. In particular, the maps for September depict the modifications generated by the earthquakes that occurred in this month. The displacement maps are very precise showing millimeter-scale changes in the area of study. The intense construction works at the new airport introduce particular modifications that can be appreciated in the all of the maps.

