


 nueva página del texto (beta)
 Inglés (pdf)
 Artículo en XML
 Referencias del artículo
 Enviar artículo por email
 Citado por SciELO
  Similares en
SciELO
Similares en
SciELO 
 Permalink
Introduction
T2DM is a metabolic disorder defined by elevated blood glucose levels and decreased function of the β-cells in the pancreas. This condition arises from a combination of genetic and environmental factors, insulin resistance, and inadequate insulin secretion [1-4].
Oxidative stress refers to an excessive accumulation of reactive oxygen species (ROS) in the body, which results in an imbalance between oxidation and protection. This leads to tissue, cell, and biological molecule damage, such as to nucleic acids and proteins [5,6]. ROS, including superoxide anions, oxygen radicals, hydrogen peroxide, and lipid peroxide, are powerful oxidants generated in eukaryotic cells through normal metabolism. The lipid peroxidation of biofilm-bound unsaturated fatty acids results in the formation of malonic dialdehyde (MDA), conjugated diene, and 4-hydroxynonenal [7]. Among these, MDA can combine and cross-link with proteins and enzymes on the cell membrane, altering its fluidity and permeability and impacting physiological and biochemical reactions. Therefore, MDA serves as an indicator of lipid peroxidation and oxidative cell damage [8]. The presence of elevated free radicals can worsen diabetes [9,10]. The body's defense against oxidative damage is aided by the enzyme superoxide dismutase (SOD), which can neutralize superoxide anions and protect cells [11-14]. The SOD activity level reflects the body's capacity to remove oxygen-free radicals, while the MDA content can be used to gauge the extent of free radical attack on cells.
Oxidative stress plays a central role in the development of insulin resistance (IR), which is the underlying cause of T2DM [15-20]. Therefore, addressing IR is crucial in treating T2DM. The treatment of T2DM can be approached in two ways. The first is to limit the source of glucose in the blood by reducing sugar intake, decreasing insulin breakdown into muscle and liver glycogen, and converting non-sugar substances into glucose. The second is to promote the conversion of glucose in the blood into non-sugar substances and glycogen, thereby lowering blood glucose levels. For centuries, plant-based medicines have been used to treat diabetes [21], especially in developing countries.
Picroside I, an iridoid glycoside extracted from the picrorhiza rhizome, has been shown to have cholagogue effects, improve liver function, protect against liver injury caused by free radical release, enhance antioxidant enzyme activity, and support liver health [22]. However, its potential for treating T2DM is unknown. This study aimed to evaluate the in vitro antioxidant properties of picroside I and to examine its impact on insulin resistance in human hepatocellular carcinoma (HepG2) cells, in order to explore its potential as an anti- T2DM drug based on its effect on oxidative stress.
Experimental
Material and methods
Materials
Picroside I and vitamin C were supplied by Chengdu Desite Biotechnology Incorporation. α-Amylase, α-glucosidase, acarbose, recombinant human insulin, rosiglitazone, glucose oxidase (GOD) activity assay kit, SOD assay kits, and MDA assay kits were provided by Beijing Solarbio Technology Co., Ltd. All other reagents were from Chengdu Cologne Chemical Co., Ltd.
2, 2-Diphenyl-1-picrylhydrazyl radical (DPPH•) scavenging activity assay
DPPH• scavenging activity was used to evaluate the scavenging activity of the compounds against free radicals and measured according to a previously described approach [23], with some modifications. In the experimental group, 100 μL of picroside I (10, 20, 30, 40, 50 μg/mL) and 100 μL of DPPH• (0.2 M) were added to the 96-well plates. In the negative control group, 100 μL of ethanol absolute was substituted for picroside I. In the blank control group, 100 μL of ethanol absolute was used instead of DPPH• (0.2 M). After standing in the dark for 30 min at room temperature (RT), the absorbance of all wells was determined at 517 nm.
Vitamin C (10, 20, 30, 40, 50 μg/mL) was applied as the positive control, and all groups were assayed in triplicate to evaluate the scavenging activity.
where AS, AN, and A0 represent the absorbance of the experimental group, the negative control group, and the blank control group, respectively. The physical quantities represented by the same parameters in the following formulas are consistent with formula (1).
2,2''-Azino-bis-(3-ethylbenzothiazoline-6-sulfonate) radical (ABTS•+) scavenging activity assay
ABTS•+ scavenging activity was used to evaluate the scavenging activity of compounds against free radicals, and it was measured based on a previously described approach [24] with slight modifications. At first, 7.4 mM ABTS•+ solution was blended with 2.6 mM K2S2O4 solution at a volume ratio of 1:1 to prepare ABTS•+ stock solution. The stock solution was stored in a refrigerator and left overnight, then, diluted 20 times with ethanol absolute as ABTS•+ working solution. In the experimental group, 50 μL of picroside I (10, 20, 30, 40, 50 μg/mL) and 200 μL of ABTS•+ working solution were blended. In the negative control group, picroside I was replaced with 50 μL of ethanol absolute. In the blank control group, ABTS•+ working solution was used instead of 200 μL of ethanol absolute. After standing for 10 min in the dark at RT, the absorbance was determined at 734 nm. Vitamin C (10, 20, 30, 40, 50 μg/mL) was employed as the positive control, and all groups were assayed in triplicate.
Hydroxyl radical scavenging activity assay
Hydroxyl radical-scavenging activity was determined based on a previously described approach [25], with some modifications. 50 μL of picroside I (50, 100, 200, 300, 400, 500 μg/mL), 50 μL of FeSO4 (9 mM), and 50 μL of salicylic acid (9 mM) were added to 96-well plates. Then, 50 μL of H2O2 (0.1 %) solution was mixed with the solution and cultured for 60 min at 37 °C. In the blank group, an equivalent volume of deionized water was used instead of the H2O2 solution. An equivalent volume of ethanol absolute was substituted for picroside I in the negative control group. Vitamin C (50, 100, 200, 300, 400, 500 μg/mL) was applied as a positive control. All groups were assayed three times. The absorbance was determined at 510 nm. Hydroxyl radical scavenging activity was calculated as follows:
Reduction ability
The reducibility of compounds was accurately measured using a previously described approach [26] with some modifications. About 300 μL of a solution containing various contents of picroside I (2.5, 5, 10, 15, 20, 25 μg/mL), 300 μL of phosphate-buffered saline (PBS, 0.2 M, pH=6.6), and 300 μL of K3Fe(CN)6 (1 %) were reacted in water for 20 minutes at 50 °C. After cooling, 300 μL of trichloroacetic acid (10 %) was added to compound solutions, mixed, and centrifuged for 10 min at 3000 r/min. About 300 μL of supernatant, 300 μL of distilled water, and 75 μL of FeCl3 (0.1 %) were mixed. Then, 200 μL of reaction solutions were added to the 96-well plates and allowed to stand for 10 min. The absorbance was determined at 700 nm. In the blank control group, FeCl3 (0.1 %) was replaced with distilled water. Vitamin C (2.5, 5, 10, 15, 20, 25 μg/mL) was employed as a positive control for evaluating the total reduction capacity. Each group was assayed in triplicate.
Determination of α-glucosidase activity inhibition
The α-glucosidase activity of compounds was measured using a previously described approach [27] with some modifications. The specimens were prepared with PBS (100 mM, pH=6.8). 25 μL of Picroside I (50, 100, 200, 300, 400, 500 μg/mL) and 15 μL of α-glucosidase (0.5 U/mL) were added into 96-well plates. After incubating for 10 min at 37 °C, 30 μL of p-nitrophenol-α-D-glucopyranoside (5 mM) was added. Then, the blend was cultured for 25 min at 37 °C, and 100 μL of Na2CO3 (0.2M) termination solution was added. In the blank control group, picroside I was replaced with PBS (100 mM, pH=6.8); in the negative control group (1), the α-glucosidase solution was replaced with PBS (100 mM, pH=6.8); and in the negative control group (2), picroside I and α-glucosidase solution were replaced with PBS (100 mM, pH=6.8). Then the absorbance at 405 nm was determined with the microplate reader. Acarbose (50, 100, 200, 300, 400, 500 μg/mL) was adopted as the positive control. All groups were assayed in triplicate. The α-glucosidase suppression rate was calculated as follows:
where AS, A0, AN1, and AN2 represent the absorbance of the sample, blank control group, negative control group (1), and negative control group (2), respectively.
Determination of α-amylase activity inhibition
The α-amylase activity inhibition of compounds was measured based on a previously depicted approach [28] with some modifications. About 60 μL of α-amylase (15 U/mL), 120 μL of picroside I (50, 100, 200, 300, 400, 500 μg/mL), and 300 μL of PBS (20 mM, pH=6.8) were added to test tubes. The blend was pre- incubated for 10 min at 37 °C; thereafter, 120 μL of amylum (1 %) was added. Then, the blend was mixed and incubated for 5 min at 37 °C. The reaction was terminated with 480 μL of DNS. The test tubes were placed in a boiling water bath for 15 min, cooled to RT, added with 1860 μL of PBS (20 mM, pH=6.8), and diluted to an appropriate volume. In the blank control group, picroside I was replaced with PBS (20 mM, pH=6.8). In the negative control group (1), the α-amylase was replaced with PBS (20 mM, pH=6.8). In the negative control group (2), picroside I and α-amylase were replaced with PBS (20 mM, pH= 6.8). The absorbance was recorded at 540 nm with a microplate reader. Acarbose (50, 100, 200, 300, 400, 500 μg/mL) was employed as the positive control. All groups were assayed in triplicate. The α-glucosidase suppression rate was calculated as follows:
The parameters represented by each physical quantity in formula (6) are the same as those in formula (5).
Activity analysis in HepG2 cells
Cell culture
Incubating HepG2 cells were incubated in Dulbecco's Modified Eagle Medium (DMEM) supplemented with 10 % fetal bovine serum, penicillin (100 IU/mL), and streptomycin (100 μg/mL). Cells were placed in a 37 °C, 5 % CO2 incubator. When the cells reached 70 % - 80 % confluent at the bottom of the petri dish, the original culture medium was discarded. Thereafter, the cells were rinsed two times with PBS (pH=7.4), digested with 0.25 % trypsin, and cultured at a volume ratio of 1:2.
IR model establishment for conditional screening
MTT (3-(4,5-dimethylthiazol-2-yl)-2,5-diphenyltetrazolium bromide) was used to determine the effect of insulin action time on cell activity. The standard cultured HepG2 cells were inoculated into 96-well plates (5000 cells/well). After cell adherence (12 h), 100 μL of DMEM containing different concentrations of insulin (10-4, 10- 5, 10-6, 10-7, 10-8 M) were added in the IR model group. The blank control group was DMEM in an insulin-free medium. Each group was cultured for 12, 24, 36, 48, and 60 h, respectively. Subsequently, 10 μL of MTT (5 mg/mL) was added to all wells and incubated for 4 h. Next, the original culture medium was discarded, and then 100 μL of DMSO was added to all wells to terminate the culture. The 96-well plates were shaken at low speed for 10 min and the absorbance was determined at 490 nm with a microplate reader. To determine the optimal time of insulin action, the cell survival rate was calculated. Each group was tested with three multiple wells.
After the optimal treatment time was determined, 100 μL of DMEM containing insulin (10-4, 10-5, 10-6, 10-7, 10-8 M) and glucose (25 mM) were added to the IR model group. About 100 μL of insulin-free DMEM was added to the blank group. Serum-free DMEM culture was changed after 24 h, 20 μL of supernatant was taken, and the glucose content in the culture medium was measured with a GOD activity assay kit. Glucose consumption was computed through the formula (8). The IR model group has the lowest glucose consumption rate. Each group was tested with three replicates.
Determination of the activity of picroside I on IR-HepG2 cells
Under the established IR model, 100 μL of medium containing different concentrations of picroside I (20, 40, 80, 160, 320 μg/mL) was added and incubated in a 5 % CO2 incubator at 37 °C for 24h. MTT was used to determine the effect of each concentration on IR-HepG2 cell activity, and the optimal concentration was selected as the investigational concentration. The negative control group was IR-HepG2 cells without picroside I. The culture time of each group was consistent. The absorbance of all wells was determined at 490 nm with a microplate reader. Each group was tested with three replicates. To determine the optimal concentration of drug action, the cell viability was calculated using the formula (7).
Glucose consumption of IR-HepG2 cells
After successfully establishing the best IR model, the 100 μL best content (80 μg/mL) of picroside I was added to the experimental group and incubated for 24 h. Rosiglitazone was employed as the positive control. IR- HepG2 cells without picroside I treatment were denoted as the negative control. The blank control group was not treated with insulin and picroside I. Then, the cells were cultured for another 24 h by changing the culture media into serum-free DMEM. Lastly, the GOD activity assay kit was used to detect the glucose consumption of supernatant in each group at 500 nm using a microplate reader. Each group of experiments had three replicates.
Determination of MDA content
MDA activity was determined according to the kit’s instructions with slight modifications. The logarithmic growth cells were incubated into 6-well plates (500,000 cells/well). Under the condition in 2.3.2, the cells were collected in a centrifuge tube after co-incubation with the drug for 24 h. After centrifugation at RT, the supernatant was discarded. 200 μL extract of MDA activity assay kit was added, and the cells were broken using ultrasound a centrifuged at 15000 r/min and 4 °C for 10 min. Then, the supernatant was taken and placed on ice for testing. The determination process and reagent addition amount are shown in Table 1.
Table 1 MDA content determination and reagent addition amount
| Volume (μL) | Experimental group | Negative control group |
|---|---|---|
| Working solution for MDA | 480 | 480 |
| Distilled water | 0 | 160 |
| Sample | 160 | 0 |
| Reagent Ⅲ | 160 | 160 |
The blend was placed in boiling water for 60 minutes and transferred to an ice bath. Then, it was centrifuged with 15,000 r/min at RT for 10 min and absorbed 200 μL supernatant into a 96-well plate. The absorbance at 450, 532, and 600 nm was measured using a microplate reader, and the absorbance was measured three times in each group. MDA content in cells was calculated as follows:
where A450(S), A532(S), and A600(S) represent the absorbance of cell samples at 450, 532, and 600 nm, respectively; A450(N), A532(N), and A600(N) represent the absorbance of the negative control group; VT represents the total volume of the reaction system, 0.8 mL; VE represents the extraction volume, 0.2 mL; VS represents the volume of the sample, 0.16 mL; 50 indicates that the total number of cells is 500,000.
Determination of SOD activity
SOD activity was determined according to the kit’s instructions, with slight modifications. The experimental treatment was consistent with MDA content detection. Rosiglitazone was applied as the positive control. The sample determination process and reagent addition amount are shown in Table 2.
Table 2 SOD activity determination and each reagent addition amount.
| Reagent (μL) | Experimental group | Blank control group | Negative control (1) | Negative control (2) |
|---|---|---|---|---|
| Sample | 18 | 18 | 0 | 0 |
| Reagent Ⅰ | 45 | 45 | 45 | 45 |
| Reagent Ⅱ | 2 | 0 | 2 | 0 |
| Reagent Ⅲ | 35 | 35 | 35 | 35 |
| Distilled water | 90 | 92 | 108 | 110 |
| Reagent Ⅳ | 10 | 10 | 10 | 10 |
The absorbance of all wells was determined at 560 nm after the blend was bathed for 30 minutes at 37 °C. All wells were determined three times in parallel. SOD activity was computed as follows: Calculation of suppression rate:
SOD activity:
In formula (13), AS represents the absorbance of the cell specimen, and AB refers to the absorbance of distilled water instead of reagent Ⅱ. In formula (14), AN1 represents the absorbance of the cell sample replaced with distilled water, and AN2 represented the absorbance of the cell specimen and reagent Ⅱ replaced with distilled water. In formula (16), VT means the total volume of the reaction system, 0.2 mL; 50 indicates that the total number of cells is 500,000.
Results
Antioxidant activity in vitro
In the DPPH• scavenging activity assay (Fig. 1(A)), the half-maximum suppressive content (IC50) of picroside I was 15.32 μg/mL. In the ABTS•+ scavenging activity assay (Fig. 1(B)), the IC50 of the compound was 12.84 μg/mL. In the hydroxyl radical scavenging activity assay (Fig. 1(C)), the IC50 of picroside I was 80 μg/mL.
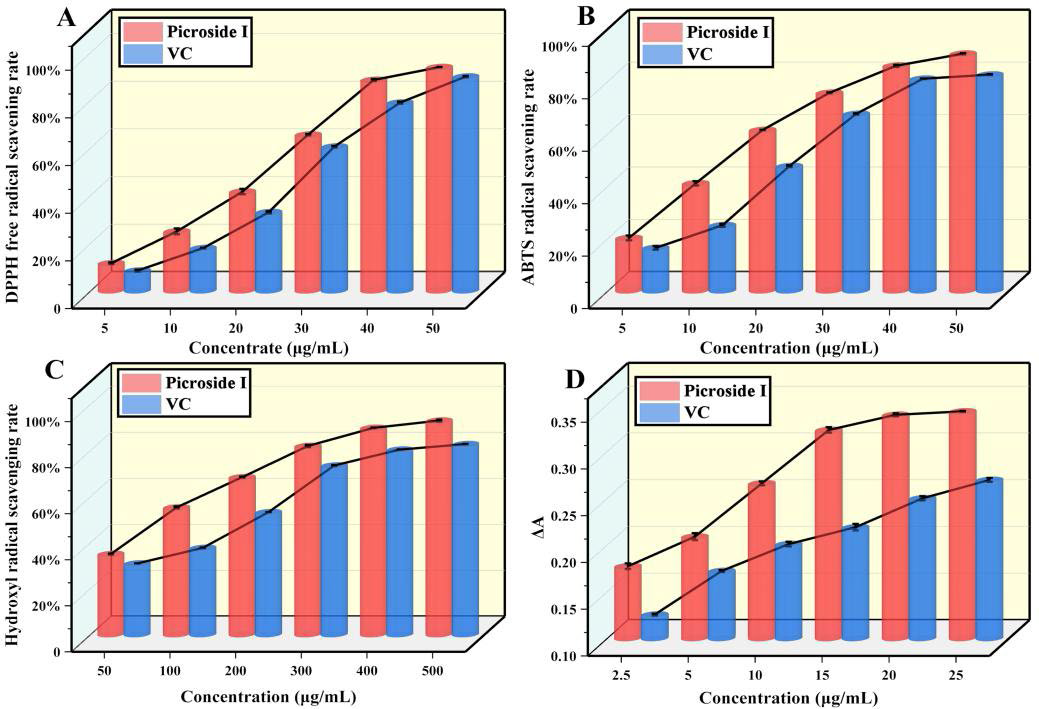
Fig 1 Determination of the antioxidant activity of picroside I in vitro. Determination of (A) DPPH• activity, (B) ABTS•+ activity, (C) hydroxyl radical activity, and (D) reducibility. (X ± S, n=6).
In addition, the four in vitro antioxidant capacity determination of DPPH• scavenging rate, ABTS•+ scavenging rate, hydroxyl radical scavenging rate, and reducibility (Fig. 1(D)), the antioxidant capacity rose as content rose, and the antioxidant activity of picroside I was more substantial than vitamin C. The results showed that picroside I had a high antioxidant ability.
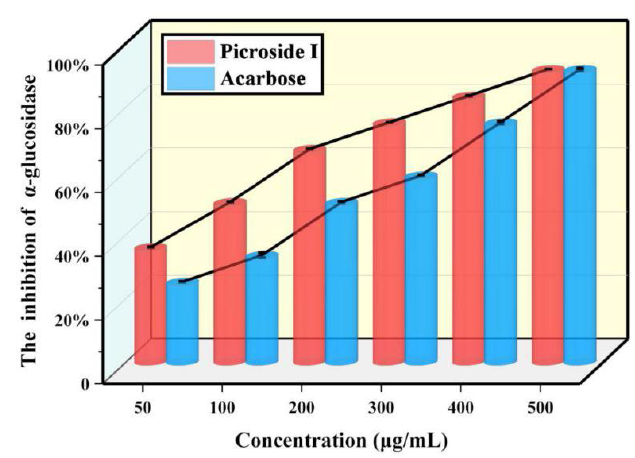
Determination of α-glucosidase activity inhibition
The α-glucosidase activity inhibition was measured in the range of 50-500 μg/mL. Compared with acarbose, α-glucosidase activity inhibition was determined by IC50. As shown in Fig. 2, if the content was 50-500 μg/mL, the maximum inhibition rate of picroside I on α-glucosidase was 91.67 %, and the inhibition effect of picroside I was stronger than that of acarbose. The IC50 of picroside I was 109.75 μg/mL. In summary, the suppression effect of picroside I on α-glucosidase was stronger than that of acarbose.
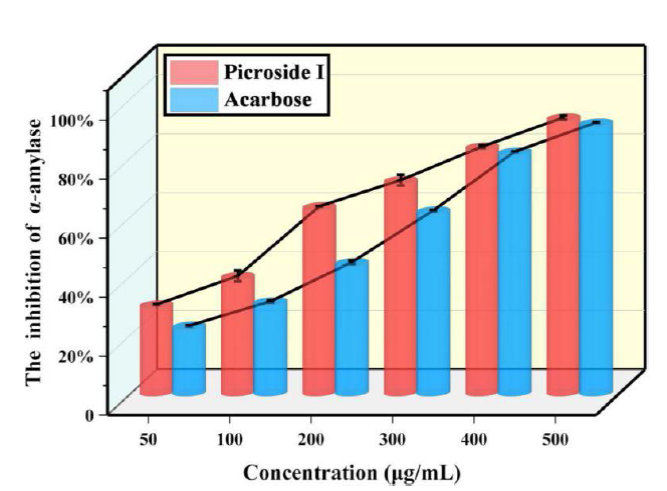
Determination of α-amylase activity inhibition
Through analysis, the IC50 of picroside I or acarbose was obtained to measure the inhibition of compounds on α-amylase activity. The maximum suppressive rate of picroside I on α-amylase was 93.22 % (Fig. 3). The suppressive effect of picroside I on α-amylase was more potent than that of acarbose at a concentration of 50-500 μg/mL. The IC50 of picroside I was 160.71 μg/mL, lower than acarbose (221.81 μg/mL). In conclusion, it can be concluded that picroside I, has a more potent inhibitory effect on α-amylase than acarbose.
Effect of insulin on HepG2 cells
As shown in Fig. 4(A), insulin inhibited HepG2 cell activity in a concentration-dependent manner except after 12 h of treatment. When treated for 36 h, the cell viability decreased significantly with increasing concentration, even below 90 % (P<0.05). When the treatment time was extended to 60 h, the inhibition of insulin activity was more significant (P<0.05). The low cell activity might be due to the lack of nutrients provided by the culture medium. Therefore, to exclude the effect of insulin action time on cell viability, 24 h was taken as thebest investigational time of insulin.
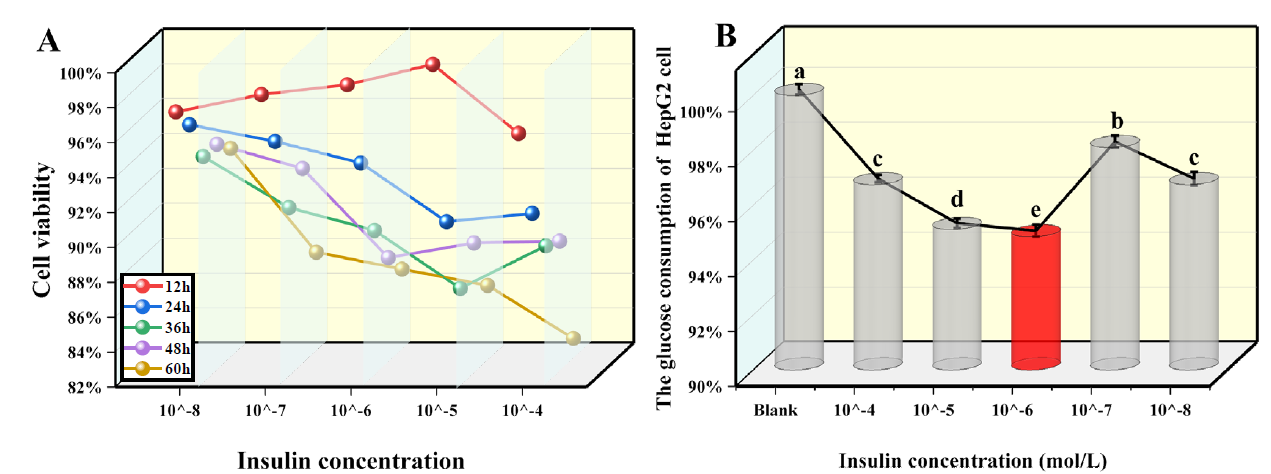
Fig 4 Screening of IR model condition. Blank is the standard HepG2 cell, without insulin and drug intervention. (A) Impact of various contents of insulin on HepG2 cell viability at different points. (B) Effect of insulin content on the glucose consumption of HepG2cells under the optimal time. (X ± S, n=6). Tukey’s test: Different letters indicate significant differences (p < 0.05), the same letters indicate not significant differences.
Fig. 4(B) exhibited that after 24 h treatment with DMEM and insulin-containing 25 mM glucose, glucose consumption was 96.75 %, 95.12 %, 94.85 %, 98.10 %, and 96.75 %. If the content was 10-6 M, the glucose consumption rate of HepG2 cells was the lowest. In comparison to the blank control group, the cells decreased by 3.25 %, 4.88 %, 5.15 %, 1.90 %, and 3.25 %, and the difference was significant (P<0.05). Therefore, 10-6 M was selected as the optimal modeling concentration. In conclusion, high glucose and high ins
Activity and glucose consumption of picroside I against IR-HepG2 cells were determined
Fig. 5(A) presents that the cell viability was more than 90 % after 24 h. However, when the concentration of picroside I was 80 μg/mL, the IR-HepG2 cell viability reached 98 %, which had the slightest effect compared with other concentrations. Therefore, 80 μg/mL was selected as the optimal concentration of picroside I.
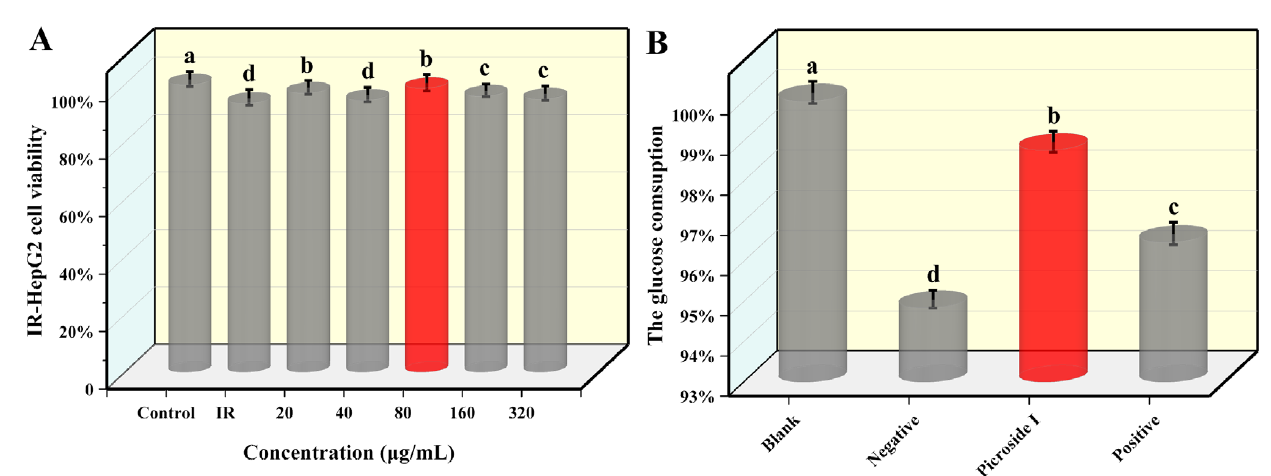
Fig 5 Determination of IR-HepG2 cells experimental. Blank is the standard HepG2 cell, without insulin and drug intervention. Negative is the IR-HepG2 cells without compound treatment. Picroside I is IR-HepG2 cells treated with picroside I. Positive is positive group, IR-HepG2 cells treated with rosiglitazone. (A) Effect of picroside I on IR-HepG2 cell viability. (B) The glucose consumption of the IR-HepG2 cells by treating with 80 µg/mL picroside I. (X±S, n=6). Tukey’s test: Different letters indicate significant differences (p < 0.05), the same letters indicate not significant differences.
As shown in Fig. 5(B), compared with the glucose consumption of the negative group, IR-HepG2 cells glucose consumption treated with picroside I and the positive group was increased, increasing by 4.13 % and 1.72 %, respectively, and the difference was statistically significant (P<0.05). Compared with the positive group, IR-HepG2 cell's glucose consumption significantly increased by 2.37 % after treatment with picroside I. This further proved that picroside I could improve glucose consumption and alleviate IR in IR-HepG2 cells.
Effects of picroside I on MDA content in IR-HepG2 cells
As shown in Fig. 6, the MDA content in the negative group exceeded that of the blank control group, and the difference was statistically obvious (P<0.05), indicating that MDA content increased when IR occurred. After 24 h treatment with picroside I and positive control (rosiglitazone), compared with the negative group, the MDA content decreased significantly, decreased by 37.29% and 32.2%, respectively, and the difference was statistically significant (P<0.05). The outcomes showed that picroside I might decrease MDA content in IR-HepG2 cells and reduce the oxidative stress state of cells.
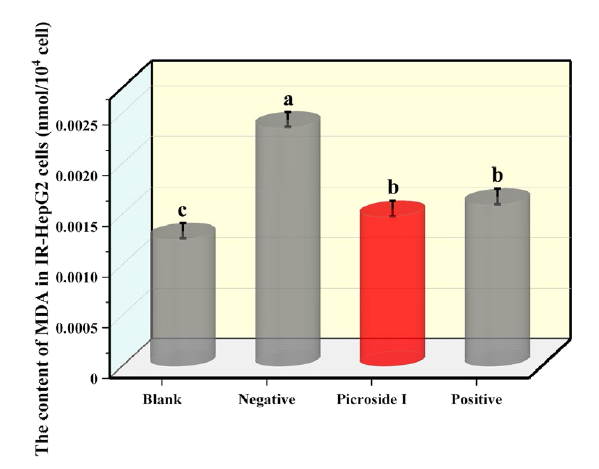
Fig 6 Effects of 80 µg/mL p s the standard HepG2 cells, without insulin and drug intervention. Negative is the negative group, the IR-HepG2 cells without compound treatment. Positive is positive groups, IR-HepG2 cells treated with rosiglitazone. (X ± S, n=6). Tukey’s test: Different letters indicate significant differences (p < 0.05), the same letters indicate not significant differences.
Effects of picroside I on SOD activity of IR-HepG2 cells
Fig. 7 exhibited that the SOD activity in the negative group was significantly lower than that in the blank group, which decreased by 46.15 %, indicating that SOD activity was reduced in cells with IR. After adding picroside I into IR-HepG2 cells, the SOD activity was significantly increased, compared to that of the negative group and positive group. The difference was statistically obvious (P<0.05). The outcomes show that picroside I might enhance the SOD activity and antioxidant capacity of IR-HepG2 cells.
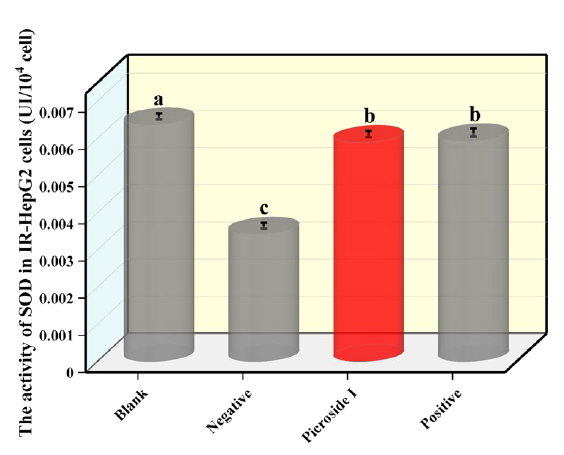
Fig 7 Effects of 80 µg/mL pic the HepG2 cells without insulin and drug intervention. Negative is the IR-HepG2 cells without compound treatment. Positive is positive group, IR-HepG2 cells treated with rosiglitazone. (X ± S, n=6). Tukey’s test: Different letters indicate significant differences (p < 0.05), the same letters indicate not significant differences.
Discussion and Conclusions
This research is significant for the creation of new drugs for T2DM derived from natural products. Unlike other studies, this study not only examined the antioxidant effects of picroside I by analyzing its scavenging capacity and overall reducing ability against DPPH•, ABTS•+, and OH•, but also looked at its impact on carbohydrate degradation and glucose absorption. This was achieved by testing its ability to inhibit α-glucosidase and α-amylase, thus examining the hypoglycemic effects of picroside I through multiple mechanisms. The results showed that picroside I displayed strong antioxidant properties, as well as strong inhibition in α-glucosidase and α-amylase, reducing the conversion of non-carbohydrate substances to glucose and displaying multi-pathway hypoglycemic activity. In the IR-HepG2 cell model, the addition of picroside I led to increased glucose consumption and decreased production of free radical metabolites, with IR decreasing as the concentration of the compound increased. This study investigated the effect of picroside I on oxidative stress and hypoglycemic activity at the cellular level, providing a theoretical foundation and experimental evidence for future experiments in animal models.

