


 nueva página del texto (beta)
 Inglés (pdf)
 Artículo en XML
 Referencias del artículo
 Enviar artículo por email
 Citado por SciELO
  Similares en
SciELO
Similares en
SciELO 
 Permalink
Introduction
The Biofilms are significant in several fields, such as water treatment systems, the food industry, medical sciences, microbial corrosion, and energy sectors, due to the numerous biofilm-electrode interactions that can be useful in biochemical or bioelectrochemical applications [1]. A biofilm is a mass of bacterial cells adhered to surfaces (carbonaceous materials, minerals, semiconductor glasses, electrodes) embedded in a polymer matrix called Extracellular Polymeric Substances (EPS) [2-4]. EPS mainly describes extracellular polysaccharides or exopolysaccharides [5-7]. However, current studies have shown that levels of proteins and nucleic acids can be found in the EPS extracted from biofilms [8,9]. Biofilm development begins with the initial adsorption of soluble molecules (e.g., proteins) to the surface, followed by reversible attachment of cells through the acid-base interactions and electrostatic Van der Waals forces [2,3]. This attachment becomes irreversible following the secretion of specific polysaccharides and the expression of adhesins, leading to a stable, mature biofilm [10]. On the other hand, some biofilms can transfer electrons through the conductive EPS matrix to an electrode, for this reason; these biofilms are known as Electroactive Biofilms (EABs, EABFs) [11-13]. In addition, EABs contain electroactive microorganisms that can transfer electrons directly via nanowires or outer membrane cytochromes; extracellular electron transfer is also capable of extracellular mediators and redox-active electron shuttles such as anthraquinones and flavins [11-13].
A deeper understanding of phenomena occurring in biofilms requires the measurement of the electrical properties with minimal perturbation. Several techniques for studying biofilms provide qualitative and quantitative information. However, these require the micromanipulation of the biofilm, i.e., imaging techniques [14-21]. Therefore, the EIS is appropriate for monitoring the electrochemical signals caused by bacterial cells without damaging the cells or changing the environment [4], and it is also widely used due to its advantages, such as specificity, selectivity, sensitivity, and reproducibility [22-25]. In addition, the EIS technique offers a unique ability to treat bulk and interfacial processes separately based on their frequency [26]. Therefore, EIS is carried out to characterize and monitor biofilms, and to study interfacial charge transfer processes [27]. Although impedance spectra are relatively easy to measure, there are specific challenges to consider for the performance and interpretation of EIS studies in biofilms; among them stand out biological parameters (pure or mixed consortia, metabolism, growth conditions) [11]. On the other hand, another challenge is starting up a suitable experiment (choosing the electrode, materials, shape, and size). Commonly carbonaceous materials such as graphite are employed due to high conductivity (0.2 Ω cm-1), biocompatibility, non-corrosive, porosity, stability, and low cost; however, graphite possesses a high capacitance [27-30]. To overcome the limitations induced by the capacitance, some authors use materials with low capacitance as Fluorinated Tin Oxide (FTO) [27,30]. Furthermore, another challenge corresponds with the analysis of impedance spectra; EIS is validated by Kramers-Kronig relations to prove linearity, causality, and stability of the system, and finally, the spectra are analyzed by fitting the data to a mathematical model of an electrical equivalent circuit ( eec). The analysis of eec enables us to obtain information about the electrical parameters representing the biofilm-electrode interface, monitor biofilm development [31], and investigate bioelectrochemical processes [32]. Electrical circuits in biofilms may contain elements such as Resistance (R), Diffusion (W), Capacitance (C), or a Constant Phase Element (Q). However, in bioelectrode systems, there are redox reactions, adsorption of species, and concentration changes at the electrode-solution interface, among other phenomena. The first thought for the young researcher is, why to use them? These circuits serve as an electrical representation of physicochemical phenomena, which allow us to explain and understand the behavior of an electrochemical system [33] even if, in physical reality, these elements do not exist in a bioelectrode.
As described, this overview will focus on fundamental electrode-biofilms interactions, focusing on three aspects:
The ways of studying biofilm growth (in-situ/ ex-situ)
EIS data validation by Kramers Kronig equations
The discussion of the most representative models of eec The relevant aspects of this manuscript are to analyze the ways of studying biofilms, to present a method of validating data, and the eec analysis of different biofilms. The novelty in this manuscript is the discussion of some electrical elements according to the bacteria's electrochemical nature, so they have been divided into two groups: non-electroactive biofilms / weak electroactive biofilms; and another group of strong electroactive biofilms.
Furthermore, the publications were selected using a three-electrode system, in which the working electrode was used to study the biofilm development. Hence this review excludes EIS studies applied to microbial technologies (microbial fuel cells, microbial electrosynthesis cells, etc.) and biocorrosion as these topics have been extensively studied in other reviews [1,34-36].
Basic concepts of EIS
EIS measures the impedance by imposing low amplitude perturbation of voltage (potential) over a wide frequency range and measuring the current response [37]. Following equations represent the sinusoidal (AC) potential and corresponding current response [38]:
An analogous expression to Ohm's law can calculate the complex impedance of the system as the ratio of the potential and the measured current [38]:
The sinusoidal potential of low amplitude is applied sequentially at a frequency range (hence the name spectroscopy). In biofilm studies, the interval frequency typically starts at high frequencies 104-105 Hz up to frequencies of 10-3 Hz. At each frequency, impedance measurements produce numerical results as real Z’ and imaginary Z’’ impedances or modulus IZI and phase angle θ [33]. This information is included in two fundamental types of graphs: Complex plane plots (Nyquist diagram) and Bode plots [33].
One of the ways to approach the analysis of impedance spectra is to associate the processes occurring in the electrochemical cell with simple elements of electrical circuits: resistors, capacitors, Warbug elements, and Constant Phase Elements (non-ideal capacitors). With them, an eec to the adequate system is proposed, and the experimental impedance data is fitted to these electrical elements. Table 1 lists the frequently used circuit elements and their impedance.
Table 1 Frequently used circuits elements in biofilm models. [38]
| Element | Impedance |
|---|---|
| Resistor |
|
| Capacitor |
|
| Warbug diffusion |
|
| Constant phase element (CPE) |
|
*Where ω refers to radial frequency (rad seg-1), j is the imaginary unit (j2=-1) and Rω is the diffusion resistance, and Q is a Constant Phase Element.
When surface heterogeneity exists, the impedance of the ideal capacitor, 1/jωC, must be replaced by a Constant phase element [33] (Table 1). The parameters α and Q are independent of frequency. When α = 1, Q has capacitance units, i.e., F cm-2, representing the interface's capacity. When α≠1, Q has units of sα Ω-1cm-2, and the system shows behaviour attributed to surface heterogeneity [39].
In order to obtain information about the changes in the interface, the raw impedance data is fitted to a model known as eec [22], and specialized software is available online [40-42]. It is worth mentioning that these eec proposals result from the interpretation of impedance diagrams form. For example, suppose the Nyquist plot displays a semicircle; the impedance response corresponds to an (RC) model. In that case, a depressed semicircle or multiple loops indicate that more than a one-time constant is required [38]. On the other hand, the Nyquist plot is not detailed in frequency, while Bode plots show an impedance behaviour in function of the frequencies. The transition slope between low- high-frequency asymptotes indicates whether characteristic time constants are well separated [38]. Besides, there are alternative graphical expressions to Nyquist and Bode's plots related to other electrical effects [33,38,39].
Biofilm growth procedures in EIS measurements ex-situ / in-situ mode
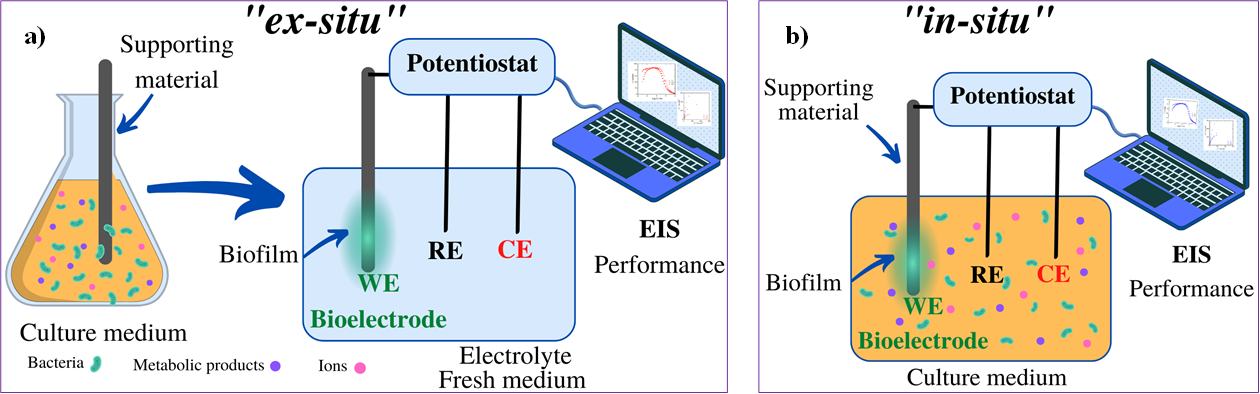
Before performing EIS measurements, it is necessary to differentiate two cases in which EIS can be applied for biofilm studies: 1) to understand the electrochemical interfacial processes between biofilm-electrode, or 2) to use EIS as a tool to monitor the development or evolution of biofilms [27]. Accordingly, the experimental works have used two ways of making the EIS measurements: in ex- situ mode and in-situ mode. In ex-situ experiments, the culture conditions to achieve biofilm formation consist primarily of inoculating the bacterial cells in an adequate culture medium to promote growth. Support materials (electrodes) are immersed in promoting biofilm development. As a second step, the electrode with the biofilm (bioelectrode) is changed to a three-electrode system with fresh culture medium only to do the electrochemical measurement (Fig. 1(a)) [23-25,43].
Some examples in the literature with ex-situ procedures are described in this section. Huerta Miranda et al. (2019) [24] employed a culture media with sodium acetate as a donor and sodium fumarate as an acceptor to achieve the growth of Geobacter sulfurreducens wild-type and mutant biofilms. Therefore, fluorine-doped tin oxide (FTO) semiconductor glasses were immersed in the media and used as support materials for biofilm development at different incubation times (from 12 to 192 h) . In addition, Mendez-Tovar et al. (2019) [25]; employed a medium with elemental sulfur to form a biofilm of Acidithiobacillus thiooxidans over graphite square plates. Kim et al. (2011) [43] used a medium with magnesium sulfate and glucose to promote Pseudomonas aeruginosa adhesion in the presence of a disk of platinum. Ben-Yoav et al. (2011) [10] used a sterile solution of 100 mM KNO3 in two parallel polished and passivated float glass plates coated with indium-tin-oxide (ITO) for an E. coli biofilm study. Bimakr et al. (2018) [44] incubated graphite and stainless steel electrodes in water collected from a reservoir Water System. The indigenous microorganisms in the natural dam water were used as the microbial inoculum. The bioelectrodes were transferred to a three-electrode electrochemical cell with fresh medium (PBS or supporting electrolyte) [10] to perform EIS [24,44]. In some studies, the electrodes were discarded, while others were returned to the vessel for further bacterial adhesion and biofilm maturation [43].
On the other hand, in-situ mode refers to growing the biofilm on the working electrode and in the same culture medium, placing a three-electrode system, and doing the electrochemical measurement (Fig. 1(b)). For G. sulfurreducens tests have been carried out, the biofilms were grown in situ on an electrode that was subsequently analyzed by Marsili et al. (2008) and rotated by Babauta et al. (2014) in order to study electron transfer between biofilms and electrodes [45,46]. In addition, Romero et al. (2021) employed an electrochemical cell filled with a culture media with urea, then ureolytic microorganisms (with capabilities to hydrolyze urea) were inoculated [23]. Subsequently, the EIS technique was used in-situ to characterize these ureolytic biofilm growths on the graphite rod tips [23]. The in- situ mode senses the changes in culture media due to metabolic activity. As indicated by Martin et al. (2018), the changes in electrochemistry can aid in detecting the growth and physiological status of the bacteria [37]. According to the literature, several devices work in-situ to detect biofilms in drinking water distribution systems or to study oral biofilms [47,48].
Kramers-Kronig relations
After performing the EIS measurements, it is necessary to validate the data due to bacteria being attached to the electrode surface; validation of EIS spectra requires that the electrochemical system maintain a steady state (linear, time-invariant, and causal system) [49].
EIS permits validating the experimental measurements before analysis to determine if the data is good [33]. Kramers and Kronig proposed that integral equations relating to a complex function are real and imaginary [33,39]. For a spectrum to be valid and satisfy the Kramers Kronig relations, it must meet the following criteria [33,50,51]:
Linearity: The system is described by a system of linear differential equations. The impedance response is not dependent on the applied amplitude of the perturbation of the system.
Causality: The system response must be caused only by the applied perturbation. The condition of stationarity is implicit in this criteria [39].
Stability: A stable system remains stable until excited by an external source, and it should return to its original state once the perturbation is removed.
Finitess: It means that the real and imaginary components of the impedance must be finite-valued over the entire frequency range 0 < <∞.
In the Kramers-Kronig test of Boukamp [52], the measured impedance is adjusted to a series connection of elements (R-C in parallel) followed by the calculation of the Kramers Kronig residuals, which are defined as the difference between the experimental impedance values and the fitted values for each frequency [53,54], according to equations (4) and (5):
where ZRe (experiment) and ZIm (experiment) relates to the real and imaginary impedance of experimental measurements while ZRe (KK) and ZIm (KK) relates to the real and imaginary impedance obtained by the fitted KK compliant equivalent circuit model.
The Kramers Kronig residuals are plotted vs. log frequency; this graph allows us to observe how the residuals are distributed over the whole frequency range. The distribution of the residuals is used to indicate the deviation and the reproducibility of a measured impedance spectrum by the fitted KK compliant equivalent circuit model [55].
There may be cases where the distribution of these residuals is systematic (not random), as shown in Fig. 2(a,b), where at low frequencies (10-3-10-1 Hz) appears an increasing tendency, moreover, Fig. 2(b)) also shows a systematic error in all frequencies and large values. The spectra shown in Fig. 2(a,b) do not satisfy the Kramers Kronig relations; due to the nature of the experiments, they may need to be in a steady state. To validate EIS spectra, they must have randomness [53] and low percentages; examples of satisfying KK residuals are in the literature [25,56, 57].
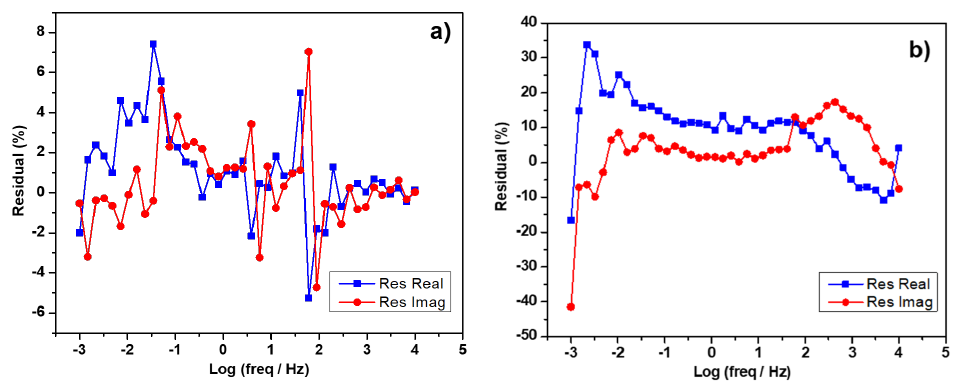
Fig. 2 Examples of Kramers Kronig residuals with systematic errors: (a) acidophilic biofilm and (b) ureolytic microorganism biofilm, both supported on bare graphite electrodes. Source: Author´s unpublished results.
The distribution of residuals has been used in other areas of electrochemistry [53,54,57]. However, there are a few studies about Kramers Kronig residuals for biofilm growth; this absence may be associated with difficulty maintaining a steady state (causality) when bacteria are present on the electrode forming a biofilm and conditions change over time.
Babauta et al. (2014) [46] obtained a residual percentage for Geobacter sulfurreducens biofilm. Some percentage values achieved 5 to 10 % at frequencies between 10-2 to 1 Hz. Moreover, Romero et al. (2021) [23] concluded that EIS spectra analysis was reliable for frequencies higher than 10−2 Hz since the distribution of residuals was random. At lower frequencies, the biofilm-graphite interface undergoes modification. Méndez-Tovar et al. (2019) [25] compared the percentage of the residuals of the impedance spectra of the abiotic control and a bioelectrode with a biofilm on the seventh day of incubation. The residual percentages for real and imaginary components showed a random variation and values of 1.8-0.5 %, confirming the stationary state of biofilms and data validation. The low percentages might be due to the absence of suspended elemental sulfur during EIS measurements (ex-situ).
Free software is available to obtain the Kramers Kronig residuals [52,55,58]. After validating the EIS data, it is reliable to analyze it and use an eec to get information on changes at the biofilm-electrode interface.
Analysis of parameters of electrical equivalent circuits (eec)
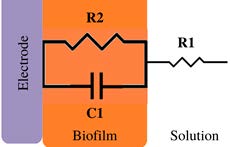
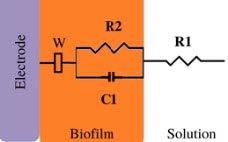
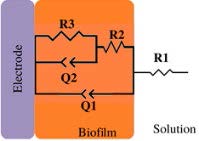
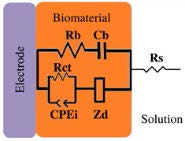
Impedance data is analyzed by fitting to an electrical equivalent circuit eec model, which would be selected for an intuitive understanding of the electrochemical properties of biofilm. Therefore, the following is a discussion of the elements of eec and what has been found in the literature about the study of biofilms in a three-electrode system. Table 2 shows some of the eec used in different studies; due to the diversity of designations in the literature, this document proposes some general terms for its use. The following publications report the electric elements in several units; nonetheless, in this review, the interpretation aims to provide an overview of the phenomena occurring in the biofilm-electrode interface; therefore, the values of elements were normalized with the geometric area of the electrodes.
Table 2 Interpretation of EIS diagrams by eec and kind of cultures*.
| Model eec | Type of phenomena studied by EIS | EIS conditions: frequency, potential | Type of biofilm / electrode | References |
|
Bacterial adhesion and biofilm growth | 10 mV at OCP, (1 to 1 ×10⁵) Hz | Pseudomonas aeruginosa / Platinum | [4,43] |
| Biofilm-electrode interface and electron transfer mechanisms | 10 mV at OCP, (1×10⁵ to 1×10⁻²) Hz | Geobacter Sufurreducens / Graphite paper electrodes | [79] | |
|
Bacterial adhesion and biofilm growth | 10 mV at OCP, (1×10⁵ to 1×10⁻²) Hz | Geobacter Sufurreducens / Glassy- carbon | [45] |
| Bacterial adhesion and biofilm growth | ±10 mV at OCP, (1×10⁴ to 1×10⁻³) Hz | Ureolytic microorganisms / Graphite | [23] | |
|
Bacterial adhesion and biofilm growth | 10 mV at OCP, (1×10⁵ to 1×10⁻²) Hz | Mixed Culture / Graphite, / Stainless steel | [44] |
|
The effect of mass transfer processes on electron transfer | At +0.497 V vs. SHE Frequencies and amplitude not reported | Geobacter sulfurreducens / Glassy carbon rotating disk electrode | [46] |
| Evaluate a small overpotential approximation for extracellular electron transfer | ±5mVrms with a peak-to-peak potential window of ~15 mV, (1×10⁵ to 1×10⁻¹) Hz | Geobacter sulfurreducens / Gold | [80] | |
| The comparison electroactive properties of mutant and wild type biofilms | 10 mV at OCP, (5×10⁴ to 1× 10⁻³) Hz. | Geobacter sulfurreducens / Fluorine doped tin oxide (FTO) semiconductor glasses | [24] | |
| The characterization of the biofilm formation | ±10 mV at OCP, (1×10³ to 1×10⁻³) Hz | Acidithiobacills thiooxidans / graphite electrodes | [25] | |
|
Attachment and biofilm growth | 50 mV at +0.247V vs. SHE, (1×10⁻¹ to 4×10⁵) Hz | Escherichia coli /ITO | [10] |
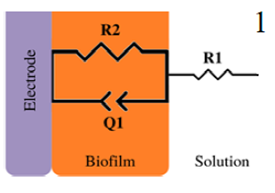
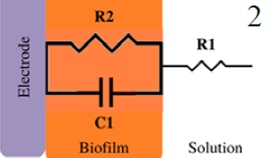
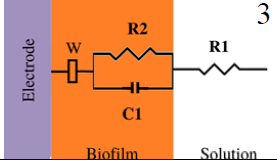
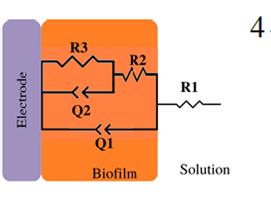
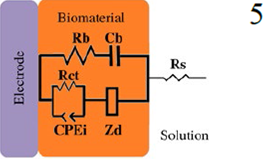
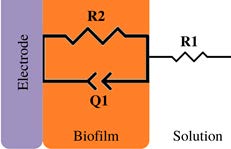
*Description of models, in all cases: R1 = Solution resistance. In models 1-3: R2 = Charge transfer resistance or biofilm resistance, C1or Q1 = Double layer capacitance or constant phase element of the solution-electrode interface. Model 4: R2= Biofilm resistance, R3= Interfacial resistance or charge transfer resistance, C1 = Biofilm capacitance represented with constant phase element of the biofilm (Q1), C2 = Interfacial capacitance represented with constant phase element of the solution-electrode interface (Q2). Model 5: Rs= Solution resistance, Cb= Biomaterial capacitance, Rb= Biomaterial resistance, Zd=anomalous diffusion, Qi= constant phase element of the solution-electrode interface, Rct= charge transfer resistance.
Solution resistance R1 analysis
The solution resistance is the first electric element to be analyzed in models concerning detecting bacteria and monitoring biofilms since the current passes through the bulk of culture media before reaching the interface with an electrode [38]. Therefore, in some studies of the initial characterization of biofilms, in-situ strategies have been reported to estimate R1 value with variations up to 15 % caused by the metabolic activity of the microorganisms in the culture media. Furthermore, Romero et al. (2021) [23] reported that the resistance (R1) decreased from 17 Ω cm2 to 11 Ω cm2 in the presence of ureolytic microorganisms during the first 18 h (Table 3). This decrement is associated with increased ions in the solution since urea hydrolysis produces ammonium. Finally, R1 is associated as a function of ionic concentration in the medium, which increases during bacterial growth due to the conversion of weakly charged substances in the medium into highly charged ions [59].
Table 3 Estimated values of electrical elements.
| Model eec | C [𝛍F cm2] or Q [sα Ω-1] | R1 [Ω cm2] | R2 [kΩ cm2] | R3 [kΩ cm2] | Biofilm Electroactive classification | Applied Potential | References |
|
Decrease 15% | 114 ** | 6×10² to 5×10² *** Rct | Weak electroactive | ✘ | [4,43] | |
| 313-725 | --- | 11.64 to 9.66 and 63 (0.24 V) Rct | Strong electroactive | ✔ | [79] | ||
| 18000 | 0.86 | 1 ⨯ 10 -2 at -0.16 V 1.17 at +0.042 V Rct | Strong electroactive | ✔ | [45] | ||
|
200 to 260 (biotic) 500 (abiotic) | 17 to 11 | 3× 10³ to 1× 10² R biofilm | Weak electroactive | ✘ | [23] | |
|
3125 to 5000 (graphite) 25 to 237.5 (stainless steel) | --- | 72 to 24 (graphite) 640 to 160 (stainless steel) Rct | Non and weak electroactive | ✘ | [44] | |
|
Q1= 5.9 x10⁻⁵ * α=0.825 | 25.5 | 0.25 Rct | 0.15, and 0.18-0.82 (0.497 V) Rct | Strong electroactive | ✔ | [46,80] |
| 8.3 | 90-180 | 0.28 (Wild type), 0.47 (PilR-mutant) R biofilm | 30 (Wild type) 75 (PilR-mutant) Rct | Strong electroactive | ✘ | [24] | |
| 5-91 | 15-12.7 | 0.038 R biofilm | 330 Rct | Weak electroactive | ✘ | [25] | |
|
18-30 | --- | Rb = 0.06 (Growth period) R biomaterial | Rct | Weak electroactive | ✔ | [10] |
* Some values are presented in units of the constant phase element Q, while the rest are presented in units of the capacitance. ** In R1 the value is presented in ohms (Ω) due to it was not possible calculate the geometric area. *** In R2 the value is presented in kiloohms (kΩ) due to it was not possible calculate the geometric area. Values not reported by the authors ---. In addition, Rct refers to charge transfer resistance, R biofilm refers to the biofilm resistance. The potential values refer to V vs. SHE. The symbols: ✘ indicate OCP condition, and indicate applied potential condition.
In other cases, culture media is composed of extracellular resistive components; therefore, replacing the medium with a conductive aqueous solution (excess of supporting electrolyte) is recommended to guarantee the independent estimation of R1 [38]. Accordingly, in ex-situ systems, Huerta-Miranda et al. (2019) [24] obtained values varying from 90 to 180 Ω cm2 range (Table 3). In other cases, the R1 value decreased 1h after inoculation due to the attachment [4], similar behavior is reported by Méndez-Tovar et al. (2019), that found a decrease in R1 from 15 cm2 to 12.7 Ω cm2 during the first day of the experiment due to ions like H+ and SO42-(byproducts from sulfur bio-oxidation) adhered on the biofilm and released in the fresh medium were EIS was performed [25]. Moreover, for longer incubation times, R1 remained in a constant range of values (15 to 12.7 Ω cm2).
According to these studies, the importance of estimating in-situ R1 lies in the fact that this element provides information on bacterial metabolism. In both cases (in-situ/ex-situ), R1 is a significant factor in the total impedance for an electrochemical cell, and any solution-resistant contribution between electrodes must be considered when a biofilm development is modeled [38]. On the other hand, in a potentiostat, the total solution resistance between the working and counter/reference electrodes is compensated; therefore, iR drop is negligible [38].
Biofilm classification according to electroactivity
Due to the eec information obtained for biofilms being heterogeneous to discuss the capacitance and R2, R3, the biofilms are divided into two groups: strong electroactive and another group weak electroactive and non-electroactive biofilms.
Geobacter sulfurreducens and Shewanella oneidensis are well-known models of strong electroactive bacteria and have been extensively studied [60-62]. In recent years the dividing line between electroactive and non-electroactive bacteria has become more diffuse, as there are several bacteria that, under specific conditions, can generate current, such as the case of E. coli, which was traditionally considered a non-electroactive bacteria [61-63]. Marsili and other authors have proposed that some microorganisms do not have the mechanisms to be capable of extracellular electron transfer. However, these microorganisms can transfer charge to the electrode under particular growing or enrichment conditions and are known as weak electroactive bacteria since they produce low current densities [60,62]. Some examples of weak electroactive bacteria are Pseudomonas aeruginosa [60,64,65], Bacillus megaterium [61], Bacillus subtilis [66,67] and some genera as, Enterococcus sp. [61], Clostridium sp. [61] and Streptococcus sp. [61].
Non -electroactive or weak electroactive biofilms are traditionally studied under conditions without mediators or previous adaptations. These studies are relevant in medicine (drug development), environment (biogeochemical cycles), and biotechnology [64]. On the other hand, strong electroactive bacteria are studied to better understand the extracellular charge transfer by applying a potential, and its study is focused on understanding an electroactive biofilm to improve the current production of a BES device [30, 42,46,68-70]. Therefore, a general classification was made in the capacitance and R2, R3 analysis; each section was divided into two groups: non-electroactive / weak electroactive biofilms; and another group of strong electroactive biofilms.
Capacitance
In general, capacitance is the most commonly used of all the elements of the proposed eec to represent bacterial adhesion and biofilm development. This element can be represented by an ideal capacitor or a CPE, as this includes irregularities on the surface (non-ideal capacitance). Some studies only present the changes in the double-layer capacitance (models 1-3, Table 2). At the same time, there is no standardized way of using eec; there are different ways of naming the biofilm capacitance, such as material and film capacitance. This article will focus on changes related to capacitance due to bacterial attachment and biofilm growth by respecting the name used according to the model (Table 2). To determine the specific experimental conditions of EIS for each biofilm, see Table 2.
Capacitance response of non-electroactive / weak electroactive biofilms
Most of the papers in this section report information obtained from the biofilm capacitance of non-electroactive or weak electroactive bacteria, where the primary purpose was to observe biofilm development under conditions where charge transfer was not favored (OCP).
In some publications, there is a correlation between increased capacitance and biofilm formation. Bimakr F. et al. (2018) [44] studied biofilm growth in drinking water systems (model 3, Table 2) (ex-situ). To prevent chlorine overdosing and the formation of harmful products derived from chlorine reactions with natural organic matter, they developed a dynamic biofilm-sensing system to control disinfectant dosing in real time. The indigenous microorganisms in the raw water were used as inoculum, and the system was studied ex-situ using graphite or stainless-steel electrodes. EIS and OCP measurements were correlated with biofilm growth parameters such as flow cytometer, cell counts, and ATP concentrations. The cell density was correlated with OCP, capacitance, charge transfer resistance (R2), imaginary, and real impedance. From all the parameters, it was found that changes in capacitance showed a positive linear relationship with the number of cells attached to graphite and steel electrodes (R2 > 0.90). On the other hand, a negative relationship was found as the capacitance decreased to baseline levels within 24 h after adding chlorine treatment [44].
Another example of capacitance increment is the biofilm formation of A. thiooxidans on a graphite surface (previously grown using S 0 as energy source) by EIS measurements without electrical perturbation (at OCP conditions) (ex-situ) [25]. In this work, it was possible to observe the growth of the biofilm and changes in the EPS. The changes observed in the elements obtained from the eec (model 4, Table 2) [25] correlated with the biofilm evolution and the hydrophobic /exopolysaccharide compound ratio during the 7 days of incubation. The biofilm capacitance increased until day 5 to 91 μ F cm-2, while the abiotic control remained at 20 μF cm-2. This change was related to bacteria attachment and the accumulation of biopolymers such as proteins and polysaccharides. The electrical properties are mainly determined by a balance of amino and carboxyl groups since it is known that EPS from sulfur-grown cells contains polysaccharides and fatty acids. Then, on day 7, the biofilm capacitance slightly decreases. This behaviour in capacitance fluctuations coincides with Bimakr et al. (2018) [44] work. As the biofilm grows, so does the increase in capacitance. Still, the capacitance decreases if detachment or external aggression allows the biofilm to decay.
The increase/decrease in capacitance was also reported in E. coli biofilms [10], Ben-Yoav et al. (2011) [10] performed Impedance measurements of E. coli attachment and biofilm formation on indium tin oxide (ITO) electrodes (ex-situ). In order to estimate the surface area covered by E. coli, they used optical microscopy and an eec analysis to characterize both attachment and biofilm growth (model 5, Table 2). The eec element: Cb is analyzed as a function of attachment and time. During attachment, Cb increases from 18 μF cm-2 to 30 μF cm-2, the production of an exopolysaccharide matrix promotes the Cb decrement until it reaches a steady state (6 μF cm-2). This fact is associated with the time it takes for E. coli biofilms to reachwhileinbiofilmmaturationstages, maturation, which is 48 hours of incubation; after this, biofilm properties do not change significantly [71-73]. The above-mentioned articles show an increase in capacitance as the biofilm develops, but if there are changes in the biofilm, these can also be observed by EIS. However, in some cases, the experimental conditions selected do not permit the detection of changes in capacitance. Romero et al. (2021) [23] achieved an ureolytic biofilm supported on graphite that manifested urea hydrolysis from the beginning of the experiment since this was favored by the culture medium used. This work analyzed the system, both in situ and ex situ. The proposed equivalent circuit used in both cases was the same (Model 2, Table 2) [23]. In situ analysis showed that capacitance variation with immersion time was chaotic. Such high variability was associated with metabolic products, microorganisms suspended in the solution, and charge accumulation due to bacteria adhering to graphite. Therefore, an independent characterization by EIS ex-situ (fresh medium) was performed. Results showed the increase of biofilm capacitance from 200 to 260 F cm-2; however, these values are lower than those obtained in the control (abiotic) system (500 F cm-2). Nevertheless, this is not the only study to show this opposite behaviour where the biofilm capacitance decreases below the control value. In fact, Mauricio et al. (2006) [74] propose that electrical capacitance diminishes with increased biofilm thickness over time.
A decrease in biofilm capacitance was also reported by Kim et al. (2011) [43]. They studied the adhesion of wild type and mutant Pseudomonas aeruginosa on platinum disk electrodes (ex-situ). The proposed equivalent circuit was a randles circuit (Table 2, model 1); the degree of biofilm formation and bacterial adhesion were correlated with changes in the Q values as ∆Cdl [43].
where Qt and Q0 are the Constant Phase Elements representing the double layer capacitance (C) at specific and initial time of EIS measurement, respectively.
As the experimental incubation time increased, the value of ∆Cdl [43] decreased; however, the images obtained by Confocal Laser Scanning Microscopy showed adhered bacteria and biofilm formation in the disk electrodes (48 h). Hence, the decrease of ∆Cdl in both strains concerning the control is associated with this behaviour. Moreover, it was shown that other molecular components, such as the type of EPS, might cause a decrease in biofilm capacitance. Molecular components outside the bacterial cell body and metabolites (including EPS) might influence the double layer capacitance. This fact was demonstrated by adsorption tests using tryptone as a model compound, which adsorbs at the electrode surface and obstructs the double layer charging. Therefore, the result was a sharp decrease in ∆Cdl upon contact with the tryptone [43]. The authors subsequently monitored Pseudomonas aeruginosa biofilm formation on an interdigitated array electrode (model 1, Table 2) [4]. From EIS measurements it was obtained a similar result in in-situ conditions, where the Q1 value representing the double layer capacitance decreased by 15 % compared to the control. Even though Scanning Electron Microscopy images showed bacterial attachment on the IDA electrode surface within 1 h (in-situ).
The section concludes that the molecules that constitute the EPS and the bacterial membrane give rise to a charge balance that can impact the capacitance fluctuations. However, the diversity of exopolymers is enormous. For example, Eboigbodin et al. (2019) [8] extracted free EPS from E. coli and identified more than 500 proteins with functionality related to amino acid and carbohydrate metabolism in different media conditions. Therefore, information on polymers produced by model organisms such as E. coli, Bacillus subtilis, and Pseudomonas aeruginosa [7,75-77] needs to be better correlated with EIS analysis. In addition to the EIS study, it would also be necessary to analyze the EPS to detect changes in composition to gain a deeper understanding of the eec elements and other phenomena that occur at the interface. Therefore, further studies on EPS and the biofilm's physical and chemical characteristics are needed to take complete advantage of EIS. This is one of the current challenges of EIS.
Capacitance response of strong electroactive biofilms
In the literature, various studies apply different potentials to electroactive biofilms, where the working electrode (bioelectrode) acts as an anode or cathode, depending on the type of bacteria. This is done to improve bioelectrochemical devices such as MFC, MEC, etc. Geobacter sulfurreducens is an electroactive bacteria since it has the ability to utilize electrodes as an electron acceptor (bioanode) [78] and has been studied under different conditions. EIS measurements with applied potential were analyzed by different authors using eec models to study electroactive biofilms (in-situ mode) . Srikanth et al. (2008) [79] achieved immobilization of G.sulfurreducens on graphite paper electrodes by coating them with Pectin (model 1, Table 2). A single time constant for the equivalent circuit was proposed, using a CPE to describe the behaviour of a non-ideal capacitance. When an oxidizing potential (+0.24 V vs. SHE) is applied for 24 hours, the capacitance increases from 313-725 F cm 2. These results reflected increased interaction between the biofilm and the electrode surface, while Marsili et al. (2008) (Model 1, Table 2) [45] reported that the capacitance remained similar for all potentials explored (+0.04, -0.06,-0.16, and -0.026 V vs. SHE) in a G. sulfureducens biofilm.
Moreover, Babauta et al. (2014) [46] demonstrated the effect of mass transfer processes on charge transfer by G. sulfurreducens biofilms (in-situ mode) using a glassy carbon disk electrode. The EIS measurements were fitted to Model 4, Table 2, with an applied potential of +0.497 vs. SHE. The increase of Q1 (biofilm capacitance) up to values approximated of Q1= 5.9 x10⁻⁵ Sα Ω-1 α=0.825 indicated the adsorption of charged species both on the surface of the electrode and inside the biofilm rises with current production by G. sulfurreducens (Model 4, Table 2). Subsequently, using a gold electrode [80], the same authors evaluated a small overpotential approximation for the extracellular electron transfer in G. sulfurreducens biofilms. Biofilm impedance changes were correlated using EIS measurements at half-wave potential E1/2 and an electrochemical quartz microbalance (eQCM). From the fitting of the equivalent circuit, it was observed that Q1 value increased with the current [80].
As seen above, G. sulfurreducens biofilms report increases in capacitance concerning control (in-situ mode) when a potential is applied. The changes in capacitance may also be associated with the type of EPS secreted and its quantity, depending on the growth conditions (applied potential or OCP). These changes in EPS coincide with Stöckl et al. (2019) [81], who observed that G. sulfurreducens biofilm secretes a higher amount of EPS when grown in electroactive conditions in graphite-based electrodes under oxidizing (+0.597 V vs. SHE for l8 d) as opposed to grown suspended cells at non-electroactive conditions. Even so, a few publications focus on the EPS study of this type of biofilm [81,82].
On the other hand, biofilms of G. sulfurreducens at OCP conditions have also been grown and studied by EIS, where the objective was to examine the biofilm to obtain data about its behaviour and evolution. Huerta-Miranda, G. A et al. (2019) [24] compared G. sulfurreducens wild type and PilR deficient mutant biofilms supported on FTO electrodes (ex-situ mode) (Model 4, Table 2) [24]. The capacitance value of FTO electrodes decreased by the presence of the biofilms. The results showed that PilR deficient mutant formed a thinner and less conductive biofilm; however, biofilm capacitance values fluctuated over time, and at 192 hours, a similar value (≈ 8.3 F cm-2) was obtained for both strains. The authors reported that even though the capacitance value is similar in both strains due to the electroactive proteins, this does not mean that they are of the same nature since the PilR-deficient mutant expresses different cytochromes than the wild type strain. This work shows that G. sulfurreducens biofilm grown at OCP conditions allows to observe the fluctuations in capacitance without changes in the solution and bacteria behaviour from the same species.
From the analyzed papers of non-electroactive / weak electroactive biofilms, it is shown that the culture medium can affect capacitance and that its measurement is inaccurate when done in situ conditions. This fact can be applied to the discussed G. sulfurreducens biofilms papers where the eec analyses were performed in-situ mode in the presence of acetate and with applied potential, so the obtained capacitance values could have interference due to the acetate consumption present in the medium. Therefore, as far as we know, the most representative capacitance values for G. sulfureducens biofilm could be those of Huerta Miranda et al. (2019) [24], which were carried out in ex-situ conditions without an applied potential and absence of acetate (≈ 8.3 Fcm-2). However, it is important to remember that this biofilm capacitance value is reported using an FTO electrode, while the other works [46,78,79] use other carbon allotropes. FTO has the advantage of having low capacitance values in the order of tens of F cm-2 [30]. On the other hand, carbon materials such as graphite possess a high capacitance (~1 mF cm -2) [27-29] that can enlarge the biofilm capacitance.
Summarizing Capacitance section, the experimental design and the choice of the work (in-situ / ex-situ mode) will depend on the research objectives and the required information that it is desired to obtain. The analyzed articles suggest that the change in the capacitance depends on the type of bacteria, the EPS produced, whether an applied potential is used, and in general, the experimental conditions performed. The choice of an electrode is important since the capacitance of the material could impact the entire biofilm capacitance value. One of the challenges of using EIS and its analysis by eec is the phenomenological interpretation of each electric element. Experimental tests of EIS measurements could correlate their data more with EPS to better describe the whole circuit.
R2, R3 analysis
The different representations of the elements R2 and R3 are described here. Those are mentioned below according to the circuit models used in Table 3. While most papers mention the behaviour of the solution resistance and capacitance, not all discuss R2 or R3; only a few include it where its behaviour is evident. The meaning of the parameter R2 or R3 will depend on the type of bacteria, the conditions of the system being analyzed, and the complexity of the chosen eec. The bacterial systems are different, so finding a correlation between articles is difficult. However, it is crucial to identify the meanings that R2 and R3 can have.
R2, R3 response non-electroactive / weak electroactive biofilms
EIS studies of non-electroactive / weak electroactive biofilms were performed to study the electrochemical response of the biofilms. EIS studies were measured without electrical perturbation (at OCP conditions), and some works fitted their data to different eec, for example, R1(R2C1), R1(R2Q1), and R1(R2Q1) W (Table 3, models 1-3). Some papers for non/weak electroactive biofilm define R2 as charge transfer resistance [43,44]. Kim et al. (2012) [43] reported a decrease of R2 (charge transfer resistance) related to the biofilm attachment of Pseudomonas aeruginosa, while in the work of Bikmar et al. (2018) [44] with indigenous microorganisms in the raw water, they observed a decline in R2 (Charge transfer resistance) due to microbial fouling after chlorine treatment. On the other hand, Romero et al. (2021) [23] performed both in-situ and ex-situ experiments using an ureolytic biofilm. For eec analysis, they proposed an R1(R2C1) (model 2, Table 3) where R2 represented biofilm resistance. Both experimental modes (in situ / ex-situ), they observed a decrease in R2, revealing the presence of metabolic products (i.e., ammonium, protons, HCO-3) within the biofilm.
In some cases, impedance spectra biofilms yielded a more complex response; consequently, more capacitors and resistors are included (Model 4, Table 3). R2 is defined as biofilm resistance, and R3 represents charge transfer resistance or interfacial resistance. Only a few reports describe the behavior attributed to R2 and R3 due to the complexity of the biofilm response. Mendez-Tovar et al. (2019) (Model 4, Table 3) [25] observed that A. thiooxidans biofilm resistance R2 increased up to day 3 due to attachment and biofilm growth. Confocal Laser Scanning Microscopy images showed more hydrophobic compounds in the EPS matrix (non- conductive). These hydrophobic compounds enhance interfacial tension between the cells, while R3 fluctuates during the 7 day of the experiment and decreases during the seventh day [25]. The considerable value of R3 (approximately 330 kΩ cm2) is associated with the chosen experimental conditions (at OCP, no sulfur), where charge transfer between bacteria and graphite was hindered. Moreover, it should be remembered that not all bacteria can carry out charge transfer to the electrode since it does not have a mechanism; A. thiooxidans is considered a non-electroactive bacteria since it is aerobic [61]. However, there are articles where it is inoculated in an anodic chamber of MFC in different conditions, with results showing current production (0.86 mA cm-2) [83]. The same arises with Pseudomonas aeruginosa (facultative) and ureolytic bacteria (facultative), there are articles in the literature where these weak electroactive bacteria have produced currents in bioelectrochemical devices as a consequence of enrichment procedures in MFCs [62-64].
Summarizing this section, models (1-2, Tables 2,3) are known as a Randles circuit, which is commonly used to start up to analyze biofilm-electrode interfaces. In the case of non-electroactive / weak electroactive biofilms shown in Table 3 [4,23,25,43,44], the charge transfer resistance in parallel with a capacitor or a constant phase element is proposed to describe a biofilm electrode interface. Therefore, is not expected that these biofilms carry out the charge transfer process. It could explain the differences in denominations and interpretations of these elements in these reports; some of them report that the changes in the charge transfer resistance are due to microbial biofouling, attachment, and biofilm growth [25,43,44], while nother interpretation refers to R2 indicating the biofilm resistance produced by metabolic products within the biofilm [23].
R2, R3 response strong electroactive biofilms
Geobacter sulfurreducens is a strong electroactive bacteria that can utilize electrodes as an electron acceptor [78]. Consequently, the working electrode acts as an anode in a three-electrode system where a potential is applied. Some works fitted EIS data to an eec model R1(R2Q1), where R2 relates to the charge transfer resistance. Therefore, different potentials were applied by Marsili et al. (2008) [45] and Srikanth et al. (2008) [79] (Model 1, Table 3). When Marsili et al. (2008) [45] performed the EIS measurements at the midpoint potential of -0.16 V vs. SHE, the lowest charge transfer resistance 1x10⁻² kΩ cm2 was obtained. In contrast, the EIS measurements at 0.042 V, vs. SHE results in larger values of 1.17 kΩ cm2 (Table 3) . On the other hand, Srikanth et al. (2008) [79], immobilized G. sulfurreducens on graphite paper electrodes, and the addition of acetate caused the charge transfer resistance to decrease, indicating an active charge transfer process. When an oxidizing potential (+0.24 V versus SHE) is applied for 24 hours, there is a fourfold increase in oxidative current, and the charge transfer resistance increases to 63 kΩ cm2.
In some cases, impedance spectra of G. sulfurreducens biofilms yielded at two-time constant response and to another eec R1(Q1(R2(R3Q2))); consequently, another resistor and capacitor are included in the circuit (Model 4, Table 3). Where R2 is the biofilm resistance, and R3 represents the charge transfer resistance or interfacial resistance [46]. In the study carried out by Babauta et al. (2014) [46] under electrode polarization, the control of mass transfer processes was used to quantify the change of G. sulfurreducens biofilm impedance (Model 4, Table 3) [46]. They reported the decrement of R3 in the presence of acetate (to generate anodic current). On the other hand, in another report of G. sulfurreducens biofilms [24] where EIS was performed in absence of acetate and at OCP conditions (Model 4, Table 3) [24], the results showed that R3 of the biofilms was a twofold time less than bare electrodes; however, the reason of this change is not mentioned in the article. It can be inferred from the Cyclic Voltammetry experiments that oxidation processes are occurring in the biofilm-electrode interface and diminishing R3 value.
For the strong electroactive bacteria, it is expected that R2 in a Randles circuit (model 1, Table 3) [45,79] and R3 (Model 4, Table 3) [46] give insights about the charge transfer process, indeed in these cases, modifications were reported in R2, and R3 as a consequence of an applied potential, or by the acetate consumptions. This result confirms the role of the Geobacter sulfurreducens biofilms acting as an anode; an applied potential also affects the charge transfer process.
Impedance measurements in a particular frequency
After performing impedance measurements in a particular frequency range, some studies select only one or a few characteristic frequencies representing biofilm evolution. The choice of some frequencies can further reduce response times. Although using one or a few chosen frequencies is intended to reduce times, the system and possible variations must first be known for a frequency to be representative of biofilm growth. EIS is suitable for analyzing the attachment of biofilms at frequencies ≤ 102 Hz [44,84], while at high frequencies (102 -104 Hz), impedance is largely influenced by the effect of the solution resistance [44,85].
Kim et al. (2012) [4] monitored the bacterial attachment of Pseudomonas aeruginosa. Initial adhesion monitoring was achieved by measuring the capacitance of the double layer at a fixed frequency of 102 Hz over time. This frequency was selected because at a frequency range between 102 and 103 Hz the double layer capacitance decreased after 1 h of bacterial attachment. To the best of our knowledge, no studies of EIS of G. sulfrreducens or other strong electroactive biofilms performed at a single frequency exist. However, in the reported EIS spectra of G. sulfurreducens biofilms [24,80], the Bode phase diagrams present, at the first time constant, values of 80 degrees (non-ideal capacitance) at a frequency range of 101-102 Hz. These frequency values are still within the above mentioned parameter at frequencies ≤ 102 Hz. So, even when dealing with strong electroactive bacteria, the frequency range for capacitance detection is the same as when dealing with non-electroactive / weak electroactive biofilms.
Moreover, there is a study where high frequencies were used for biofilm detection using solution resistance. Song et al. (2020) [86] studied three oral bacteria, Streptococcus mutans, Actinomyces viscosus, and Lactobacillus fermentum, supported on gold, carbon, and reduced graphene oxide-carbon electrodes (rGO-CE). This work chose representative frequencies to detect biofilm growth. The impedance response signal related to the growth of S. mutants and A. viscous was found to be 3.3 times and 6.0 times stronger than the Au electrode at 1.17 kHz and 54.7 kHz, respectively. The study concluded that the increase of impedance signal after biofilm formation was mainly related to the increase in solution resistance [86]. However, solution resistance indirectly measures biofilm growth associated with producing metabolic compounds. It may be more susceptible to change if the composition of the culture media changes slightly.
Conclusions and perspectives
In this review, we showed information on EIS measurements, data validation, and model fitting; we also discussed the most relevant parameters of eec elements. As biofilms are different, finding a correlation between articles is challenging; however, identifying the meanings of the eec elements is crucial. Therefore, after analyzing the most representative works, we present the following findings.
The experimental design and the choice of the work (in-situ / ex-situ mode) will depend on the research objectives.
Even though it is not commonly reported, the system should be validated with the Kramers Kronig relations before analyzing the data by fitting it to an eec.
The solution resistance R1 estimated in-situ reveals metabolic activity and permits biofilm monitoring by EIS. In addition, the estimation of R1 reveals resistant contribution between electrodes and must be considered when a biofilm development is modeled.
The choice of electrode material can influence biofilm capacitance. Moreover, the performance of EIS in adequate supporting electrolytes guarantees a better capacitance estimation.
The change in the capacitance depends on the type of bacteria; the EPS produced if an applied potential is used or not, and, in general, the experimental conditions performed.
The electrochemical behavior depends on whether the biofilm can transfer electrons, acting as strong, weak, or non-electroactive biofilm; in addition, it depends on the electrochemical experimentation conditions (OCP or applied potential).
Changes in R2 related to non-electroactive or weak electroactive biofilms result from microbial fouling, attachment, biofilm growth, and biofilm resistance.
The applied potential and acetate consumption affect the charge transfer resistance of G. sulfurreducens.
The frequency range for capacitance detection is the same as when dealing with strong, weak, or non-electroactive biofilms (101-102 Hz).
It is necessary to analyze the EPS to detect changes in composition to gain a deeper understanding of the eec elements.
The most crucial challenge of using EIS and eec analysis is knowing the physical meaning of each electric element. However, as the circuit becomes more complex, several interfacial phenomena can affect the parameters simultaneously and in different magnitudes. However, the findings discussed in this review could deepen the understanding of interfacial processes to improve the design of sensing biofilm devices or bioelectrochemical systems. Finally, this overview pretends to contribute to the current knowledge and develop a general perspective to plan future research.

