


 nueva página del texto (beta)
 Inglés (pdf)
 Artículo en XML
 Referencias del artículo
 Enviar artículo por email
 Citado por SciELO
  Similares en
SciELO
Similares en
SciELO 
 Permalink
Introduction
Batteries have been part of our lives for many years. Their applications are exploited in a wide range of aspects, from their use in toys to electric vehicles. Over time, batteries have been manufactured and modified in order to improve their performance. Currently, lithium -ion batteries are most frequently used due to their high energy density, high energy efficiency, and extended life time [1].
Lithium ion batteries commonly use graphite as the anode material, mainly because it+ is a low cost and low operating voltage material. Its lamellar crystalline structure allows it to accommodate ions between its layers. Despite this, current applications demanding more energy make graphite's charge storage capacity (370 mAh/g) insufficient, prompting the search for a candidate with better capabilities to replace it [2].
Silicon (Si) is one of the best candidates to replace graphite as anode material in terms of capacity, due to its high gravimetric nominal capacity of 4,200 mAh/g, more than ten times the standard capacity of graphite anodes. This means that silicon anodes grant energy for more than 10 times longer, or weigh 10 times less [3]. This capacity is also the highest among anode materials for Li storage (higher than the one of any material making alloys with lithium, like Ge, Sn, Sb). However, the extraordinary higher storage capacities come together with about 300% volume expansion, which may cause pulverization of the electrode and capacity fade For this reason, it is commonly microstructured, to allocate volume changes when lithiated/delithiated [5]. Even though, efforts have been made in order to make Si powders work as battery anodes, with no additional microstructuring. Much of the good performance could come from a proper initial charging/discharging, allowing for even faster Li incorporation after some cycles [6]. This is an indication that micron-sized Si powders could work for batteries. Nevertheless, the powders commonly tested are of electronic grade Si. The level of impurities is below 1 ppm (one part per million). The material is just doped with a certain desired impurity in a controlled dose depending on the application.
Regarding to metallurgical grade silicon, it is silicon with a purity order of 98-99 % with a significant contamination of metals such as Fe, Al, C, B, etc. Despite the presence of these impurities, it is possible that it could be used as an anode in lithium ion batteries, since even with this condition, it2 is primarily Si. The production of metallurgical grade silicon is achieved by reacting silicon dioxide ( ), the most abundant mineral in the earth's crust, with wood or coal in an electric arc furnace at 1500-2000 °C. Thus, the silica in silicon dioxide is reduced (oxygen is removed) generating metallurgical grade silicon. It is widely used in the metallurgical industry, but its largest use is in the automotive industry, accounting for 55 % of all metallurgical silicon used industrially [7]. One could buy it as powder of micro-size particles. However, the presence of impurities mentioned above could interfere with the performance of a lithium ion battery. For example, the presence of Fe forming alloys with silicon presents lower capacities than pure silicon, partially due to the high resistivity of the alloy that makes it difficult to separate the alloy into components to form new alloys with Li [8] Currently, there are just few reports where metallurgical grade silicon has been used as active material in a lithium ion battery. On the other hand, there are no works where the influence of impurities on the performance of a LIB had been studied or reported. In particular, it is not known whether the presence of impurities in a higher concentration in metallurgical grade silicon, affects either positively or negatively on the performance of a battery.
Experimental
For the present work, powders of four different samples of commercial metallurgical grade silicon were used. The average particle size is about 2 microns in all the cases. The amount of impurities in ppmw (parts per million by weight), present in each sample, given by the provider, are shown in Table 1. Particularly, one can notice that in the most of the samples, the most abundant impurity is Fe, except for sample 1. In this last sample, the content of Fe is two orders of magnitude lower. Then there are two samples doped as commonly for electronic grade Si, besides all other impurities. Sample 3 is doped as n-type with P, and sample 4 is doped as p-type with Al and B. Samples 1 and 2 are not doped with B nor P.
Table 1 Impurity content in metallurgical grade silicon samples.
| Chemical Analysis in ppmw | Purity | ||||||||||||
| Al | Ca | Fe | Ti | P | B | Cu | Cr | K | V | Ni | Na | ||
| Sample 1 | 19.8 | 30 | 19.2 | 0.9 | 0.1 | - | 0.2 | 2.2 | 0.1 | 0.1 | 1.4 | 5.9 | 99.99% |
| Sample 2 | 455.1 | 78.7 | 3344 | 39 | 16.2 | - | 11.8 | 48.7 | 8.9 | 4.6 | 13.7 | 10.3 | 99.5% |
| Sample 3 | 19.5 | 18.5 | 3138 | 6 | 989 | 4.2 | 7.7 | 37.3 | 10 | 0.1 | 9.2 | 21.7 | 99.5% |
| Sample 4 | 346.6 | 105.4 | 1921 | 21.8 | 18.9 | 1607 | 4.1 | 16.6 | 12.6 | 0.9 | 4.1 | 12.1 | 99.5% |
Electrode preparation
Electrodes were made from a paste consisting of three components: 30 % of active material (metallurgical grade silicon samples), 60 % of conductive additive (carbon black) and 10 % of binder (carboxymethylcellulose - CMC). The proportion between components is not to maximize the weight of active material (and in that way the total capacity), but to maximize the interconnectivity of the particles of active material through carbon black to evidence the specific capacity of them and their cycling performance. The materials were integrated with deionized water to form a paste, which was casted on Cu current collectors afterwards to form the electrodes. Finally, the electrodes were subjected to a drying process in an oven under air at 80 °C.
Assembly of half-cell batteries
The batteries were assembled in Swagelok type battery cases. The silicon electrodes served as working electrode, a lithium foil was used as counter electrode, the separator was a Whatman glass microfiber filter, and the electrolyte was a 1 M LiPF6 solution in propylene carbonate. The assembly was carried out inside a glove box in an Ar atmosphere.
Results and discussion
Fig. 1 shows the specific capacity vs. number of cycles curves of the batteries assembled with the different metallurgical grade silicon electrodes. The batteries prepared with samples 1 and 3 show the largest lithiation capacity values, close to the nominal capacity of Si (4,200 mAh/g). Whereas, in batteries 2 and 4, their maximum lithiation capacity barely exceeded 2,500 mAh/g. In cycle 2, samples 1 and 2 have abrupt reductions in capacity, while batteries 3 and 4 present practically equal lithiation values in cycles 1 and 2, and then all of them start a progressive reduction in values. In the four cases, approximately in the first ten cycles, is where the greatest reductions in the capacity occur, reducing to approximately a quarter of the maximum capacity obtained. Regarding delithiation curves, the four samples present gains in capacity after cycle 1. In batteries 1, 2 and 3, this increase is only present in cycle 2 and in battery 4 the increase remains also in cycle 3; later, in all the cases, a progressive decrease begins. Battery 1 had the highest initial delithiation capacity, while battery 4 presented the lowest one. The abrupt and larger increases occurred in batteries 3 and 4, which increased more than 3 times their initial delithiation capacity. After this, the batteries start to suffer delithiation capacity fade. The battery that presented the highest average capacity from cycle 20 to cycle 50 was battery 3, with a value of 482 mAh/g, followed by battery 1 (351 mAh/g), battery 4 (292 mAh/g) and finally battery 2 (283 mAh/g). In all the cases the capacity loss per cycle stabilizes approximately by cycle 20.
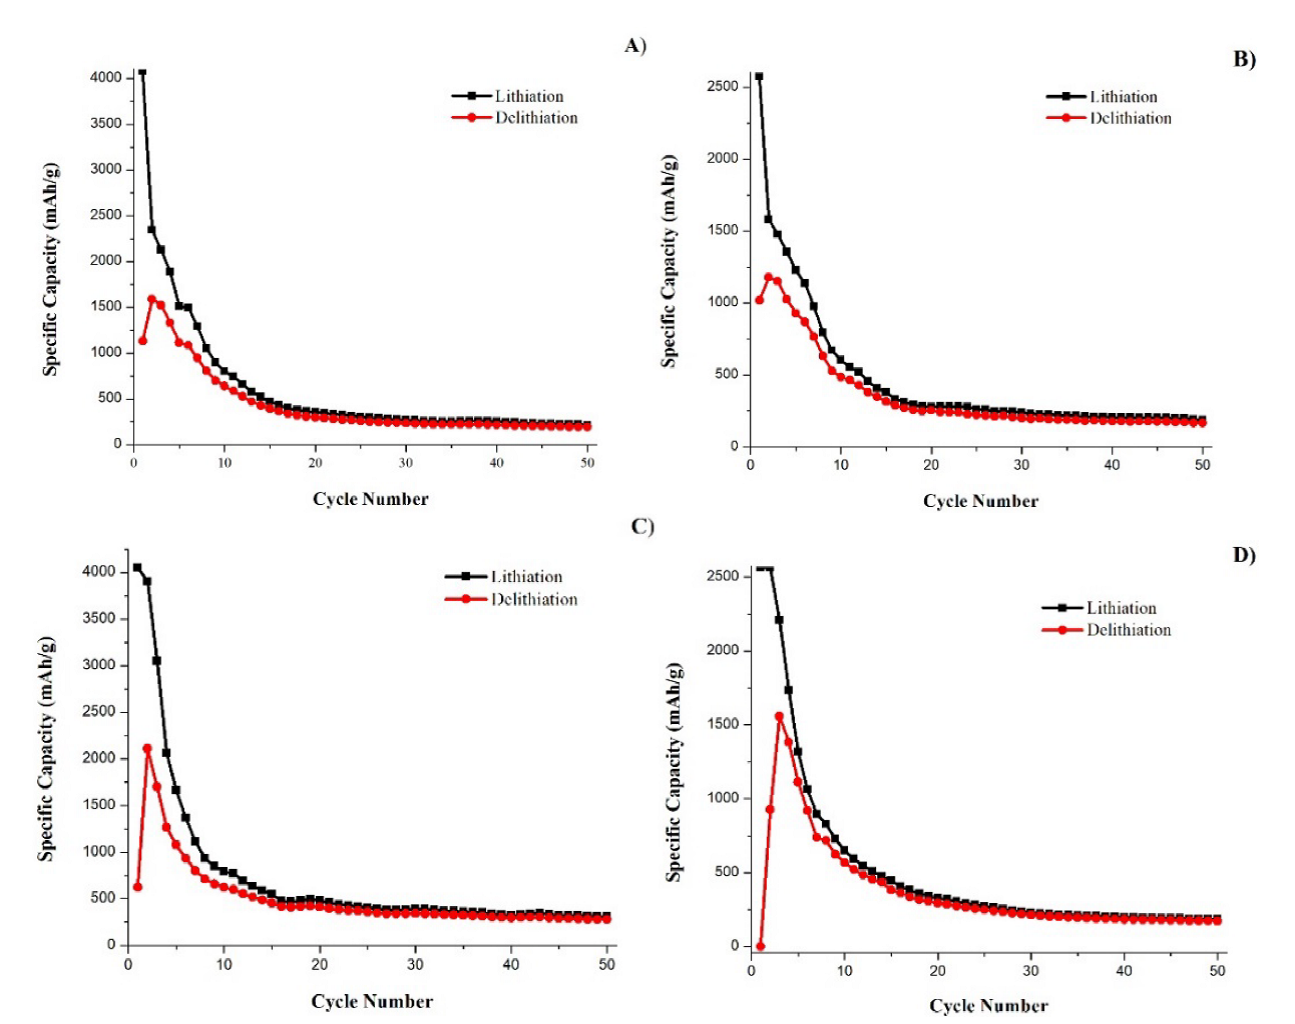
Fig. 1 Capacity vs cycle number curves of batteries with electrodes of different metallurgical grade silicon samples. (A) Sample 1, (B) sample 2, (C) sample 3, (C) sample 4.
The visualization of the trend of capacity loss of each battery is shown in Fig.2. The percentage of capacity loss was calculated in relation to the maximum lithiation capacity of each battery. The dots in the figure indicate the capacity loss at each cycle, while the continuous line indicates the trend (obtained smoothing the curve). Battery 3 was the one that reached the highest capacity loss at certain cycle, higher than 20 %, while battery 2 presented the minimum capacity loss (12 %). It can also be observed that the points in batteries 1 and 2 are more dispersed in the first cycles since in these cases there were notable increases and decreases between each cycle. The trend curves show that batteries 3 and 4 were more stable as they obtained losses that progressively reduced with the passing of the cycles. In all four cases, the trend line in the curves becomes more linear and stable from cycle 20 onwards, indicating that there are no large differences between cycles and varying minimally in values close to zero. The percentage of capacity loss per cycle after cycle 20 was in average, from worst to best, 0.64 % (battery 4), 0.53 % (battery 2), 0.51 % (battery 1) and finally 42 % (battery 3).
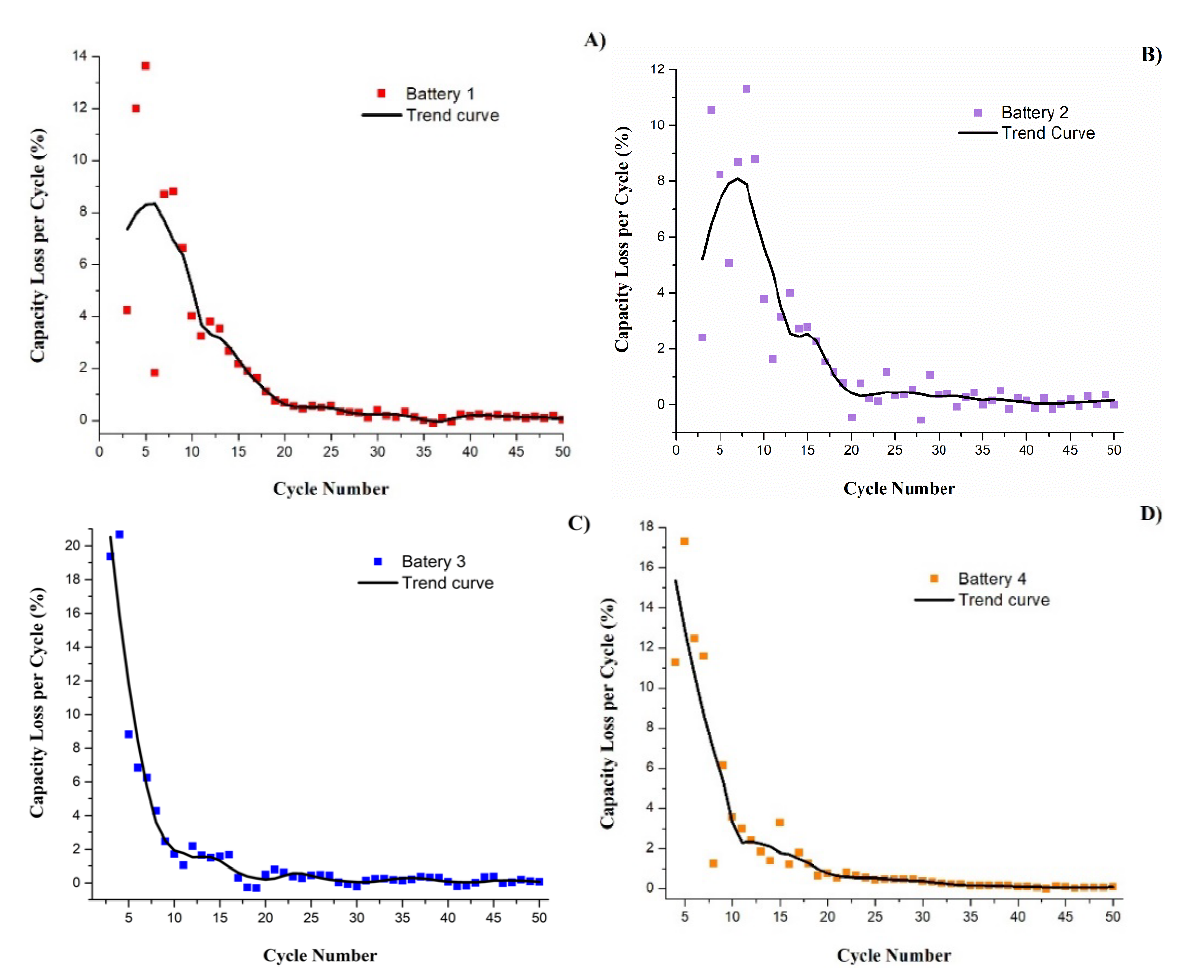
Fig. 2 Capacity loss vs cycle number curves of batteries with different metallurgical grade silicon electrodes. Sample 1, (B) sample 2, (C) sample 3, (C) sample 4.
The percentage of charges that were effectively "stored" into the battery can be determined by the coulombic efficiency (CE), which is ratio of delithiation capacity versus lithiation capacity. This can be calculated for each cycle. Fig. 3 shows that the four batteries show the lowest CE in the first cycle. Battery 4 exhibits the lowest one (about 0 %), while battery 2 exhibits the highest one (40 %). Subsequently, in cycle 2, the four batteries had abrupt increases in CE, although with different magnitudes. Battery 4 was the one that shows the most constant CE values, being able to stabilize earlier than the others: from cycle 10 onwards the values do not show considerable variations. On the other hand, battery 2 shows notable variations in most of the cycles, and in battery 1 the CE values have a continuous increasing behaviour; in certain specific cycles the efficiency decreases, but in a very small proportion. Battery 3 shows a similar behaviour to battery 1, with the difference that the maximum CE values are obtained in cycles 39-41 and then the efficiency decreases a little for a couple of cycles and then continues with a progressive increase. The four batteries present relatively high CE in most of the cycles, being battery 2 and 4 the ones that obtained the highest values of about 85% and 88% respectively.
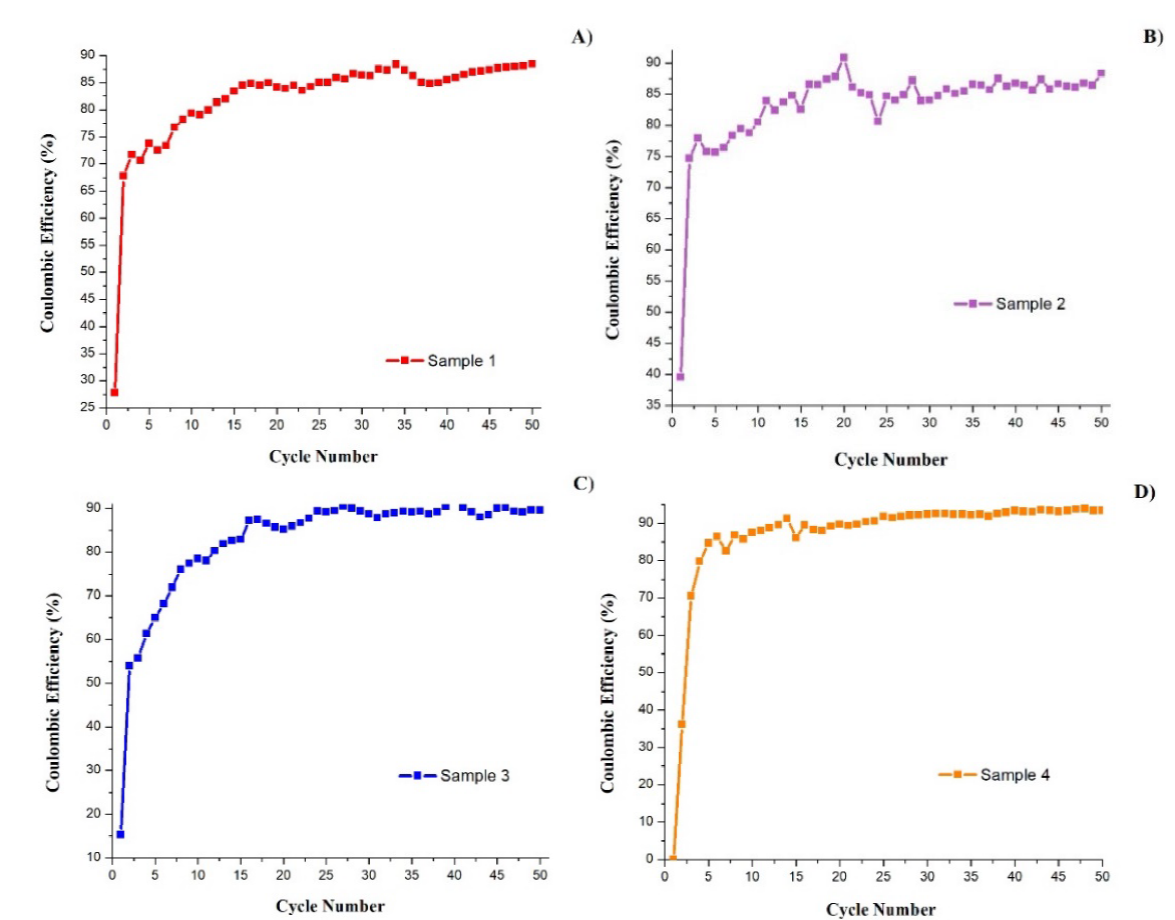
Fig. 3 Coulombic efficiency vs cycle number curves of batteries with electrodes of different metallurgical grade Si: (A) sample 1, (B) sample 2, (C) sample 3, (D) sample 4.
Comparative analysis
Using data in Table 1, we can establish comparisons between the samples. Batteries 1 and 2 correspond to the metallurgical grade silicon samples with a low and high Fe concentration, respectively. On the other hand, it is possible to compare batteries 3 and 4 to analyze the differences that may occur in the behaviour of batteries when doped with n-type impurities (battery 3, P) and p-type impurities (battery 4, Al and B).
Batteries 1 and 2
Fig. 4 shows a comparison of the lithiation and delithiation capacity curves of these two samples. The curves have similar behaviour but in different magnitudes. It is evident that, the sample with low Fe content obtained the highest maximum capacities in cycle 1, with an advantage of approximately 1,500 mAh/g in lithiation with reference to sample 2 and 500 mAh/g in delithiation. Both samples presented the highest reduction of lithiation capacity in cycle 2, while in in cycle 2 of delithiation, both batteries show an increase. Battery 1 manages to increase almost half of its initial delithiation capacity, while battery 2 only increased the equivalent of 15 % of its initial capacity.
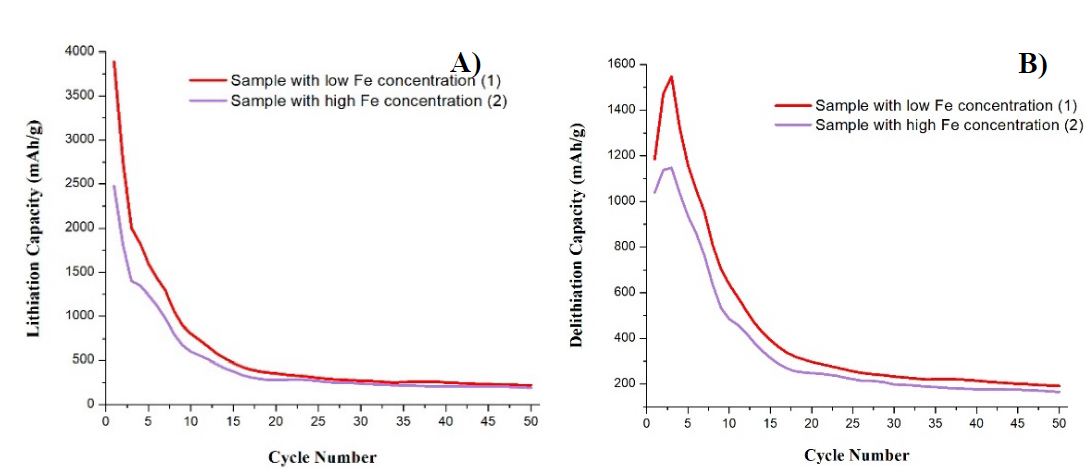
Fig. 4 Comparison of curves of capacity vs number of cycles for (A) lithiation and (B) delithiation, of samples 1 and 2.
Battery 1 reduced the lithiation capacity by 57 % and battery two reduced 61 % with respect to the maximum capacity. Approximately from cycle 20, both samples manage to stabilize their capacity values, making the curves now take a linear behaviour. Battery 1 always presented higher capacity values, both lithiation and delithiation, with a trend of 351 mAh/g and 296 mAh/g respectively. While the trend of capacity values for battery 2 was 283 mAh/g of lithiation and 242 mAh/g of delithiation.
Fig. 5 shows the comparison of the capacity loss curves per cycle of the batteries that used electrodes with active material with a high and low Fe concentration. The capacity loss curve shows in the first cycles negative values since there was an increase of capacity. The battery with electrode with low Fe content obtained higher capacity gain and it was also the one that reached the highest maximum point of loss. Although the difference is not very big, later this value decreases and begins to take values close to those of the battery with electrode with high Fe content. Approximately by cycle 9, now the battery 2 is the one that has higher values, and later the values of loss are very similar in both batteries. From cycle 20 onwards, it can be observed that the battery reach a stability in the values. Zooming in these cycles (see inset), it can be observed that both batteries maintained values very close to 0 %. It can be noticed that battery 2 maintained mostly higher values of capacity loss than battery 1, the tendency of these values for battery 1 was 0.53 % while in battery 1. The tendency was 0.51 %, while so it can be said that the battery with an electrode with low Fe concentration was the one that presented lower capacity loss, but minimally.
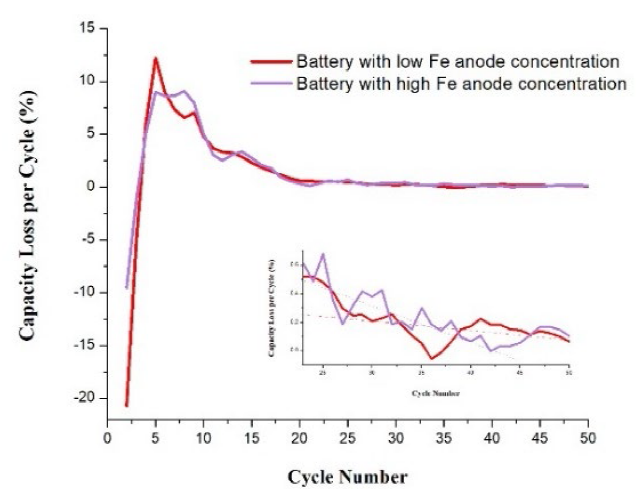
Fig. 6 shows that the sample with low Fe concentration was the one that obtained a lower initial CE: battery 2 was better, since it showed a CE of 38 % while it is of 27 % for battery 1. In almost all the first half of the 50 cycles, the sample with low Fe content had a lower coulombic efficiency than sample 2. In the second half of the galvanostatic cycling, battery 1 now presents higher values than battery 2, but the difference in most of the cycles in this range is not so remarkable. Battery 2 was the one that exhibited the best efficiency overall (90 %) in contrast to battery 1 (85 %).

In summary, a lower Fe content allows a higher capacity, however, a higher Fe content helps in the capacity stability. Fe may segregate during lithiation, producing Si-Fe alloys, which are relatively “inactive” [8] Fe content is in the range of doping; thus Si-Fe alloys could just be produced by segregation. However, the presence of these alloys improves the mechanical stability of the silicon anodes [8], which suffer a volume change of up to 300 %, to form Li-Si alloys.
Batteries 3 and 4
Fig. 7(A) shows the lithiation capacity curves, battery 3 (n-type) was the one that obtain the highest capacity with more than 4,000 mAh/g, while the battery 4 (p -type) obtained approximately 2,5000 mAh/g as maximum. Subsequently, both batteries progressively reduce their lithiation capacity, in both cases the largest capacity reductions occur in the first 8 cycles reaching values below 1,000 mAh/g. From cycle 15 onwards, the capacity values in both cases start to be more stable and without considerable changes from one cycle to another. The capacity values in most of the cycles had a trend of 482 mAh/g in battery 3, while battery 4 trend in 292 mAh/g in most of the cycles. Regarding to delithiation capacity curves (B), the difference between both batteries was approximately 500 mAh/g; the number 3 exceeded 2,000 mAh/g in cycle 2, while battery 4 was just over 1,500 mAh/g in cycle 3. From cycle 1, battery 3 showed a value greater than 500 mAh/g, while battery 4 showed zero delithiation capacity in cycle 1. Up to approximately cycle 15, the capacity values began to stabilize. Battery 3 always showed higher values than battery 4. For battery 3 the lithiation capacity values had a trend of 417 mAh/g, while in battery 4 the trend was 264 mAh/g in most of the cycles.
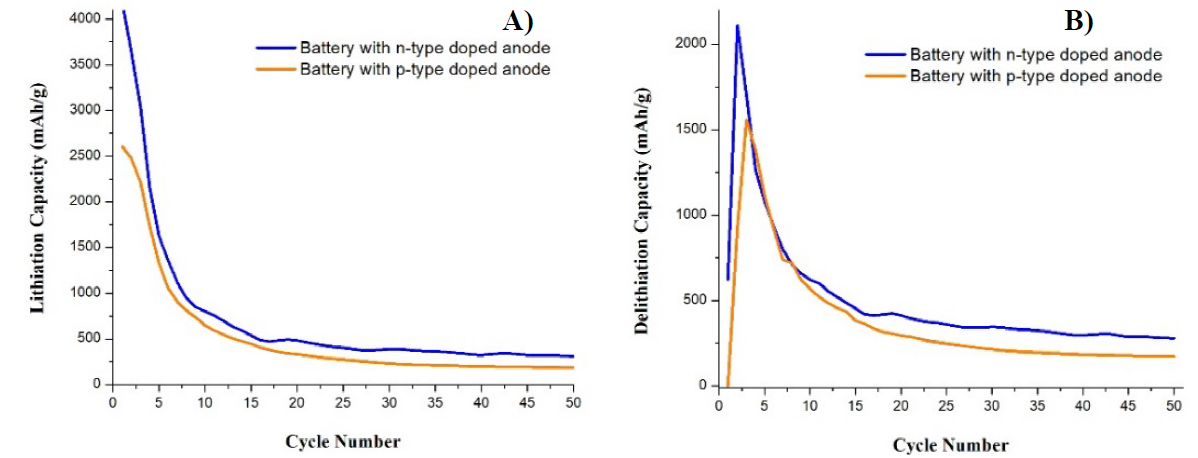
Fig. 7 Comparison of curves of capacity vs number of cycles for (A) lithiation and (B) delithiation, of samples 3 (n-type) and 4 (p-type).
The capacity loss curves in Fig. 8 shows in the negative values that battery 4 obtained a higher capacity gain by a small difference than battery 3, then the positive values show peaks of maximum capacity loss. Battery 3 obtained the highest value, greater than 20%, while battery 4 was approximately 18 %. The values of capacity loss in both cases began to decrease from cycle 4, but it was battery 4 that obtained the largest values in a range from cycle 4 to 20. Later, stability can be noted in both cases and with very similar values (see inset of Fig. 8). Battery 4 showed more stable values of loss since its curve showed a behavior without as many alterations in the values as curve 3. In spite of this, battery 4 in most of the cycles presented higher values of capacity loss (0.64 %) than for battery 3 (0.42 %).
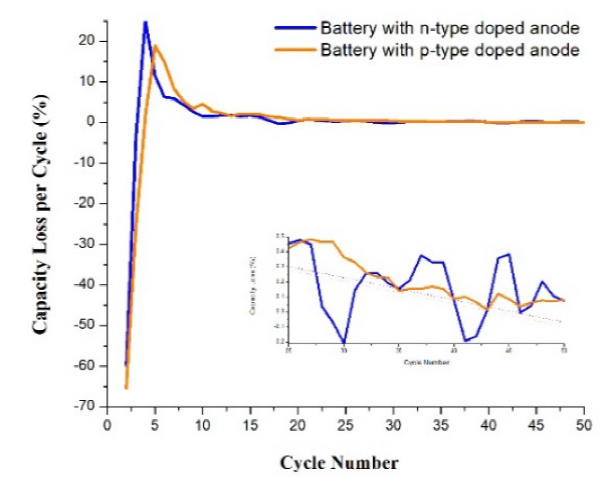
Fig. 9 shows that battery 4 always maintained a higher CE in most of the cycles. A remarkable aspect in these curves is that in the case of battery 3, from cycle 1 it showed an efficiency value close to 20 % and continued with a progressive increase, but battery 4 had a CE of zero in cycle 1. The CE of battery 3 also increased progressively (in a slower pace), but it oscillated from cycle to cycle. The CE values of battery 4 had a trend of 90 % and the highest efficiency value was 93.7. The battery 3 in most of its cycles showed a CE trend equal to 83 %, with a maximum value of 91.8 %.
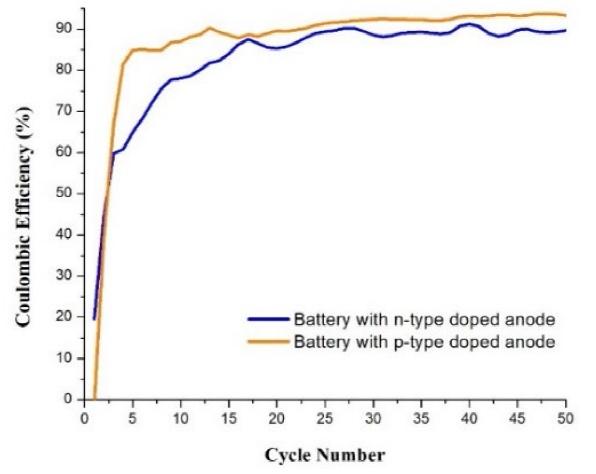
Doping with P allowed higher capacities. The voltage limits for the galvanostatic cycling were reached in longer times. This could mean that the conductivity of the Si electrode is better (it presents lower ohmic drop). This effect has been observed when increasing the cross section of the Si particles or minimizing their length [9], or when conductive pathways have been created in them (e.g., when they are decorated with metallic nanoparticles) [10]. However, using group 3 elements (B, Al) allows having higher CE, indicating that secondary non-reversible reactions are less in this case.
Conclusions
Galvanostatic cycling tests of half battery cells with metallurgical grade silicon working electrode revealed that using an n-type metallurgical grade silicon sample provides the highest specific capacity values. Compared with the non-doped samples, the boron and phosphor doped samples present the lowest coulombic efficiencies during the first cycles, but then they present the highest ones afterwards, together with the highest capacities. However, in general, all metallurgical grade silicon electrodes show a trend to maintain the capacity at values above 200 mAh/g (and above 400 mAh/g in the best case). The results indicate that metallurgical grade silicon can be an economical alternative of active material of battery electrodes with competitive specific capacities, despite the presence of high amount of impurities. It is also worthy to mention that the Si particles used for the present study are micron-sized, but it is desirable to have them in lower dimensions to avoid cracking while lithiated/delithiated. Then the results could be greatly improved if Si is milled into smaller particles before preparing the electrodes.

