


 texto en
  Inglés (pdf)
 Artículo en XML
 Referencias del artículo
 Enviar artículo por email
 Citado por SciELO
  Similares en
SciELO
Similares en
SciELO 
 Permalink
1. Introduction
Reinforced concrete is one of the most used materials in the construction industry in the vast majority of civil works and has been transformed into one of the most resistant structures due to its mechanical properties. Numerous investigations have studied the durability of reinforced concrete structures because it requires high technology for its conservation and maintenance needs (Vidaud and Vidaud, 2012). Corrosion of reinforcing steel is one of the main causes of durability of concrete. This phenomenon is affected by the type of environment to which it is exposed to and then damaging the structure over time. Necessarily, the concrete paste gives steel a dual nature protection to embedded steel; first it acts as a physical barrier that isolates it from the environment, and second the liquid enclosed in the pores of the concrete is an electrolyte that passivates it permanently (Gonzáles and Jimmy, 2003). These properties are affected, so using new materials in concrete paste is important to improve its physical properties and extend the durability of concrete structures.
Currently, the use of cement-based compounds with carbon particles and other additions, are new composite materials with some excellent physical and chemical properties that make them suitable for use in technologically advanced products (Chung, 2000). The main carbon materials added to concrete include carbon fibers, graphite flakes, graphite powder or carbon nanotubes, this research being directed to the use of graphite powder. Graphite is an allotropic form of the carbon element, consisting of sheets of carbon atoms (graphenes) that form a flat condensed ring system. There are two possible ways of stacking them: the hexagonal Bernal (ABAB) and the rhombohedral (ABCABC) types; the structure called “simple hexagonal” (Tascón, 2007).
(Heymsfield et. al., 2013) have incorporated this element into the concrete paste and reported that the absorption of graphite powder decreased as the size of the graphite powder aggregate increased, in consequence, the mechanical resistance of the mix design increased as the size of the graphite powder aggregate increased. Also, indicates that the graphite content could improve mostly thermal conductivity properties and reduce the specific heat capacity (Wu et. al., 2014).
(Yuan et. al., 2012) studied ground expanded graphite (G) with high temperature and reported that compressive strength decreases with the addition of graphite and increasing w/c ratio, while, thermal conductivity and the volume of heat capacity increases with the addition of graphite. On the electrochemical properties tests it shows that a decrease in the level of corrosion occurs when the carbon material addition ratio is increased (Garcés et. al, 2007).
(Ha et. al., 2005) investigated the corrosion of reinforcing steel embedded in ordinary Portland cement and reported severe corrosion when the level of carbon and fly ash increased. The condition of wetting and drying with sodium chloride NaCl 3% was found between 6% and 8% of carbon mixed with fly ash.
This research topic presents a study on the corrosion behavior of reinforced concrete, with addition of graphite powder (GP) as a partial substitute for the weight of cement and analysis on its physicochemical properties.
2. Experimental procedure
2.1 Preparation of test pieces
The concrete mixes were prepared using the ACI design method (ACI. 211.1-91, 2002), a theoretical design resistance of 250 kg/cm2 after 28 days of curing period and a concrete slump of 12 ± 2 cm; using Portland cement CPC 30 R (ASTM C-150, 2020); as fine aggregate river sand was used with a maximum nominal size of 4.75 mm and coarse aggregate of crushed stone maximum size of 19 mm. Conventional corrugated 1018 reinforcing steel was used and abraded paper was used for pre-cleaning. Graphite powder (GP) was added in the following percentages: 0% (sample control), 2.5%, 7.5% and 15% regarding the weight of the cement. Table 1 shows the main characteristics of the GP.
Table 1 Characteristics of the GP used.
| Material | Diameter (µm) | Density (g/cm3) | Humidity (%) | Hardness (Mohs) |
|---|---|---|---|---|
| GP | 63 | 2.22 | 2.5 | 1-2 |
The dosage of the materials used in this work is mentioned in Table 2. The weight of the fine and coarse aggregates was not modified, also no additive was used in the concrete mix. More water was added to samples M3 and M4 with a graphite quantity of 7.5% and 15% by weight of cement, because the paste was not very workable, and this maintained the concrete slump range of 12 ± 2 cm for the 4 mix designs.
Table 2 Mix design ratio for 1 m3.
| Material | M1-0% | M2-2.5% | M3-7.5% | M4-15% |
|---|---|---|---|---|
| Cement (Kg) | 366 | 357 | 339 | 311 |
| Water (l) | 218 | 218 | 235 | 251 |
| w/c | 0.59 | 0.61 | 0.69 | 0.81 |
| Sand (Kg) | 817 | 817 | 817 | 817 |
| Gravel (Kg) | 903 | 903 | 903 | 903 |
| GP (Kg) | 000 | 009 | 027 | 055 |
The preparation of concrete samples was done according to (ASTM C-31, 2019). For electrochemical tests 3 cubic specimens 10 cm per side were made from the same mix design, as shown in Figure 1. Three corrugated rods were embedded in each cubic specimen, of dimensions 0.95 mm in diameter. The length of the embedded rod was 5.5 cm. At the interface between the paste and the atmospheric environment, the rod was covered with approximately 5 cm long with teflon tape around the rod.

Specimens were cured for 28 days, in adequate humidity conditions. Electrochemical measurements started 24 hours after the cubic specimens were immersed in a 3% saline solution of sodium chloride, for 168 days of exposure.
2.1.1 Determination of the porosity of concrete
Measurement of air content was performed by the pressure method and type B pressure meter container according to (ASTM C-231, 2017). The porosity of concrete (P) or total voids in the composite material was modeled (1) as a function of: the water/cement ratio, the degree of hydration of the cement (h), the volume of trapped air (A), the amounts of fine aggregates (sand, Af) and coarse aggregate (gravel, Ag), and cement (c) and the specific gravities of the aggregates (ρf y ρg). The value of 0.7 for cement hydration was applied in this study (Solís-Carcaño y Moreno, 2006).
2.2 Compressive strenght technique
The compressive strength test, was performed according to the parameters of (ASTM C-39, 2020) standard. Cylindrical samples with standard dimensions were built with 15 cm in diameter and 30 cm high. The compression test was carried out at 7, 14 and 28 days of curing, to observe the increase in resistance upon reaching maximum value for the curing time. Cylinder uniformity was performed with neoprene plates and a constant load was applied until the sample failed.
2.3 Electrochemical techniques
2.3.1 Half cell potential measurement
Standard (ASTM C-876-09, 2009), sets intervals on corrosion potential (Ecorr) that indicate the probability in corrosion of the surface and the possible risk for the rebar. With the obtained values it is feasible to make a diagnosis of the degree of corrosion of the rebar embedded in concrete. Half cell potential measurement analysis was performed based on the use of saturated silver/ silver chloride reference electrode (Ag/AgCl). The potential measurement of each steel bar embedded in the concrete was determined, the recorded value is the average of these three measurements. Measurements were made over 168 days of salt solution exposure. A multimeter and a switch that connected the two electrodes were used, between the silver/silver chloride and steel bar.
Table 3 presents the conversion of the corrosion half-cell potentials used to the saturated copper / copper sulfate reference electrode by adding +50 mV (Berkeley et. al., 1990; Chess et. al., 1998).
Table 3 Criteria for measuring the risk of damage to concrete reinforcing steel, measuring the half-cell potential.
| Ecorr vs Cu/CuSO4 (mV) | Ecorr vs Ag/AgCl (mV) | Risk of harm (%) |
|---|---|---|
| > -200 | > -150 | 10% probability of corrosion |
| Between -200 A -350 | Between -150 A -300 | Uncertainty Zone |
| < -350 | < -300 | 90% probability of corrosion |
2.3.2 Electrochemical noise technique
Corrosion is considered as a process in equilibrium and with constant kinetics, while, in the case of electrochemical noise, imbalances in electrochemical reactions are recorded in very short time intervals (Goellner et. al., 2004). For the electrochemical noise measurements, it was used a Gill AC-ACM Instruments, 1024 reading samples were taken with a constant interval of 1 point/second. The configuration for measurement was three nominal identical steel rods, whereas the third electrode nominally identical to the two working electrodes acts as a reference electrode (Sánchez-Amaya et. al., 2009; Blanco et. al., 2019).
Electrochemical noise can be characterized by common statistical parameters such as the mean, the variance and the standard deviation; in particular the use of the potential/current standard deviations can be done separately, either by its quotient. Called noise resistance (Rn), in the expression (2) it is calculated as the quotient between the standard deviations of the potential over current records (Sánchez et. al., 2005; Bertocci et. al., 1997).
In addition to what was mentioned above, another statistical value is used for the analysis of current noise, according to the equation (3) being the ratio of the standard deviation to the root mean square, called “localization index or pitting” (L.I ó I.P), (Sánchez et. al., 2005).
Table 4 shows the range of localization index values representing the type of corrosion in the reinforcing steel.
Table 4 Locazation index values.
| Location index | Corrosion type |
|---|---|
| 0.001 – 0.01 | Generalized |
| 0.01 – 0.1 | Mixed |
| 0.1 – 1 | Localised |
| > 1 | Start of pitting |
According to the ranges of values (Rincón and DURAR et. al., 1997), the service life of reinforced concrete can be determined from the current density (icorr), with the data established in Table 5.
2.3.3 Linear polarization resistance technique
For the measurement of resistance of linear polarization using the same Gill AC-ACM Instruments, a small voltage signal was applied between -50 mV and +50 mV around the corrosion potential (ASTM G-59-97, 2014). The linear polarization method, Rp, can be obtained graphically by the expression (4) as the tangent to the polarization curve in Ecorr (Román et. al., 2016).
From the Stern-Geary equation (5), corrosion current density was related icorr, with the Rp, through a constant of proportionality B (Román et. al., 2016). Constant B can acquire the values of 0.026 V to 0.052 V, depending on the type of system analyzed (Sagües, 1991).
3. Results and discussion
3.1 X-ray diffraction characterization
Figure 2 details the GP diffractograms obtained from the XRD techniques, orderly fit polycrystalline solid shown and with a peak intensity with values of 2θ approximately 26 ° and 27°. These values are similar to some reported by authors who describe the characteristic peak of graphite (Yuan et. al., 2012). Two different crystalline forms of carbon are presented: hexagonal (2H) and rhombohedral (3R).
The 2H structure, is the most common form in the phases identified with 39.9% values and the 3R with 27.4% values, with a total addition of 67.3% in carbon content. The sample contains 32.6% of clay components as: quartz, smectic phyllosilicates, kaolinite, mica.
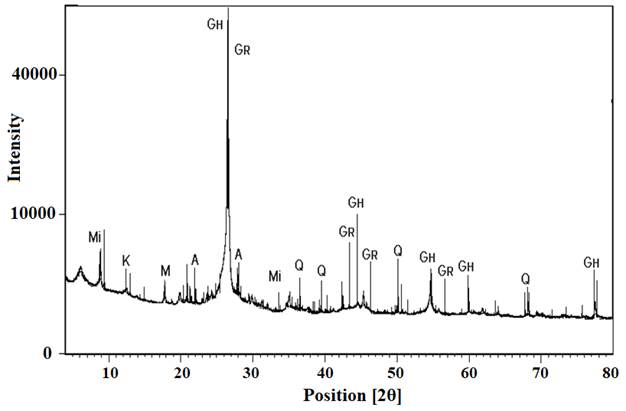
Figure 2 X-ray diffractograms of the GP.Mi: mica; K: kaolinite; M: montmorillonite; GH: graphite (2H); GR: graphite (3R); A: anortite; Q: Quartz.
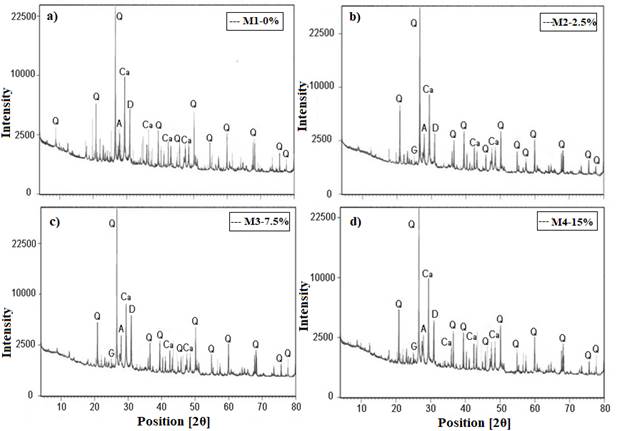
Figure 3 corresponds to the diffractograms of the control sample and with the addition of GP, after 28 days curing period. The 28 day hydrated cement produces the following phases: calcium hydrated silicate (CSH) which is responsible for the adherence and resistance with binders, etringite (E) that gives greater cohesion to cement and portlandite (CH) that maintains alkalinity, that is, the paste pH at high values between 12-13 (Helena and Lucia, 2011; Giraldo and Tobón, 2006).
Figure 3a shows the crystalline phases of hydration of concrete: high peaks of quartz (Q) and calcite (Ca) were observed; in addition to dolomite (D) and plagioclase or Andesine (A). The main abundant elements that appear in the control sample are Q y Ca, due to the main presence of limestone in the cement.
Figure 3 b), c) and d) show the samples with different percentage of graphite, as it can be seen a peak intensity that does not increase with increasing GP, which shows that there is an absence of direct participation in the hydration of the concrete paste. It is observed that the XRD analysis does not show a strong intensity in the CH and CSH peaks; various authors indicate that peaks with values of 2θ approximately 29 ° can be assigned to the CSH phase, and peaks with 2θ values approximately 18 ° and 34 ° can be assigned to CH (Giraldo and Tobón, 2006; Becerra, 2014). The absence of portlandite in the diffractogram may be due to the fact that the sample comes from the cylinder surface, where carbonation effects can obscure identification (Vetter et. al., 2019).
3.2 Scanning electron microscope characterization
The SEM micrographs of the concrete are presented in Figure 4, the visual analysis of Figure 4a belongs to the control sample M1, microcracks (m) can be seen in the paste matrix, as a result of the compressive resistance and sample extraction technique. Together calcium silicates hydrated were observed (CSH), and greater presence of portlandite (CH) and etringite (S). For the visual analysis of the S crystals they are elongated shapes, generally in fibrous habitats or in the form of long rods. CH normally occurs as thin hexagonal platelets, often tenths of a micrometer wide (Vetter et. al., 2019).
Figure 4b corresponds to the micrograph of sample M3 with 7.5% GP, a compact structure with greater CSH formation is visualized, filling the empty areas of the cement matrix, reducing the porosity of the concrete and improving the adhesion on the carbon particle (GP).

3.3 Concrete porosity
Table 6 shows the percentage values of concrete porosity. As it can be seen, by adding graphite content in 2.5% by weight of cement, the mixture acquires a higher water absorption and affects the water/cement ratio compared to the control sample. Sample M1 has a porosity percentage of 22% with w/c ratio of 0.59, the results show that in the M2 design with 2.5% GP the porosity of the concrete decreases with respect to the sample M1; the samples M3 and M4 register a greater increase in the w/c ratio due to the increase in the amount of water added with values of 0.61 and 0.81.
In terms of concrete durability, an increase in the porosity of the paste, causes environmental agents to require the material to be permeable in order to penetrate through the mass of the material; these agents are also added for their internal transport by diffusion (Solís-Carcaño and Moreno, 2006).
3.4 Compressive resistance
Table 7 shows the average values of compressive resistance (F´c) after 7, 14 and 28 days of curing. The control sample M1-0, was designed for a theoretical resistance of 250 kg/cm2, during the 28 days of curing. It acquired an average maximum experimental resistance of 258 kg/cm2, exceeding the theoretical design value. Sample M2 with 2.5% GP, an increase in compressive resistance is observed at early ages of 7 days with a value of 242 kg/cm2. During the 28 days of curing the compressive resistance increased by 4.6% compared to the strength of the control sample. Sample M3 with 7.5% GP, during the days of curing a constant increase of f´c is observed reaching a final resistance to compression of 267 kg/cm2; sample M4 with 15% GP shows a low f´c with a value of 244 kg/cm2, due to the increased amount of water added.
3.5 Half-cell potential
After 168 days immersed in 3% sodium chloride (NaCl) saline solution, the results of the corrosion potential (Ecorr) are detailed in Figure 5. A decrease in potential was observed in the first days for all samples, acquiring more negative values between -100 mV and -250 mV, estimating a 10 percent probability to uncertainty zone. The concrete resistivity and the oxygen in the pores of the concrete matrix are factors that influence the potential values (Castellote et. al., 2002). GP is a conductive material added to concrete; should involve reducing electrical resistivity and increased transport of the chloride ions, causing non-protective oxide formation in the metal. As there are two conductive materials such as reinforcing steel and GP, indicating that the less noble material will develop a higher level of corrosion. This fact shows why the negative values of the corrosion potential in the GP samples.
Over time, all samples with addition of GP had a more negative decrease in potential values, entering a 90% corrosion probability zone. Between days 84 and 148, constant corrosion potential values can be seen, between -280 mV to -400 mV, indicating the possible formation of dense layers of non-protective oxide on the steel.
All samples at the end of the experiment on day 168 of immersion, are located in the 90% corrosion probability zone, the sample M4 with 15% GP is the one with the most negative potential value of -460 mV due to the factors described above and also an amount of water added.

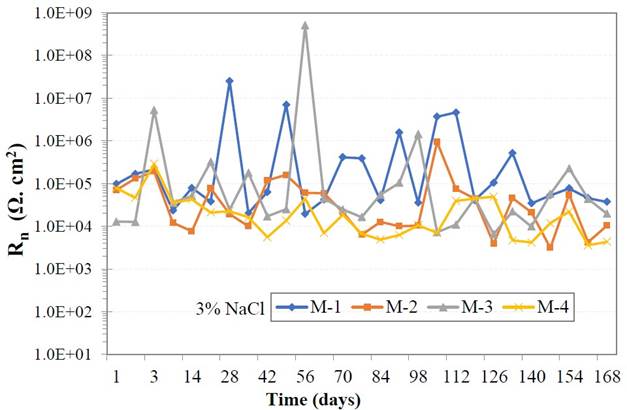
3.6 Electrochemical noise
The average of the resistance oscillations of the electrochemical noise is presented in Figure 6. At the start of the measurement all samples presented low Rn values between 1x10⁴ Ω.cm2 and 1x10⁵ Ω.cm2; during days 28 and 70. Sample M1 and M3 presented high and low fluctuations of Rn, possibly due to the formation of protective oxide films, holding the metal passive. At the end of day 168 of exposure to the saline medium, all samples maintained low noise resistance values around 1x10⁴ Ω.cm2.
The GP addition in concrete paste in different percentage, affects the electrochemical properties of the metal, acquiring very low Rn values, This event can be explained due to the change of oxygen at the steel/concrete interface, as a consequence of the change of the porosity percentage of the paste. Also, the content of GP decreases the resistivity of the concrete; with lower Rn values indicating high corrosion process of the metal over time (Zhao et. al., 2007).
The values of the localization index are shown in Figure 7, at the beginning of the test until the end of the exposure. Localized type events or corrosion may be observed, because there is a high dissolution rate of the metal at discrete places on its surface (Sanz et. al., 1999). This represents a higher potential risk, due to its difficult detectability as it manifests itself in specific areas (Salazar-Jiménez, 2015). If the exposure time is prolonged, the start of pitting can occur in the metal.

The values of the useful life level of reinforced concrete are detailed in Figure 8, where all samples at the time of being immersed in an environment after 24 hours were registered. Very high icorr values can be observed, between 0.1 and 0.5 μA/cm2, presenting a range of corrosion between moderate and very high. This behavior coincides with the negative values of the corrosion potential test. Samples with replacement level of GP respectively present very high icorr values as can be seen and it increases over time, demonstrating very high corrosion on reinforcing steel and in the useful life of concrete.

3.7 Linear polarization resistance
Figure 9 shows the polarization resistance values over time, and very low Rp values can be observed in the 24 hours of immersion and until the end of the measurements in the LPR experiment. During days 42 and 70 there is an increase in the Rp of samples M1 and M2, maybe indicating a decrease in the rate of metal corrosion. Such high Rp values are an indication that the steel is passive (Blanco et. al., 2019). Samples with GP content, acquired constant values between 1x101 Ω.cm2 and 1x10³ Ω.cm2. High interaction with chloride ions can occur at the steel/ concrete interface registering very low Rp values. Chloride ions are shown to have depassivated the metal and the material has high corrosion at certain times as immersion times progress.

4. Conclusions
In the present work and within the scope of this research the following conclusions can be drawn:
In compressive resistance test, the sample M2 with 2.5% GP content, presented a high value in the mechanical properties of concrete with respect to the control sample but the percentage of porosity in the concrete paste decreased; this fact may be due to the absorption of water by the GP particles in the concrete matrix.
In the samples´ addition of 7.5% and 15% GP, higher water content was required increasing the w/c ratio.
In XRD techniques, the GP added to the concrete had no interaction in the process of the crystalline phases of hydration of the concrete.
All the samples immersed in saline medium presented negative corrosion potential with values between -290 mV and -450 mV, entering into a 90% corrosion probability zone.
In the electrochemical measurements of the samples, they presented low Rn and Rp values, between 1x101 Ω.cm2 and 1x10⁴ Ω.cm2, indicating a high corrosion process on the reinforcing steel.
The level of useful life of reinforced concrete with GP additions, showed a high to very high level of corrosion with current density values (Icorr) greater than 1 μA/cm2.
Corrosion type for reinforcing steel bars was in the localized corrosion range, from the first days of immersion and constantly with the advancement of the exposure time to the saline medium, with localization index values between 0.1 and 1.

