


 nueva página del texto (beta)
 Inglés (pdf)
 Artículo en XML
 Referencias del artículo
 Enviar artículo por email
 Citado por SciELO
  Similares en
SciELO
Similares en
SciELO 
 Permalink
Introduction
Throughout the day, wild animals show changes in their behavior and activity (Pipia et al. 2008; Ikeda et al. 2015; Porfirio et al. 2016; Rahman et al. 2018). The patterns of the temporal activity changes indicate important dimensions in the ecological niche and has been known to be directly affected individual fitness (Kronfeld-Schor and Dayan 2003). Questions about how species are able to survive, adapt and persist in their environment can be answered by understanding the key factors that influence the timing of activity (Buchholz 2007; Krop-Benesch et al. 2012). Many factors may affect the activity of animals, including predation (Harmsen et al. 2011; Cozzi et al. 2012), habitat fragmentation (Norris et al. 2010), sex and reproductive status (Kolbe and Squires 2007), human related disturbance (Ikeda et al. 2015), as well as environmental factors such as seasonal changes (McLellan and McLellan 2015), and lunar luminosity (Michalski and Norris 2011; Pratas-Santiago et al. 2017).
As for seasonal changes, there were predictable variations in activity pattern related to the physiological state of the animal, including the reproductive stage, and the environment condition, notably the availability of food resources and climatic conditions (Scheibe et al. 2001). There has been growing evidence that environmental conditions, mainly season, changes activity level of ungulates, and affects spatial behavior as well (Bowyer and Kie 2009; Bourgoin et al. 2011). High ambient temperatures due to seasonal changes, alone or in combination with low wind speed, have been found to lead to heat stress in ungulates inhabiting both temperate and polar environments (Cain III 2006). However, study on how the season influence the activity level on tropical ungulates is still lacking, while understanding that influences is a key to understanding how species survive. The dry season is known to cause phenological changes that lead to natural scarcity of the diversity and availability of food resources for herbivores (Rahman et al. 2017; Contreras-Moreno et al. 2019). The reduction in leaves and stems during the dry season, which is the main diet of white-tailed deer in tropical lowland of Mexico, is a factor that motivates the deer to travel long distances to find food, meet metabolic needs, and increase the fulfillment of energy needs during the breeding season, especially in female deer so that they can sustain the next generation. Furthermore, changing light conditions when certain phases of the moon is also known to cause changes in behavior, especially for nocturnal animals. In most cases, predation risk or prey availability are the two main forces explaining changes in the behavior. The moon phase can affect animals differently, whether they are predators, prey, or both. Lunar phobia and lunar philia, the latter for nocturnal species, are two patterns explaining variations in activity level of many species (Michalski and Norris 2011).
Visually orienting nocturnal predators may benefits from bright moonlight because their prey is easier to detect, known as the visual acuity hypothesis (Traill et al. 2016). This, in turn, would cause prey to adopt a more cryptic behavior through reduction in activity during moonlight. This assertion is supported by observations of white-tailed deer (Odocoileus virginianus) in North Carolina (USA), which individual vigilance was increased during diurnal and moonlit nocturnal hours, presumably to avoid visually hunting coyotes, bobcats or human (Lashley et al. 2014). In line with this, red brocket deer (Mazama americana) in Central Amazon, whose records evenly distributed through the moon cycle, was found to avoid the brighter times of the night regardless of the moon phase. Red brocket deer shifted the temporal distribution of their activities under different moon phases when predators were present (Pratas-Santiago et al.2017). This pattern of behavior can also be found in Baird’s tapir (Tapirus bairdii), which was found to be more active on dark nights in Southern México (Sánchez-Pinzón et al. 2020). Conversely, studies on ungulate that lived in tropical ecosystem such as the mountain tapir (Tapirus pinchaque) in Central Andes (Columbia) showed that night time activity was higher during full moon than during quarter and new moons (Lizcano and Cavalier 2000) or it may not affect the activities of zebra and wildebeest in Kruger National Park, where there was no evidence for increased foraging activity over the full moon for both species (Traill et al. 2016).
Previous studies on activity pattern of Bawean deer (Axis kuhlii; Blouch and Atmosoedirdjo 1987) have shown that the species was solitary and nocturnal, active intermittently through the night. The red muntjac (Muntiacus muntjak) was known to be mostly diurnal (Kawanishi and Sunquist 2004) and in several areas were classified as cathemeral (i. e., sporadic and random intervals of activity during the day or night; van Schaik and Griffiths 1996). Both deer are similar in size, elusive, and poorly known. Bawean deer and red muntjac are good examples of medium-sized ungulates, cryptic, secretive, and uncommon species in Southeast Asian tropical rainforests. Like most tropical ungulates worldwide, little has been published on their ecology and their role in the tropical rainforest ecosystem.
Through data analysis from a 9- and 19-month camera trapping in Bawean Island Nature Reserve and Wildlife Sanctuary (for Bawean deer) and Ujung Kulon National Park (for red muntjac), respectively, we ascertained how season, sex and lunar illumination along with their predators affect Bawean deer and red muntjac activity. This study aimed to test the hypothesis on seasonal, sex, and lunar influence along with their predators on activity patterns on the two tropical deer species, the Bawean deer and the red muntjac in the tropical rainforest in Southeast Asia. The hypothesis that specifically tested was that both deer species will minimize their activity during the most luminous season and moon phase as a response to the presence of predators or human disturbance.
Material and methods
Study areas. The research was conducted in Bawean Island Nature Reserve and Wildlife Sanctuary (hereafter refer to as Bawean Island) and Ujung Kulon National Park (hereafter refer to as Ujung Kulon; Figure 1). Bawean deer was studied in Bawean Island, an isolated 200 km2 island in Java Sea (-5° 40’, -5° 50’ S; 112° 3’, 112° 36’ E). The study area in this island comprised of a nature reserve (725 ha) and a wildlife sanctuary (3,832 ha) having a steep topography of terrain slopes more than 60° and a wide altitudinal gradient (-11 to 630 masl).

Figure 1 Location of the two study areas (BI: Bawean Island; Ujung Kulon: Ujung Kulon National Park) in Java, Indonesia where we studied the activity patterns of Bawean deer and red muntjac, respectively. Red dots location in Bawean Island and black dots location in Ujung Kulon.
Based on Schmidt and Ferguson (1951) classification, Bawean Island climate is categorized as type C with temperature varies between 22 and 32 °C (Semiadi 2004), the annual rainfall is 2,298 to 2,531 mm on the southern coast. Rainfall is mostly high during the northwest monsoon, which normally lasting from the end of October until April.
The main vegetation type on Bawean Island is tropical rainforest which can be divided into four major forest types: primary forest, secondary forest, teak (Tectona grandis) forest, and shrubs. The Bawean Island protects a small patch of tropical rainforest (approximately 23 % of the island area), including teak forest (60 %), a habitat type which is globally endangered due to deforestation and climate change. The remaining natural forests are confined to the steep sides and top of the higher hills and mountains, often occurring as habitat islands surrounded by teak.
Moreover, the Bawean Island serves as one of the last strongholds in the country for endemic medium-sized ungulates, including the Bawean deer and Bawean warty pig (Sus blouchi). Therefore, although the island is tiny, the Bawean Island plays a key role in conservation of medium-sized mammals in Indonesia. Unfortunately, land cover has been changing and continue to occur until now. The need of space for settlements and agricultural areas due to human population growth increasingly urges the existence of protected areas as the only safe habitat for Bawean deer. In addition, other pressures due to hunting activities and the presence of free-roaming dogs and invasive agricultural weeds (e. g., Ageratum conyzoides, Chromolaena odorata) are believed to cause a decline in Bawean deer habitat and population (Semiadi 2004).
Red muntjac was studied in Ujung Kulon, a peninsular national park at the extreme southwestern tip of Java Island, Indonesia (-6 ° 38’, -6° 52’ S; 105°30’, 105°41 ‘E). The Park encompasses an area of 105.694,46 ha, of which 44,337 ha are marine areas (Ministry of Environment and Forestry 2014). Ujung Kulon climate is categorized as type A (Hommel 1987) with a temperatures range of 25 to 30 °C and relative humidity ranges between 65 and 100 % (Blower and van der Zon 1977; Hommel 1987). Under the tropical maritime condition, the mean annual rainfall is approximately 3,250 mm. The heaviest rainfall occurs between October and April during the northwest monsoon. A noticeably drier period occurs between May and September with approximately 100 mm rainfall per month during the southeast monsoon. The Park has varied topography (with terrain slopes steeper than 15°) and a wide altitudinal gradient (0 to 620 m).
The vegetation in the Park is a tropical rainforest, which has suffered several anthropogenic and natural disturbances in the past and the present. It is mainly secondary growth, following the destructive tsunami of 1883 caused by the eruption of the Krakatau supervolcano and landslide in the Sunda Strait following a massive eruption of the Anak Krakatau volcano in December 2018. The main habitat types are primary forest, secondary forest, mangrove-swamp and beach forest. The Arenga palms, which grow on thick volcanic ash, may be dominant as a result of long-past volcanic disturbance. As a result, the natural vegetation cover, primary lowland rainforest, now occupies only 50 % of the total area, and is largely confined to the Mount Payung and Mount Honje massifs.
The Ujung Kulon constitutes one of the last strongholds for endemic large ungulates such as the Javan rhino (Rhinoceros sondaicus sondaicus) and banteng (Bos javanicus), as well as common carnivores such as Javan leopard (Panthera pardus melas) and dholes (Cuon alpinus). On the contrary to Bawean Island, human access, and the presence of forest edges in this Park is lower.
Gridding methodology. Camera trapping was used as the main method to study both deer species. The use of camera traps to study ecological attributes and behavioral aspects of deer has become popular and extensive lately (Caravaggi et al. 2017). Field surveys were carried out for nine months (March to November 2014) in Bawean Island and 19 months (January 2013 to July 2014) in Ujung Kulon. The sampling periods corresponded to two consecutive season cycles (wet and dry season). The distribution of season was based on the monsoon in Indonesia, i. e., wet season in November with transition in April and dry season in May with transition in October (Tjasyono 2008). Sampling effort during the survey was 5,500 trap-days in Bawean Island and 62,316 trap-days in Ujung Kulon.
In both study areas, camera traps were positioned according to the methodology of Karanth and Nichols (1998). The cameras were positioned in grids, in a way to cover the whole study area by applying a buffer equivalent to half of the mean maximum distance moved (MMDM). This means that any individual in the study area had a probability greater than zero to be photographed by at least one camera. Because the goal was obtaining as many photographs as possible in each grid, when a camera did not capture any object (zero presence) for some time, camera location was changed in the same grid. Based on the availability of camera traps and representation of major forest types, Bawean Island was divided into 20 trap stations of 2-km2, while Ujung Kulon was divided into 329 trap stations of 1-km2.
Camera traps with heat-in-motion detectors were used to continuously (24h) record the activity of the deer species and their main predator. Date and time of all photos were set automatically. Twenty units of Bushnell Trophy Cam HD Max analog cameras were deployed in Bawean Island. Each camera was mounted on a tree, positioned 30 to 50 cm above the forest floor to record small to large animals. In Ujung Kulon, 108 units Bushnell Trophy Cam 119467 and Bushnell Trophy Cam 119405 analog cameras were deployed. Cameras were positioned at 170 cm above the ground with an angle 10 to 20 degree toward to the ground, following the standard design of camera trapping by the on-going Rhino Monitoring Unit Team to survey the Javan rhino.
Cameras were checked every 28 to 30 days to replace battery and the memory card, and to check condition of the camera trap in case of malfunction to avoid data loss. Each photograph of the wild animal was identified to species, and if the quality of the photograph did not allow absolute identification, the photograph was excluded from the dataset. Sequential frames of the same species were counted as one photographic event, and unless individual identification was possible, any subsequent photograph of the same species taken within half hour of the first was not considered a new photographic event.
The study by Meek et al. (2016) conveys that there were differences in the level of detection produced by trap cameras that were placed at different heights (0.9 m and 3 m) and different orientations (placing the camera vertically or horizontally), where cameras placed 3 m high and those facing downwards reduced the detection rate of all species compared to those at 0.9 m. Although there were differences of placement of camera trapping in both of study areas, it seemed that it did not affect the capture probability. The height of camera traps differences in this study (0.5 m and 1.7 m with an angle of 10 to 20o lead to the ground), were still within the height limit which gave good detection results (see the number of species detection at each height).
Camera-trapping captures showed the presence of all small-to large-sized mammal species that were known to be existed in both study areas. For analysis purposes, findings of wild animals were separated in pair of deer species and their predators (i. e., Bawean deer with free-roaming dogs in Bawean Island; red muntjac with Javan leopard, and red muntjac with dholes in Ujung Kulon).
Each individual deer captured by camera trap was distinguished by sex based on the sexual dimorphism, presence or absence of antler, and the appearance of the genital organ (Figure 2). In most deer, males tend to be larger than females and possess antlers. Fawns were characterized by always being close to the mother. Individuals who did not show clear sex characteristics were categorized as unsex.

Figure 2 Photos of A) male and B) female Bawean deer in Bawean Island. C) male and D) female red muntjac in Ujung Kulon.
Data analysis
Temporal patterns of activity. Every camera location for each species site was used as an individual sample unit, furnishing hour/date and sex for each single event recorded. The activity level or capture frequency was defined as the proportion of photographic events per hour. The total photographic events occurring during each hour of a-24h day was considered as a proxy to the activity patterns of both species (Figure 3). Sequential frames of the same species were counted as one photographic event. Instances where an individual or group with same sex or composition respectively were captured by the same camera more than once within half hour were discarded from analyses. The number of Bawean deer and red muntjac events per hour of the day were grouped and tested the null hypothesis that both deer capture was uniform throughout the day, applying the Rayleigh test (Batschelet 1981; Zar 2010). The program Oriana V4.05 (Kovach Computing Services 2012) was used to apply this test. To complete this analysis, the Bawean deer and red muntjac events were grouped in three time periods: diurnal, nocturnal, and crepuscular (dawn and dusk). Diurnal (1h after sunrise to 1h before sunset), nocturnal (1h after sunset to 1h before sunrise), dawn (from 1h before to 1h after sunrise), and dusk (from 1h before to 1h after sunset; Theuerkauf et al. 2003).
Differences in the capture frequency between sexes and times of the day were evaluated using Chi-square tests. Two-factor analysis of variance were used to test differences in captures among daily time periods and seasons. For the seasonal analysis, data were pooled into 3h periods, to obtain a larger and more uniform number of activity-fixed in each period. Tukey’s honestly significant difference test was used to evaluate variation differences in the frequency of events for each period, when necessary. Results were considered significant if alpha < 0.05.
Moon phase and activity. Moon phase was enumerated for each calendar day of the sampling period using the software Quickphase Pro 3.3.4 (BlueMarmot.com). The effect of moonlight on capture frequency was obtained by assigning one of the four moon phases to each day. Following Batschelet (1981), circular statistical analyses for temporal data that follow a cycle was used.
To include the moon phase as a covariate in subsequent analysis, a lunar light index (LMw) was created according to the following calculation. For a given week, the number of nights corresponding to the four lunar phases was calculated and converted to a lighting coefficient according this quantification: new moon = 0, first and last quarter = 4, full moon = 10 (Lang et al. 2006; Manfredi et al. 2011). The coefficients values were added to obtain a LMw for each week. For example, a week of which all the nights were in full moon received an index of 70, while for a new moon week, the value was 0.
In analyzing the data sets according the variables of interest, particularly the lunar light, a Generalized Additive Models (GAMs as implemented in the R package mgcv) that was applied as a rough examination of the relationship between activity patterns and lunar cycle suggested a non-linear pattern. Indeed, deviance explained was better with additive rather linear models (37 % vs 10 % for additive and linear calculations respectively). GAMs are similar to generalized linear models except that a component of each predictor is a sum of smooth, nonlinear functions of the numerical predictor variables in the model. Additive modeling would be well suited to analyze non-linear response of species to multiple explanatory variables, situations encountered frequently for ecological data. Accordingly, temporal changes of rate of capture per week was modeled as a function of date (week number), habitat, season, elevation and an index evaluating the amount of moonlight received each week.
The sampling records at each camera trap station was divided into seven-day segments according to the week number. Accordingly, a weekly capture rate was estimated for each camera trap inside its operating period and constituted the modeled variable. Covariates used as predictor were the week number, habitat type, season simplified to two (wet and dry), elevation and a weekly index of lunar illumination (Appendix 1). Furthermore, the importance of covariates for determining the number of photographs/camera-week for each species based on Δ AICc were also measured accordingly (Appendix 2). GAMs analyses were run using R version 3.3.3. (R Core Team 2017) and coded using the “gam” function in the mgcv package (Wood 2006).
Temporal interactions between prey-predator. The activity patterns of ungulates were believed to be strongly related to their predators. The daily activity overlap patterns between a prey and their main predator were quantified with a two-step procedure that resulted in a coefficient of overlap, with the values ranging from 0 (no overlap in activity pattern) to 1 (identical activity pattern; Meredith and Ridout 2014). For the first step, each capture frequency along the day was estimated separately either non-parametrically, using kernel density estimation or by fitting a distribution from the flexible class of non-negative trigonometric sum distributions (Fernández-Durán 2004). For the second step, a measure of overlap between the two estimated distributions was calculated. Ridout and Linkie (2009) reviewed several alternative measures of overlap between two probability distributions, favouring the coefficient of overlapping, Δ (Weitzman 1970). In this research, Δ1 and Δ4 analysis were applied respectively (Ridout and Linkie 2009; Meredith and Ridout 2014) because of the mixture of small sample size (for Bawean deer-free roaming dog) and large sample size (for red muntjac-Javan leopard and red muntjac-dholes). The overlap package, developed by Meredith and Ridout (2014), was used to fit kernel density functions, estimate the coefficient of overlap, and calculate bootstrap estimates of the confidence intervals. The Mardia-Watson-Wheeler test (MWW test) was used to compare the distribution of detections across the dual cycle for all sampling pairs to determine whether two activity patterns significantly differ (Batschelet 1981). However, due to the limited number of records for Bawean deer-free roaming dog, the observed temporal interactions for both species surely need to be treated with caution.

Figure 3 Circular histogram illustrating the distribution of deer activity by camera traps throughout the day. Black bars indicate levels of activity of A) Bawean deer, and B) red muntjac. Radius and indicate location of average hour of activity and its 95 % confidence interval, respectively. n: total number of captures.
Results
Temporal pattern of activity. For the Bawean deer in Bawean Island, a total of 5,406 photographs were obtained, both in wet and dry season. Of those photographs, the number of photographs qualified to be used for analysis were 118 photographs of Bawean deer (wet: 18 vs. dry: 99 independent photographs) and 86 photographs of free-roaming dog (wet: 33 vs. dry: 50 independent photographs).
Bawean deer capture frequency did not varied significantly with time of day (F = 0.197, d. f. = 2, P > 0.05) and nor among seasons (F = 0.644, d. f. =1, P > 0.05; Figure 4A). There was no interaction between time of day and season in all activity levels (diurnal F = 1.179, d. f. = 2, P > 0.05; nocturnal F = 0.095, d. f. = 2, P > 0.05; crepuscular F = 0.047, d. f. = 2, P > 0.05). The null hypothesis that Bawean deer was distributed uniformly through the day was accepted (Rayleigh test; Z = 2.22; P > 0.05). This indicates that Bawean deer were active throughout most of the day. Although males of Bawean deer seemed to show slightly different pattern throughout the day than females especially during June and August, statistical tests showed that there were no significant differences in the activity patterns of both sexes (χ2 = 19.72, d. f. = 23, P > 0.05; Figure 4B).
For red muntjac in Ujung Kulon, a total of 86,432 photographs were exposed, with 4,363 photographs of red muntjac recorded in both seasons (wet: 1,639 independent photographs vs, dry: 1,986 independent photographs). Moreover, the potential predators for red muntjac were also recorded: 699 independent photographs of Javan leopard (229 and 470 in wet and dry season, respectively) and 351 independent photographs of dholes (95 and 256 in wet and dry season, respectively; Table 1).
Table 1 Total number of Bawean deer (Axis kuhlii) and red muntjac (Muntiacus Muntjak) records from March to November 2014 in Bawean Island Nature Reserve and Wildlife Sanctuary and from January 2013 to July 2014 in Ujung Kulon National Park, Indonesia.
| Species | Trap-days | Number of photographs | Sex ratioa | |||
|---|---|---|---|---|---|---|
| Males | Females | Fawn | Unsexed | |||
| Bawean deer | 5,500 | 78 | 46 | 20 | 11 | 1.70:1 |
| Red muntjac | 62,316 | 2290 | 1694 | 84 | 116 | 1.35:1 |
aAdult sex ratio (M/F); calculated only from known sex.
Red muntjac showed a significant variation of activity level with time of day (F= 344.92, d. f. =2, P > 0.01) and also between seasons (F = 13.33, d. f. =1, P > 0.01; Figure 4C). There was an interaction between time of day and season in crepuscular activity levels (F = 54.48, d. f. =2, P > 0.001), but not for diurnal and nocturnal activity levels (F= 0.317, d. f. =2, P > 0.05 for diurnal; F = 0.991, d. f. =2, P > 0.05 for nocturnal). Tukey post-hoc comparisons indicated that crepuscular (M = 4.745) was significantly greater than diurnal (M = 1.445) and nocturnal (M = 2.112) activity levels. Based on the Rayleigh test, the null hypothesis that red muntjac activity was distributed uniformly throughout the day was rejected (Z = 756.85; P > 0.01). Although male and female red muntjac showed diurnal activity levels with higher peaks during more or less one hour after sunrise until one hour before sunset, there was no significant differences in activity patterns (χ2 = 31, d. f. =23, P > 0.05). Most activities occurred during August and September for both sexes (Figure 4D).
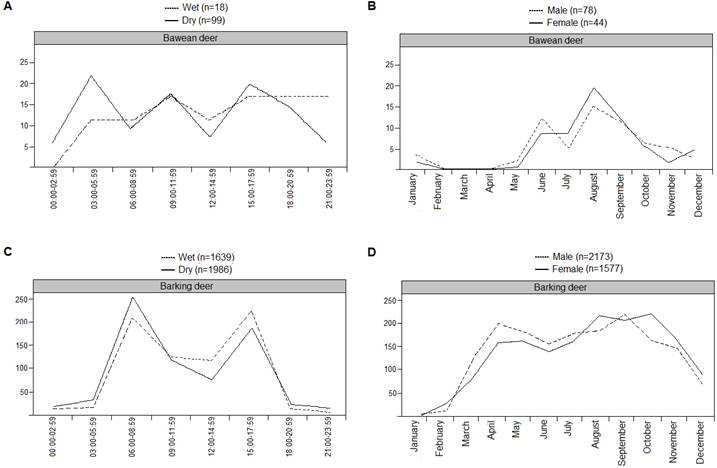
Figure 4 Pattern of seasonal activity of A) Bawean deer and B) red muntjac and intersexual monthly activity of C) Bawean deer and D) red muntjac, respectively, in Bawean Island Nature Reserve and Wildlife Sanctuary and Ujung Kulon National Park. n: total number of captures.
Moon phase and activity. Results of GAMs showed that the relationship between deer activity and LMw gave very similar pattern between Bawean deer and red muntjac during the wet season with estimates of 1.716 (p-value = 0.236) and 8.875 (p-value = 0.000) respectively (Table 2A, B; Figure 5). These patterns were in agreement with the differences that appeared between the activity rhythms estimated by the proportion of captures per time slot. While red muntjac was active in a bimodal mode, primarily during the daytime, the Bawean deer had a larger temporal distribution over the day and night periods.
Table 2 Result of the Generalized Additive Models (GAMs) relating the number of photographs/camera-week of Bawean deer to habitat type (Hab), index of lunar light received by week (LMw) and season (Seas).
| A (n = 190) | ||||
|---|---|---|---|---|
| Parametric coefficients | Estimate | Std. Error | z value | Pr(>|z|) |
| (Intercept) | 0.2109 | -3.809 | -0.8031 | 0.00014*** |
| SeasWet | -2.7177 | 1.9125 | -1.421 | 0.15531 |
| Smooth terms | Edf | Ref.df | Chi.sq | p-value |
| s(LMw:SeasDry) | 5.095 | 6.13 | 34.525 | 6.45e-06 *** |
| s(LMw:SeasWet) | 1.716 | 2.109 | 3.217 | 0.236 |
| s( IdCatr)# | 7.259 | 12.000 | 37.133 | 8.23e-08 *** |
| R-sq.(adj) = 0.283 | Deviance explained = 34.7 %; UBRE = 0.23925 Scale est. = 1 | |||
| B (n = 6835) | ||||
| Parametric coefficients | Estimate | Std. Error | z value | Pr(>|z|) |
| (Intercept) | -2.0101 | 0.2564 | -7.841 | 4.48-15*** |
| HabPr_f | 1.5620 | 0.4349 | 3.592 | 3.29-4*** |
| HabSe_f | 1.0790 | 0.2601 | 3.5920 | 3.33-5*** |
| HabSwMgr | 0.4487 | 0.5469 | 0.8200 | 0.4119 |
| Smooth terms | Edf | Ref.df | Chi.sq | p-value |
| s(LMw:SeasDry) | 8.710 | 8.974 | 116.66 | 2-16*** |
| s(LMw:SeasWet) | 8.875 | 8.995 | 40.35 | 6.52-6*** |
| s( IdCatr)# | 221.856 | 242.000 | 2606.07 | < 2-16 |
| R-sq.(adj) = 0.219 | Deviance explained = 30.5 %; UBRE | 0.18173 | Scale est. = 1 |

Figure 5 Estimated capture rate (per week) by idCam as a function of GAM covariate MPw (weekly index of lunar light), a) Bawean deer, b) red muntjac. Dashed line indicates the 95 % confidence interval.
Accordingly, the relationship with lunar light of both species unveiled very distinctive patterns. The red muntjac activity revealed as diurnal was not influenced by lunar light, conversely to the Bawean deer that tend to increase their activity with lunar light intensity.
Temporal interactions between prey-predator. The results of the MWW test revealed that patterns of daily activities were significantly different in all pairs of species (i. e., Bawean deer-free-roaming dogs, red muntjac-Javan leopard, red muntjac-dholes; Table 3, Figure 6). The values of temporal overlap coefficients were < 0.72 for all pairs of animals, which means that there was either low or intermediate overlap in their activity patterns. The most similar pairs was between the red muntjac and dholes, which were cathemeral species. Free-roaming dog and Bawean deer showed different peak activities. The free-roaming dog was most active in early morning and late evening, whereas the peak activity of Bawean deer was in mid-day.
Table 3 Overlap coefficient (Δ1 and Δ4) between prey-predator activity patterns, 95 % confidence intervals (95 % Cis), and Mardia-Watson-Wheeler (MWW) test.
| Δ1 and Δ4 (95 % CI) | MWW | P Value | |
|---|---|---|---|
| Bawean deer × Free-roaming dog | 0.63 (0.52-0.74) | 29.67 | <0.0001** |
| Red muntjac × Javan leopard | 0.43 (0.38-0.48) | 42.75 | <0.0001** |
| Red muntjac × Dholes | 0.71 (0.68-0.74) | 7.18 | <0.05* |
The P value of less than 0.05 indicate that the two sets of circular distributions come from different distribution.
Discussion
Several authors have previously analyzed the activity pattern of Bawean deer and red muntjac. Blouch and Atmosoedirdjo (1978, 1987) noted that Bawean deer was primarily nocturnal, emerging from dense cover just after dark (around 6pm) and being active intermittently throughout the night. Peak of activity occur approximately every two hours, usually separated by retreats into cover. As the night progressed, foraging periods become shorter and rests become longer, until the deer retired back into dense cover at sunrise. At night they move into more open forest areas or grasslands and cultivated area. These results were also similar to those recorded by Semiadi (2004) - individuals were occasionally seen on the beach in the southwest of the island or along the river at dusk until night period, but otherwise were rarely seen directly.
As for the activity patterns of red muntjac, the patterns appeared varies. In Taman Negara, Malaysia, Kawanishi and Sunquist (2004) noted that red muntjac tended to be diurnal, whereas in Gunung Leuser, Sumatra (van Schaik and Griffiths 1996) and also in East Java (S. Hedges pers. comm. 2008) showed cathemeral patterns, leading to a conclusion that there some variation between localities in balance of day and night activity.
Contrary to the prediction, the patterns of activity were discrepant with results from previous research by Blouch and Atmosoedirdjo (1978, 1987) and Semiadi (2004). Despite the small amount of data, the Bawean deer were significantly active throughout the day with a peak activity at 6 to 7h and 20 to 21h. The low hourly variation in the activity patterns of Bawean deer may be due to the lack of wild predators (Bonnot et al. 2016), except the large reticulated pythons (Malayopython reticulatus). However, pythons were not common and likely have little impact on the deer population (Blouch and Atmosoedirdjo 1987). Killing a young fawn may have occurred by wild boar or macaques in the study site, but no evidence has been found to support this (Blouch and Atmosoedirdjo 1987). People who hunting with their dogs were currently the greatest cause of mortality to this species, and were responsible for 9 out of the 11 deaths examined by Blouch and Atmosoedirdjo (1987) during October 1977 and May 1979. Hunters may hunt at any time of the day, although most of the hunting took place in the morning or late evening, between 7 to 10h and 16 to 18h, respectively.

Figure 6 Daily activity patterns and overlap of A) Bawean deer- free-roaming dog, B) red muntjac-Javan leopard, C) red muntjac-dholes.
Human-wildlife conflicts, fragmented landscape and predation by free-roaming dogs across the study site in Bawean Island were responsible for most mortality of Bawean deer. Most of the deaths occurred in area between the edge of protected areas and settlements or on cultivated areas. During this study, two cases of Bawean deer death were found, caused by free-roaming dogs, but this was much lower when compared with prior observation in the 1990s when hunting has led to high population declines in the past (Rahman et al. 2016, 2017). As a consequence, Bawean deer may be adopting a more flexible behavior, on the absence of natural predator and hunting activity by human. In addition, the presence of Bawean deer throughout the day in some harvested forest suggests that this species was able to tolerate selective logging. Previous study (Rahman et al. 2017) indicated that there was a tendency that the distribution of Bawean deer became closer to human settlements. However, a definitive testing of this assumption requires documenting Bawean deer activity patterns in other areas more exposed to human impact, such as those located outside and on the border of the Bawean Island. Therefore, reduced predator risk could enable Bawean deer to be active across the entire lunar cycle, without the need to avoid strong illuminated nights.
In Ujung Kulon, activity pattern of red muntjac seemed to be more related to the activity of predation by Javan leopard and dholes than hunting or habitat disturbance. In this study, the activity of red muntjac might be opposite toward their main predator activity pattern. The activity peaks for the red muntjac were found to be mostly diurnal, while dholes as the main predator were widely known as diurnal species with high activity in the afternoon and late afternoon (Nurvianto et al. 2015; Rahman et al. 2018). There were several images of the dholes captured during the day, indicated that the dhole’s travelling activity pattern for hunting was during early morning to mid-day and with peak in the evening hours. As a carnivore, it is advantageous for the dholes to be most active during the hours when its prey is most active.
During the study, poaching was lower compared to the last 20 years ago, and thus may provide an opportunity for the red muntjac population to survive and continue to grow. However, there was no strong evidence that either hunting or habitat disruption were actually threats to the survival of populations except in the case of islands such as Singapore, where it is now extinct (Baker and Lim 2008). Peak densities of red muntjac were not in pristine forest (see Oka 1998; Laidlaw 2000; Azlan 2006; for habitat and ecology). In Danum Valley (Sabah, Borneo), an area with negligible hunting, the density of red muntjac was increased after logging (Davies et al. 2001), either strongly increased as reported by Davies et al. (2001) or weakly found by Duff et al. (1984). Nevertheless, even quite severe habitat disruption can increase ecological carrying capacity for this deer, but this trend must be considered with caution as it could be temporary at a small scale.
It has been known that the time dedicated by wild animals to search for and obtaining food is inversely proportional to its abundance (Chappel 1980). If this type of behavior was the main factor affecting the quantity of time spent active by Bawean deer and red muntjac, the lower activity level in wet season at each study site might be related to greater availability of food. In most tropic habitats, food is assumed to be uniform throughout the year (Foster 1973; Frankie et al. 1974), but become scarce over the dry season (Pontes and Chivers 2007). Study by Esparza-Carlos et al. (2011) might explain that during the wetter year, food resources became less important factor, while cover and visibility were better to explained deer habitat use. The fact that the number of captures by camera trapping were less for males and females of both deer in wet season is likely to be associated to the finding that food was abundant, and thus reduced their activity and movement. Alternatively, the maximum activity in dry season in both species, could also reflect the reproductive and distinct tactics in males and females of solitary deer (Blouch and Atmosoedirdjo 1987; Kitchener et al. 1990). The increased activity of females may be due to the greater energetic requirements to feed their weaned young. Breading season for both deer occurred from February to June (Blouch and Atmosoedirdjo 1987; Kurt 1990). Males may be induced to increase their level of activity to devote more time in activities related to the marking and maintenance of territory in response to the presence of dispersing juveniles (Oka 1998; Kitchener et al. 1990).
Bawean deer tended to be more active in bright nocturnal periods than when the night was dark in Bawean Island and this trend contradicts the hypothesis. Some authors have reported that moonlight may act indirectly on the behavior of ungulates by increasing their rate of movements in brighter nights when moonlight play an important role in sustaining relatively high levels of visual acuity to find food (Birkett et al. 2012; Prugh and Golden 2014). Deer movement increased when the moon directly positioned overhead or underneath. The moonlight effects on activity level was high enough to indicate that lunar cycles likely have a major impact on the foraging rates and habitat use, particularly for Bawean deer. An alternative explanation was associated with the trade-offs between food and safety from the risk of predation.
In 1950-2000, Bawean deer and warty pig hunting by dogs were widespread in Bawean Island, especially during the moonlight period. But, the current strict rules regarding the protection of both species caused this activity to be less frequent. Deer predation by dogs that happened recently is a natural behavior pattern of this carnivorous species, they benefit from detection of prey when the deer increase their activity during certain phases of the moon which provide good lighting at night.
Unlike Bawean deer, red muntjac activity did not vary with the level of moonlight. Being more active in bright night conditions makes red muntjac more visible and detectable by Javan leopards and dholes. Harmsen et al. (2011) showed that armadillos and pacas appeared to further reduce predation risk by lowering their activity during bright moonlight nights, as has been observed in many smaller rodent species (Daly et al. 1992; Kotler et al. 2004).
We believe that the differences between two similar-sized species, Bawean deer and red muntjac, can be explained by a difference in the exploitation of resources, habitat disturbance and behavior to avoidance of types of predator and their hunting tactics (Burkepile et al. 2013). Daily activity patterns can have consequences for an animal’s predation risk (Kronfeld-Schor and Dayan 2003) and foraging success (Rijnsdorp et al. 1981). Predators are believed to have higher hunting success when prey are mobile (Avgar et al. 2011; Traill et al. 2016), so increased ungulate activity at dawn and dusk could provide predators with a useful means of enhancing predation success by investing hunting effort during periods of increased prey activity.
This paper presents the first daily activity data in relation to the lunar cycle and the predator activity patterns influencing tropical deer in Indonesia. The results suggested that moonlight may play an important role in sustaining relatively high levels of visual acuity on Bawean deer. Considering the extremely low numbers and limited geographic distribution of wild Bawean deer populations, conserving populations should ideally be developed by controlling the population of free-roaming dogs and the prohibition of hunting by humans using dogs.
The conservation of both protected areas should be considered a top priority because of high species endemism and conservation risk. Such knowledge may be essential for the future management plans and conservation of many unique areas, not only in Bawean Island but also in many areas in Indonesian tropical rainforest where they are facing the same threats.

