


Servicios Personalizados
Revista
Articulo
 texto en
  Inglés (pdf)
 Artículo en XML
 Referencias del artículo
 Enviar artículo por email
Indicadores
-
 Citado por SciELO
 -
 Accesos
Links relacionados
-
 Similares en
SciELO
Similares en
SciELO
Compartir

 Permalink
Revista mexicana de ciencias forestales
versión impresa ISSN 2007-1132
Rev. mex. de cienc. forestales vol.12 no.66 México jul./ago. 2021 Epub 04-Oct-2021
https://doi.org/10.29298/rmcf.v12i66.755
Scientific article
Land cover and land use change in the Soconusco region, state of Chiapas
1Colegio de la Frontera Sur. Departamento de Observación y Estudio de la Tierra, la Atmósfera y el Océano.México.
The Soconusco region is described as one of the most productive agricultural regions in the state of Chiapas, where high biodiversity areas threatened by land use change are still preserved. The objective of this work was to analyze the trajectories of land cover and land use change in three watersheds in this region over a 25-year period. Satellite images from 1990, 2000, and 2015 were classified. Results show a significant loss of natural vegetation (forests, mangroves, and secondary vegetation) and the expansion of human settlements. Different processes of change were identified in each of the assessed landscapes: Coast, Plain and Highlands. In the Plain, the predominant land use change was the replacement of basic crops by agricultural plantations. In the Highland and Coast landscapes, where significant forest remnants are found, the most evident change was deforestation. Although the region experienced strong increases in population density and growth of urban areas, the areas dedicated to staple crop production have remained unaltered. The pattern of land cover change indicates that the study region is undergoing a process of agricultural intensification and urbanization.
Key words: Deforestation; agricultural intensification; oil palm; loss of agroforestry systems; urbanization; land use
El Soconusco se caracteriza por ser una de las regiones agrícolas más productivas del estado de Chiapas, en la que aún se conservan zonas de alta biodiversidad amenazadas por el cambio de uso del suelo. El objetivo de este trabajo fue analizar las trayectorias del cambio en la cobertura y usos del suelo en tres cuencas de dicha región durante un período de 25 años. Se clasificaron imágenes de satélite de 1990, 2000 y 2015. Los resultados mostraron una significativa pérdida de la vegetación natural (bosques, manglares y vegetación secundaria), además de la expansión de los asentamientos humanos. Se identificaron procesos diferentes de cambio en cada uno de los paisajes evaluados: Costa, Planicie y Sierra. En la Planicie, el cambio de uso de suelo predominante fue la sustitución de cultivos básicos por plantaciones agrícolas. En los paisajes de Sierra y Costa, donde hay remanentes importantes de bosques, el cambio más evidente fue la deforestación. A pesar de que en la región se registraron fuertes incrementos en la densidad poblacional y en las áreas urbanas, las zonas dedicadas a la producción de cultivos básicos se han mantenido sin modificaciones. El patrón de cambios en la cobertura de suelo indica que la región de estudio está en un proceso de intensificación de la agricultura y de la urbanización.
Palabras clave: Deforestación; intensificación de la agricultura; palma de aceite; pérdida de sistemas agroforestales; urbanización; uso de suelo
Introduction
Changes in land cover, particularly due to deforestation, and changes in land use (CLU) are some of the processes that contribute to global climate change, local loss of biodiversity, and increased vulnerability to natural disasters (Cochard and Delzon, 2013; Newbold et al., 2016).
From 1990 to 2000, Mexico exhibited deforestation rates close to 190 000 ha yr-1. This figure has decreased slightly in recent times, so that, from 2010 to 2015, decreases in tree cover of nearly 149 000 ha yr-1 were recorded (FAO, 2015). Agricultural uses have also changed; many rural landscapes in developing countries show evidence of the loss of traditional agriculture in favor of more intensive land uses, largely driven by the demand for raw materials (Vliet et al., 2012).
In the specialized literature, the causes of land cover and land use change are classified into two main groups called direct factors or proximate causes, and root or indirect factors, or underlying causes (Challenger and Dirzo, 2009; Rautner et al., 2013). Proximate causes refer to activities that have a direct effect on land cover and land use, e.g. expansion of livestock or of the agricultural frontier; whereas, underlying causes correspond to forces operating in a broader context, generally external to the study area, but affecting the decisions made by local actors (Klooster, 2003; Grau y Aide, 2008; Defries et al., 2010).
In a meta-analysis of deforestation in the tropics, Geist and Lambin (2002) conclude that shifting agriculture and population growth are the most frequently cited proximate factors. However, it is very difficult to generalize about the processes that lead to the loss of tree cover, due to the socio-environmental particularities of each region (Corona et al; 2016; Calzada et al; 2018).
Land cover maps and analysis of production statistics can suggest hypotheses regarding the role of factors related to land cover change and the nature of the associated underlying causes (Park and Lee 2016; Ayandale and Howard 2017). However, for a good interpretation of these changes, it is advisable to have maps with a thematic and spatial resolution in order to capture the processes of interest. This is particularly desirable in regions with complex landscapes, i.e. regions with a rugged relief, or where the intense land-use changes result in a diverse, dynamic landscape.
The object-based approach to satellite image classification has been relevant because it allows the integration of contextual information and expert knowledge into the analysis (Flanders et al., 2003), avoids the presence of isolated pixels (salt and pepper effect) and establishes relationships between objects in the image and the features of the terrain. The first stage of object classification is segmentation, i.e. the delimitation of discrete regions with pixels that have relatively similar values (Gao, 2009). In a second stage, labels or classes are assigned to the segments by means of one of the available classifiers.
In the present work, the object-based classification approach was applied to obtain land cover maps for three years (1990, 2000, and 2015) of an area with intense land-use change dynamics. The objective was to identify trends and spatial patterns of land-use change over a 25-year period.
Materials and Methods
Study area
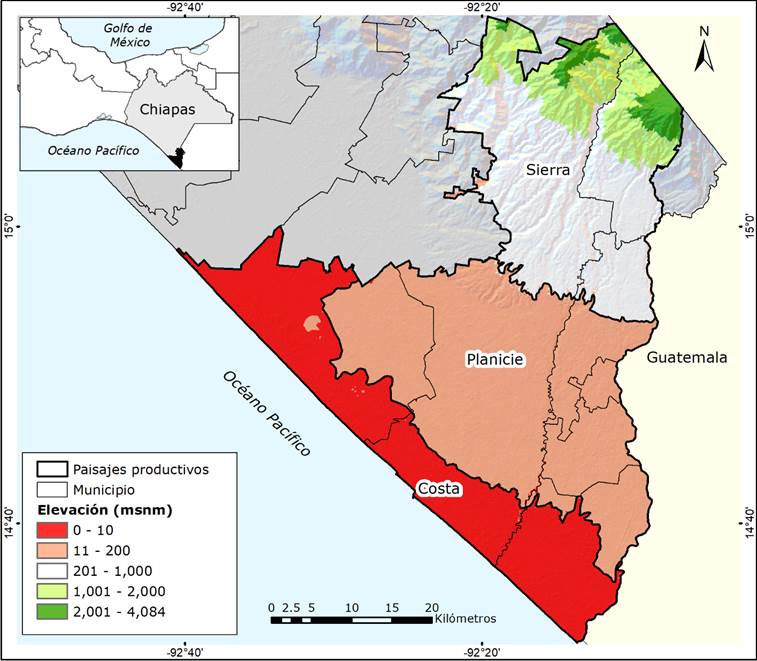
The Soconusco economic region is located in the south of the state of Chiapas, in the Mazatán, Tapachula, Tuxtla Chico, Frontera Hidalgo, Suchiate, Metapa and Cacahoatán municipalities; together, the seven municipalities have a total area of 2 032 km2 and cover three river basins: those of the Coatán, Cahoacán and Puerto Madero rivers (Figure 1). The area is located in an altitudinal range of 0 to 4 100 m, including mountain ranges, hills and alluvial plains (INEGI, 2001). The predominant climates are warm sub-humid, and humid temperate. The combination of altitudinal and climatic elements gave rise to a wide variety of ecosystems, including mangrove swamps in the alluvial plains; medium sub-evergreen forests in the midlands and hills, and mesophilic mountain forests and pine forests in the highlands. It also favored an optimal development of agricultural and livestock activities; coffee, mango and banana crops occupy an important portion of this territory and are among the most commercialized crops both nationally and internationally (Flores, 2019).
Satellite image classification
Three land cover and land use maps corresponding to 1990, 2000 and 2015 were produced; in their construction process, first an automated classification and a photointerpretation classification were carried out.
Three Landsat images downloaded from www.glovis.usgs.gov, whose acquisition dates corresponded to the dry season (January to April), were used to obtain cloud-free scenes (Path 021, Row 051): Landsat 5 TM 10, January 1990; Landsat 7 ETM, February 15, 2000, and Landsat 8 OLI 15, April 2015. Orthophotos from 1996, a digital altitude model with a pixel size of 30 m, and high-resolution images from the Google Earth platform were used as support material. Additionally, from March to May 2015, field trips were conducted at 100 control sites, selected according to fully targeted criteria, to obtain sufficient information to define the training samples with which the classification algorithms were calibrated. The information collected at each site was as follows: 1) geographic position in UTM coordinates (determined with a Garmin eTrex20x GPS navigator); 2) type of land cover and land use; 3) terrain exposure (determined with a compass, Naturehike, modelo NH15A003-E), and 4) photographs of the site (taken with a Canon Powershot Elph 18 camera). Field data were also utilized to determine the legend of the maps (Table 1).
Table 1 Description of the legend used for satellite image classification and interpretation.
| General categories | Land cover and land use types | Description |
|---|---|---|
| Natural and semi-natural vegetation | Forests | Arboreal vegetation in a good state of conservation. It includes the Mesophilic Mountain Forest, Coniferous Forest and the Sub-evergreen Tropical Forest |
| Mangrove | Arboreal vegetation resistant to saline conditions typical of land-sea transitions. | |
| Hydrophilic Vegetation | Non-woody vegetation associated with water bodies, including reed beds | |
| Disturbed forest | Includes areas of secondary arboreal vegetation (acahuales), disturbed forests and coffee agroforestry systems under shade. | |
| Plantations | Coffee | Coffee plantations that do not use shade trees. |
| Mango | Agricultural plantation | |
| Banana | ||
| Palm oil | ||
| Crops | Crops | Agricultural land uses including rainfed crops, irrigated crops, cultivated pastures. |
| Human settlements | Human settlements | |
| Water bodies | Water bodies | |
| Others | Without apparent vegetation | Areas where there is no apparent vegetation cover on the ground surface. Mainly sand banks and roads. |
An object-oriented approach was used for the supervised classification, which consists of two stages: in the first stage, the image was divided into a series of regions (segments or polygons), and in the second, identifiers were assigned according to the land-cover types described in the text at the foot. For the creation of the segments, the spectral and spatial characteristics of the image were considered together; the edge algorithm of ENVI 5.1 (ENVI, 2015) was used; this algorithm requires the calibration of two parameters: "Scale level" and "Merge level", which range between 0 and 100. The scale level controls the size of the segments, while the merge level allows merging similar adjacent segments.
Tests were performed with different values for the two parameters. The combination of Scale Level = 50 and Merge Level = 80 was the one that visually produced the segments of the most adequate size, i.e., segments that clearly delimited the stands by maintaining a minimum number of these.
A post-processing phase was applied to the maps resulting from the supervised classification of the images for the three years (1990, 2000, and 2015), in order to identify the types of agricultural plantations, such as oil palm, banana, and mango. In this phase, the 1996 orthophotos, Google Earth images, and data from field trips were used as support material.
In order to obtain an estimator of the level of thematic error in the maps, a stratified random sampling design was used; 100 sampling points or sites were spatially distributed over the entire study region; in each of these, the type of land cover and land use were photo-interpreted with high-resolution images from Google Earth™. This data set was different and independent from the one used in the calibration of the classifiers. The error was calculated by comparing the degree of coincidence between the sampling sites and the map generated from the supervised classification, according to the analysis methodology proposed by Olofsson et al. (2014). The thematic error estimation was applied only to the 2015 map, as the availability of high-resolution imagery for the years, 1990 and 2000, was limited.
Characterization of land-cover and land-use change
In order to obtain change matrixes, a map overlay analysis was carried out, using only two maps derived from the supervised classification, but grouped according to the general categories described in Table 1. The change matrixes obtained correspond to the complete 1990-2015 interval.
In order to have a clearer interpretation of the relevant changes and processes over the last 25 years, three landscapes were defined according to the characteristics of the relief and the productive aspects identified in the Basin (Figure 1).
The first landscape, the Coast, corresponds to the alluvial plains located at an altitude of 0 to 10 masl, characterized by the presence of wetlands. The predominant productive activity corresponds to livestock and, to a lesser extent, to agricultural plantations. The next landscape, the Plains, comprises mainly the areas located at 11 to 200 masl, with slight slopes; most of the agricultural activities ―rainfed and irrigated agricultural crops, cultivated pastures and agricultural plantations of mango, banana and oil palm― are carried out here. Finally, the Sierra is located at altitudes between 201 and 4 100 m, where the terrain slopes are often steep; the prevailing physiography in this area favors the distribution of forest remnants, and conditions are favorable for coffee cultivation practiced as an agroforestry system or under shade.
Results
Classification of images
The overall accuracy of the 2015 map was 92 %, an acceptable level for land cover maps. Table 2 shows user and producer accuracy levels for each of the 2015 land cover classes. Most classes were identified as having a high reliability (accuracy >= 0.78), with the exception of Coffee Plantations, which often exhibited a spectral response similar to that of Disturbed Forest, resulting in low producer accuracy. Given the low level of estimated reliability, the coffee plantations may cover a surface area almost five times larger than the one estimated by the classification; in spite of this, it was decided to keep these plantations as a separate class, given that their extension is minimal.
Table 2 Results of the accuracy assessment of the 2015 land-cover map.
| Category | Cover | User accuracy | Producer accuracy | Original surface area (ha) | Adjusted surface area (ha) | Confidence interval |
|---|---|---|---|---|---|---|
| Natural and semi-natural vegetation | Forests | 0.78 | 1 | 6 869 | 5 343 | ± 1 358 |
| Mangrove | 0.83 | 1 | 7 464 | 6 220 | ± 2 438 | |
| Aquatic vegetation | 1 | 1 | 6 434 | 6 434 | ± 0 | |
| Disburbed forest | 0.83 | 0.9 | 60 490 | 56 186 | ± 20 644 | |
| Plantations | Coffee plantation | 0.83 | 0.14 | 1 986 | 11 737 | ± 19 771 |
| Mango plantation | 0.83 | 1 | 16 060 | 13 383 | ± 5 246 | |
| Banana plantation | 1 | 1 | 11 196 | 11 196 | ± 0 | |
| Palm tree plantation | 1 | 1 | 854 | 854 | ± 0 | |
| Crops | Crops | 1 | 1 | 76 757 | 76 757 | ± 0 |
| Human settlements | Human settlements | 1 | 1 | 12 679 | 12 679 | ± 0 |
| Others | Without vegetation | 1 | 1 | 1 176 | 1 176 | ± 0 |
| Water body | Water body | 1 | 1 | 1 515 | 1 515 | ± 0 |
N = 100
It was not possible to assess the accuracy of the maps for the other two years (1990 and 2000) due to the scarcity of high-resolution images; moreover, the same training samples (or most of them) were used for all three images, and, therefore, a similar level of error was assumed for all three maps.
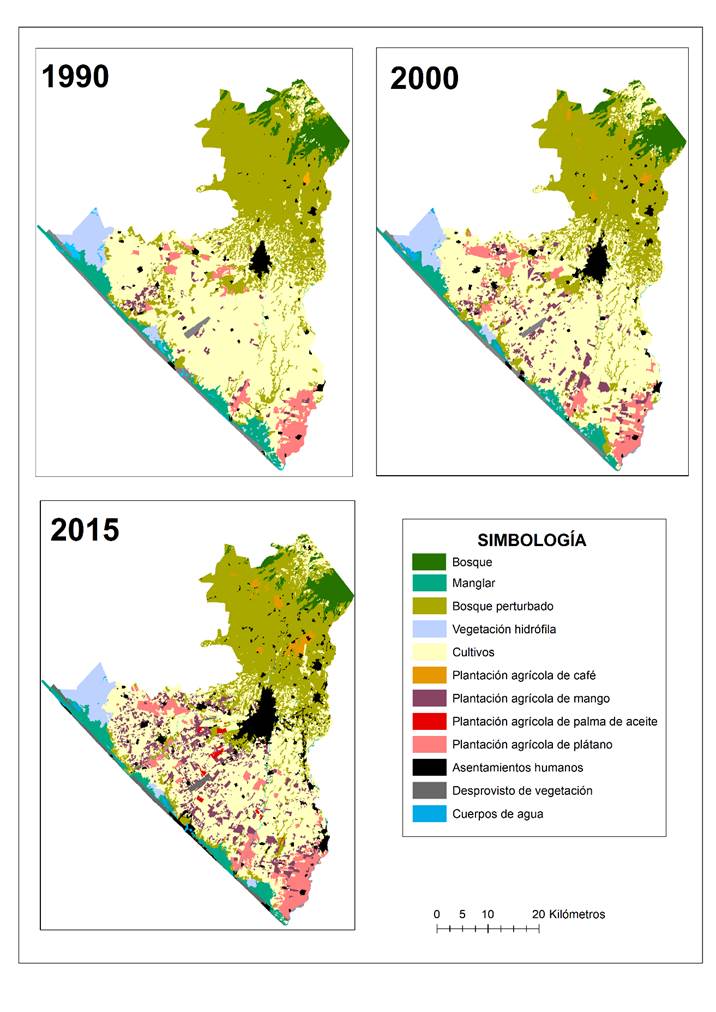
Table 3 summarizes the results of the satellite image classifications for 1990, 2000, and 2015. As may be observed, the Crops category (irrigated and annual rainfed crops and pastures) was the predominant one. This land cover had a consistent decrease in the 1990-2000 and 2000-2015 periods, but the largest decrease was recorded in the latter, reducing its occupation rate of 45 % of the area to 38 %. A similar behavior was observed in the category that includes natural and semi-natural land cover, although in this case the highest rate of loss occurred from 1990 to 2000.
Table 3 Surfaces of land cover types and land use in the study area in 1990, 2000 and 2015.
| Categories of change |
Land-cover types |
1990 | 2000 | 2015 | Rate of change in land use |
||||
|---|---|---|---|---|---|---|---|---|---|
| ha | % | ha | % | ha | % | 1990-2000 | 2000-2015 | ||
| Natural and semi- natural vegetation |
Forests | 9 218 | 4.5 | 7 655 | 3.7 | 6 869 | 3.4 | -1.8 | -0.7 |
| Mangrove | 9 071 | 4.4 | 7 654 | 3.7 | 7 464 | 3.7 | -1.7 | -0.2 | |
| Hydrophilic Vegetation | 6 741 | 3.3 | 6 116 | 3 | 6 434 | 3.2 | -1 | 0.3 | |
| Disturbed forest | 66 099 | 32.4 | 62 047 | 30.5 | 60 490 | 29.7 | -0.6 | -0.2 | |
| Plantations | Coffee | 246 | 0.1 | 778 | 0.4 | 1 986 | 0.9 | 12.2 | 6.4 |
| Mango | 2 854 | 1.4 | 8 789 | 4.3 | 16 060 | 7.9 | 11.9 | 4.1 | |
| Banana | 8 694 | 4.3 | 9 766 | 4.8 | 11 196 | 5.5 | 1.2 | 0.9 | |
| Oil palm | 0 | 0 | 0 | 0 | 854 | 0.4 | -100 | ||
| Crops | Crops | 93 637 | 45.9 | 91 780 | 45.1 | 76 757 | 37.7 | -0.2 | -1.2 |
| Human settlements | Human settlements |
4 011 | 1.9 | 6 377 | 3.1 | 12 679 | 6.2 | 4.7 | 4.7 |
| Without vegetation |
1 814 | 0.9 | 1 230 | 0.6 | 1 176 | 0.6 | -3.8 | -0.3 | |
| Water body | Water body | 1 289 | 0.6 | 1 473 | 0.7 | 1 515 | 0.7 | ||
Agricultural plantations and other types of plantations exhibited a steady increase in the two periods under analysis. Regarding the last category, the accelerated growth of human settlements, which have doubled in size in the last 15 years, is noteworthy.
Processes of change by type of landscape
Figure 2 shows the spatial distribution of land cover changes for the three dates of analysis. The large growth of agricultural plantations, which includes not only an increase in the occupied area, but also a greater dispersion of the area, is noteworthy. The change in the size of the city of Tapachula, the largest human settlement in the area, is also noticeable.
The change matrixes (Table 4) are the result of overlaying maps and provide information on losses and gains in land cover, but more importantly, they provide information on the transitions or types of land cover that replace the original one. Table 4 shows these matrixes for the three production landscapes; the figures represent hectares.
Table 4 1990-2015 matrices of change by type of productive landscape (ha).
| 1990 | ||||||
|---|---|---|---|---|---|---|
| Natural and semi-natural vegetation | Crops | Plantations | Settlements | Water bodies | ||
|
Coast 2015 |
Natural and semi-natural vegetation | 15 228 | 923 | 15 | 106 | 195 |
| Crops | 2 371 | 6 953 | 274 | 196 | 9 | |
| Plantations | 262 | 1 789 | 2 041 | 14 | 2 | |
| Settlements | 231 | 439 | 22 | 1 049 | 39 | |
| Water bodies | 154 | 165 | 73 | 44 | 513 | |
|
Plains 2015 |
Natural and semi-natural vegetation | 6 791 | 3 925 | 330 | 19 | 0 |
| Crops | 4 828 | 53 688 | 2 480 | 181 | 11 | |
| Plantations | 1 836 | 16 027 | 5 936 | 147 | 0 | |
| Settlements | 2 260 | 4 043 | 242 | 3 382 | 0 | |
| Water bodies | 100 | 201 | 105 | 2 | 67 | |
|
Mountain range 2015 |
Natural and semi-natural vegetation | 51 327 | 2 273 | 79 | 20 | 0 |
| Crops | 2 896 | 2 809 | 0 | 1 | 0 | |
| Plantations | 1 818 | 1 | 159 | 5 | 0 | |
| Settlements | 1 374 | 234 | 6 | 556 | 0 | |
| Water bodies | 23 | 3 | 0 | 0 | 11 | |
The columns show the categories at the beginning of the period, and the rows show the permanence (in bold) and the changes at the end.
Figure 3 is based on the data from the matrixes and schematically shows the dominant processes of change. On the Coast, the predominant changes were from Crops to Plantations (1 789 ha) and human settlements (371 ha). Natural vegetation exhibited losses and gains, but, in net terms, there was a decrease in these areas, which were occupied by Crops. According to Table 3 and Figure 2, the vegetation types affected were hydrophilic vegetation, mangroves and some remnants of disturbed forest.
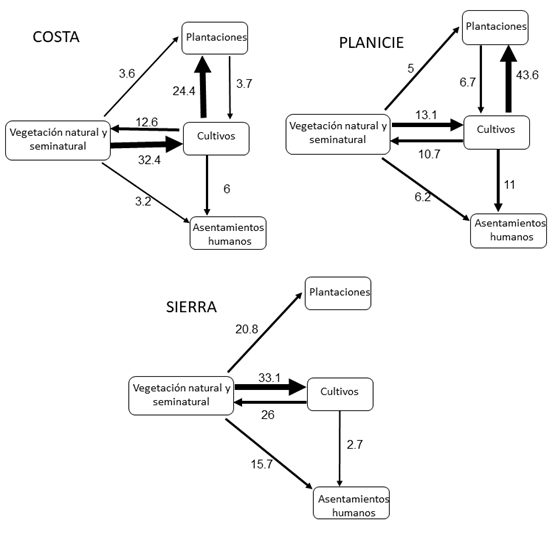
Vegetación natural y seminatural = Natural and semi-natural vegetation; Plantaciones = Plantations; Cultivos = Crops; Asentamientos humanos = Human settlements.
The thickness of the arrow indicates the magnitude of change. Figures show the percentage contribution of each transition; the total (100 %) is the sum of all areas that underwent a change in coverage between 1990 and 2015. Only the main changes are shown.
Figure 3 Dominant processes of land cover change in the three productive landscapes, in the 1990-2015 period.
In the plains, the productive systems with the highest economic value for the Soconusco region are concentrated: mango, banana, and oil palm plantations, as well as the main population centers. The dominant process in this area was the replacement of crops by plantations (16 026 ha).
In the Sierra, fragments with forest vegetation and coffee agroforestry systems predominate; the most reported changes were the substitution of natural and semi-natural vegetation by crops.
Discussion
Land cover and land use maps
The results of the maps show several aspects to be highlighted in the changes observed in the landscapes during the analysis period: deforestation, substitution of agricultural crop areas by plantations and the expansion of urban areas.
Deforestation is an important process in the study area, although not of the magnitude observed in other regions of the country (Ellis et al., 2021). However, it did affect such vegetation types as mountain mesophilic forests and mangroves, which are crucial not only for their biological diversity, but also for their key role in mitigating climate change (Adame et al., 2018).
Frequently, research carried out at the international (Bürgi et al., 2004; Belay y Mengistu 2019; Tuffour-Mills et al., 2020) and national levels (Rosete et al., 2008; Mas and Flamenco, 2011; Calzada et al., 2018;) agrees that the main processes of change are due to the conversion of forests and secondary vegetation to agricultural and livestock uses. In this region, due to its climatic characteristics, another process has also occurred: deforestation from the loss of shaded coffee agroforestry systems.
Given their moderate environmental impact, it has traditionally been considered that coffee agroforestry systems can coexist in high biodiversity regions, which contributes to their conservation. However, a fragile balance in which grain prices (Jurjonas et al., 2016) and pests (Henderson, 2019) trigger the loss or degradation of forest cover underpins the permanence of these systems. The growth of coffee plantations without shade may be a response to the phenomenon observed by Henderson (2019) in other regions of Chiapas, where, in order to fight rust, coffee varieties that are sensitive to this fungus have been replaced by others with greater resistance, but which do not require the shade of trees.
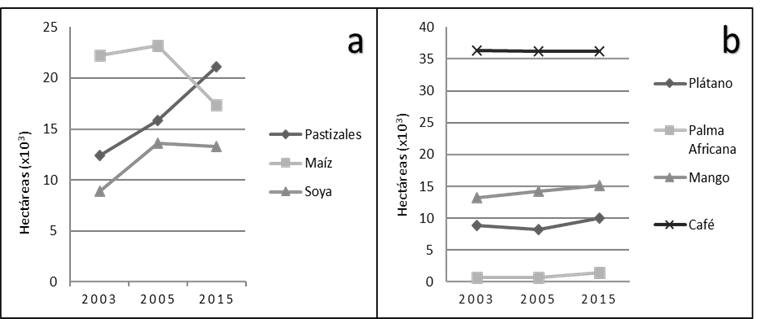
The replacement of agricultural crop areas with plantations was another one of the changes observed; in this sense, SIAP (2020) agricultural production statistics confirm the pattern of land use change observed in the maps. Agricultural production data show a decrease in corn area (Figure 4), which went from 22 223 ha in 2003 to 18 048 ha in 2014. A similar trend is observed in soybean production. While pastures grew strongly, from 12 378 ha to 18 149 ha, perennial crops in general showed a slight increase in their extensions, except for coffee and cocoa (SIAP, 2020).
This pattern of reduction of areas devoted to the production of staple crops seems to be related to the phenomenon, observed at the national level, of increasing dependence on the importation of basic grains as an effect of the Free Trade Agreement (Valencia et al., 2019).
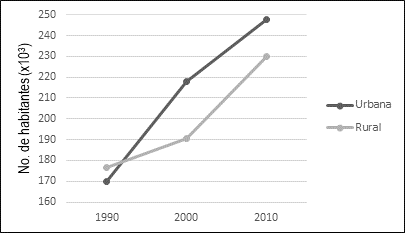
Finally, the expansion of urban areas observed in the maps also coincides with census data, since the region experienced moderate population growth from 1990 to 2010, with a population growth rate of 1.63 %, which represented 346 000 inhabitants in 1990, and 477 800 in 2010 (INEGI, 1990; INEGI, 2010), concentrated in the urban areas of the country (Figure 5). At the cartographic level, which was reflected in an expansion of human settlements, the area of this category tripled from 4 000 to 12 000 ha, mainly because of the expansion of the city of Tapachula.
Productive transformations by type of landscape
The dominant process on the coast was the loss of natural and semi-natural vegetation due to the expansion of agricultural crops and plantations. Agricultural production data obtained from SIAP (2020) confirmed a strong growth of cultivated pastures in the municipality of Suchiate (from 600 to 5 000 ha) and a strong deforestation in the period studied. The rapid expansion of these activities into hydrophilic vegetation areas is a cause of concern because it increases the risk of deterioration or deforestation of the mangroves (Barrasa, 2017).
In the Plains, the dominant process of change was the conversion of agricultural crops into agricultural plantations (banana, mango, oil palm). Oil palm is an attractive product for farmers because of the growing demand in the food industry market, the increase in prices and the public programs that support its establishment (Fletes-Ocón and Bonnano, 2015; Castellanos, 2018).
At the national level, Chiapas is the state with the largest area cultivated with oil palm, with a little more than 45 000 ha (SIAP, 2020), located in the economic regions: Rain Forest, Coast, and Soconusco; also, there are 11 oil extraction plants, six of them located in Soconusco (Castellanos, 2018).
Apparently, the deforestation processes observed in the mountain range are due to the conversion of forest areas into annual agricultural crops (Cortina-Villar et al., 2012) and to the transformation of shade coffee plantations (agroforestry system) into unshaded coffee plantations (Henderson, 2019). According to the maps generated in this study, in 1990 there was an area of 200 ha of unshaded coffee, which quadrupled in 2015, ―a figure that may be even higher due to the high spectral confusion registered in this category (Table 2).
Evidence cited in other papers points in the same direction. Henderson (2019) and Jurjonas et al. (2016) find that coffee agroforestry systems are highly susceptible to price variations and diseases. In recent years, coffee rust mainly affects agroforestry systems (Henderson, 2019); therefore, one of the strategies promoted to deal with it, the use of coffee plant varieties resistant to the pathogen, but that do not require the shade provided by the forest canopy (Jha et al., 2011). This has resulted in a loss of tree cover, which coincides with the decrease in disturbed forests observed in this study.
Conclusions
Maps with high spatial and thematic detail allow a better understanding of land use change processes; in addition to quantifying the trajectories of change, it is possible to generate hypotheses about the potential causes of landscape transformation.
The pattern of land cover change and the agricultural and demographic statistics indicate that the study region is undergoing a process of agricultural intensification and urbanization. The trend in the loss of natural and semi-natural vegetation, including mangroves and agroforestry systems, is also a cause for concern.
Acknowledgments
The authors are grateful to the INEGI-CONACYT Sectoral Fund (Fondo Sectorial INEGI-CONACYT) for the financing granted through the project "Spatio-temporal analysis of landscape vulnerability using remote sensing and spatial methods (210080)"; to Ecosur for the support provided for fieldwork through project 1106311262 Innovación Socio ambiental GIEZCA, and to Edith Mondragón for editing the maps
REFERENCES
Adame, M. F., C. J. Brown, M. Bejarano, J. A. Herrera-Silveira, P. Ezcurra, J. B. Kauffman and R. Birdsey. 2018. The undervalued contribution of mangrove protection in Mexico to carbon emission targets. Conservation Letters 11:e12445. Doi:10.1111/conl.12445. [ Links ]
Ayanlade, A. y M. T. Howard. 2017. Understanding changes in a Tropical Delta: A multi-method narrative of landuse/landcover change in the Niger Delta. Ecological Modelling 364: 53-65. Doi:10.1016/j.ecolmodel.2017.09.012. [ Links ]
Barrasa G., S. 2017. De montaña, milpa y cañaveral. Transformaciones percibidas de los paisajes en la costa de Chiapas. Investigaciones geográficas 83: 95-109. Doi:10.14350/rig.54775. [ Links ]
Bürgi, M., A. M. Hersperger and N. Schneeberger. 2004. Driving forces of landscape change - current and new directions. Knee Surgery and Related Research 30(3): 261-268. Doi: 10.5792/ksrr.17.008. [ Links ]
Belay, T. and D. A. Mengistu. 2019. Land use and land cover dynamics and drivers in the Muga watershed, Upper Blue Nile basin, Ethiopia. Remote Sensing Applications: Society and Environment 15:100249. Doi: 10.1016/j.rsase.2019.100249. [ Links ]
Challenger, A. y R. Dirzo. 2009. Factores de cambio y estado de la biodiversidad. In: Capital Natural de México, vol. II. Estado de conservación y tendencias de cambio. Conabio. México, D.F., México. pp.37-73. [ Links ]
Calzada, L., J. A. Meave, C. Bonfil and F. Figueroa. 2018. Lands at risk: Land use/land cover change in two contrasting tropical dry regions of Mexico. Applied Geography 99: 22-30. Doi: 10.1016/j.apgeog.2018.07.021. [ Links ]
Castellanos N., A. 2018. Palma de aceite en tierras campesinas: la política de las transformaciones territoriales en Chiapas, México. Revista Pueblos y fronteras digital 13:e-357. Doi: 10.22201/cimsur.18704115e.2018.v13.357. [ Links ]
Cochard, H. and S. Delzon. 2013. Hydraulic failure and repair are not routine in trees. Annals of Forest Science 70(7): 659-661. Doi: 10.1007/s13595-013-0317-5. [ Links ]
Corona, R., L. Galicia, J. L. Palacio-Prieto, M. Bürgi and A. Hersperger. 2016. Local deforestation patterns and driving forces in a tropical dry forest in two municipalities of southern Oaxaca, Mexico (1985-2006). Investigaciones Geográficas 91:86-104. Doi: 10.14350/rig.50918. [ Links ]
Cortina-Villar, S., H. Plascencia-Vargas, R. Vaca, G. Schroth, Y. Zepeda, L. Soto-Pinto and J. Nahed-Toral. 2012. Resolving the conflict between ecosystem protection and land use in protected areas of the Sierra Madre de Chiapas, Mexico. Environmental Management 49:649-662. Doi: 10.1007/s00267-011-9799-9. [ Links ]
Defries, R. S., T. Rudel, M. Uriarte and M. Hansen. 2010. Deforestation driven by urban population growth and agricultural trade in the twenty-first century. Nature Geoscience 3(3): 178-181. Doi:10.1038/ngeo756. [ Links ]
Flanders, D., M. Hall-Beyer and J. Pereverzoff. 2003. Preliminary evaluation of eCognition object-based software for cut block delineation and feature extraction. Canadian Journal of Remote Sensing 29(4): 441-452. Doi:10.5589/m03-006. [ Links ]
Flores, M. L., 2019. Los alcances en la producción agrícola chiapaneca. Una reflexión sobre la soberanía alimentaria en la región. Región y Sociedad 31:e1177. Doi:10.22198/rys2019/31/1177. [ Links ]
Ellis, E. A., A. Navarro-Martínez and M. García-Ortega. 2021. Drivers of forest cover transitions in the Selva Maya, Mexico: Integrating regional and community scales for landscape assessment. Land Degradation and Development 32(7):1-20. Doi: 10.1002/ ldr.3972. [ Links ]
ENVI. 2015. Feature Extraction with Example-Based Classification Tutorial. https://www.harrisgeospatial.com/docs/FXExampleBasedTutorial.html (20 de mayo 2015). [ Links ]
Fletes-Ocón, H. y A. Bonanno. 2015. Respuestas a la crisis de la globalización neoliberal: intervención del Estado en la producción de aceite de palma en Chiapas, México. Carta Económica Regional 27(116): 5-35. https://www.researchgate.net/publication/311583943_Respuestas_a_la_crisis_de_la_globalizacion_neoliberal_intervencion_del_estado_en_la_produccion_de_aceite_de_palma_en_Chiapas_Mexico/ (20 de mayo de 2015). [ Links ]
Gao, J. 2009. Digital Analysis of Remotely Sensed Imagery I. McGraw-Hill. https://www.accessengineeringlibrary.com/browse/digital-analysis-of-remotely-sensed-imagery (27 de julio de 2015). [ Links ]
Geist, H. J. and E. F. Lambin. 2002. Proximate Causes and Underlying Driving Forces of Tropical Deforestation. BioScience 52(2): 143-150. Doi:10.1641/0006-3568(2002)052[0143:PCAUDF]2.0.CO;2. [ Links ]
Grau, R. H. and M. Aide. 2008. Globalization and Land-Use Transitions in Latin America. Ecology and Society 13(2): 16. http://www.ecologyandsociety.org/vol13/iss2/art16/ (21 de mayo de 2021). [ Links ]
Henderson, T. 2019. La roya y el futuro del café en Chiapas. Revista Mexicana de Sociología 81: 389-416. [ Links ]
Instituto Nacional de Estadística, Geografía e Informática (INEGI). 2001. Conjunto de datos vectoriales fisiográficos. Conjunto nacional escala 1:1000 000, serie I. https://datos.gob.mx/busca/dataset/conjunto-de-datos-vectoriales-fisiograficos-continuo-nacional-escala-1-1-000-000-serie-i (15 de enero de 2015). [ Links ]
Instituto Nacional de Estadística, Geografía e Informática (INEGI). 1990. Censo General de Población y Vivienda 1990. https://www.inegi.org.mx/programas/ccpv/1990/ (18 de mayo de 2021). [ Links ]
Instituto Nacional de Estadística, Geografía e Informática (INEGI). 2000. Censo General de Población y Vivienda 2000. https://www.inegi.org.mx/programas/ccpv/2000/#Tabulados (18 de mayo de 2021). [ Links ]
Instituto Nacional de Estadística, Geografía e Informática (INEGI). 2010. Censo General de Población y Vivienda 2010. https://www.inegi.org.mx/programas/ccpv/2010/#Tabulados (18 de mayo de 2021). [ Links ]
Jha, S., C. M. Bacon, S. M. Philpott, R. A. Rice, V. E. Mendez and P. Läderach. 2011. A Review of Ecosystem Services, Farmer Livelihoods and Value Chains in Shade Coffee Agroecosystems. In: Campbell, B. W. and Ortíz L., S. (eds.). Integrating agriculture, conservation and ecotourism: examples from the field. Springer Science & Business Media. Dordrecht, Netherlands. pp. 141-208. Doi: 10.1007/978-94-007-1309-3. [ Links ]
Jurjonas, M., K. Crossman, J. Solomon and W. López. 2016. Potential Links Between Certified Organic Coffee and Deforestation in a Protected Area in Chiapas, Mexico. World Development 78:13-21. Doi: 10.1016/j.worlddev.2015.10.030. [ Links ]
Klooster, D. 2003. Forest Transitions in Mexico: Institutions and Forests in a Globalized Countryside. The Professional Geographer 55(2):227-237. Doi:10.1111/0033-0124.5502010. [ Links ]
Mas J., F. y A. Flamenco S. 2011. Modelación de los cambios de coberturas/uso del suelo en una región tropical de México. GeoTrópico 5(1): 1-24. Doi:10.2967/jnumed.114.147413. [ Links ]
Newbold, T., L. N. Hudson, A. P. Arnell, S. Contu, A. Palma, S. Ferrier, S. Hill, A. J. Hoskins, I. Lysenko, H. R. Phillips, V. J. Burton, C. W. Chng, S. Emerson, D. Gao, G. Pask H., J. Hutton, M. Jung, K. Sanchez O., B. I. Simmons, S. Whitmee, J. P. Scharlemann, A. Purvis and H. Zhang. 2016. Has land use pushed terrestrial biodiversitybeyond the planetary boundary?Aglobal assessment. Science 353(6296):288-291. Doi:10.1126/science.aaf2201. [ Links ]
Olofsson, P., G. M. Foody, M. Herold, S. V. Stehman, C. E. Woodcock and M. A. Wulder. 2014.Good Practices for Estimating Area and Assessing Accuracy of Land Change, Remote Sensing of Environment 148:42-57. Doi:10.1016/j.rse.2014.02.015. [ Links ]
Park, J. and J. Lee . 2016. Detection of land use/land cover changes using remotely-sensed data. Journal of Forestry Research 27(6): 1343-1350. Doi:10.1007/s11676-016-0270-x. [ Links ]
Organización de las Naciones Unidas para la Alimentacion y la Agricultura (FAO). 2015. Evaluación de los Recursos Forestales Mundiales 2015. ¿cómo estan cambiando los bosques en el mundo? Segunda edición. Roma. Italia. 54p 54p https://snigf.cnf.gob.mx/wpcontent/uploads/The_Global_Forest_Resources_Assesment_(FRA)/Evaluacion_de_los_recursos_forestales_mundiales_FRA-%202015.pdf (15 de abril de 2015) [ Links ]
Rautner, M., M. Leggett and F. Davis. 2013. Pequeño Libro de las Grandes Causas de la Deforestación. Programa Global Canopy: Oxford. Ed Global Canopy. Oxford, UK. 118 p [ Links ]
Rosete-Vergés F., J. L. Pérez-Damián, M. Villalobos-Delgado, E. N. Navarro-Salas, E. Salinas-Chávez y R. Remond-Noa. 2014. El avance de la deforestación en México 1976-2007. Maderas y Bosques 20(1): 21-35. Doi: 10.21829/myb.2014.201173. [ Links ]
Servicio de Información Agroalimentaria y Pesquera (SIAP). 2020. Reporte de siembras y cosechas por cultivo, Servicio de Información Agroalimentaria y Pesquera. datos entre 2004 y 2020. http://infosiap.siap.gob.mx:8080/agricola_siap_gobmx/ResumenDelegacion.do (18 de mayo de 2021). [ Links ]
Tuffour-Mills, D., P. Antwi-Agyei and P. Addo-Fordjour. 2020. Trends and drivers of land cover changes in a tropical urban forest in Ghana. Trees, Forests and People 2. Doi: 10.1016/j.tfp.2020.100040. [ Links ]
Valencia R., R., H. Sánchez B. y D. Robles O. 2019. Soberanía Alimentaria de granos básicos en México: un enfoque de cointegración de Johansen a partir del TLCAN. Análisis Económico 34(87): 223-248. [ Links ]
Vliet, N., O. Mertz, A. Heinimann, T. Langanke, U. Pascual, B. Schmook and A. Ziegler. 2012. Trends, drivers and impacts of changes in swidden cultivation in tropical forest-agriculture frontiers: A global assessment. Global Environmental Change 22(2): 418-429. Doi: 10.1016/j.gloenvcha.2011.10.009. [ Links ]
Received: March 23, 2020; Accepted: February 17, 2021
 Este es un artículo publicado en acceso abierto bajo una licencia Creative Commons
