


Servicios Personalizados
Revista
Articulo
 texto en
  Inglés (pdf)
 Artículo en XML
 Referencias del artículo
 Enviar artículo por email
Indicadores
-
 Citado por SciELO
 -
 Accesos
Links relacionados
-
 Similares en
SciELO
Similares en
SciELO
Compartir

 Permalink
Revista mexicana de ciencias forestales
versión impresa ISSN 2007-1132
Rev. mex. de cienc. forestales vol.9 no.50 México nov./dic. 2018
https://doi.org/10.29298/rmcf.v9i50.227
Articles
Structure and composition of the vegetation in four sites of the Sierra Madre Occidental
1División de Estudios de Posgrado. Instituto Tecnológico de El Salto. México.
2Facultad de Ciencias Forestales. Universidad Autónoma de Nuevo León. México.
3Centro de Investigación en Alimentación y Desarrollo, A.C. México.
The structure and composition of tree species were evaluated in the Sierra Madre Occidental, in the area of El Salto, Pueblo Nuevo, state of Durango, Mexico. Four study sites (2 500 m2) were established, where 10 plots of 100 m2 were randomly located. The registered variables were individual height (m), diameter at breast height (cm), and projected crown area (m2). The dominance of each species was quantitated according to its basal area, and its density, according to the number of individuals. The importance value index (IVI) was then calculated. The diversity and species richness were estimated using the Shannon-Wiener diversity index (H') and the Margalef index (DMg), respectively, and Bray-Curtis ordination was utilized to obtain the similarity between sites. The results show that there were 18 tree species belonging to 9 genera. The Santa Bárbara site exhibited the largest number of species (9), while ejido Adolfo Ruíz Cortines had the smallest (6 species). Quercus sideroxyla is the most ecologically important species in ejido Adolfo Ruíz Cortines and ejido El Brillante, followed by Quercus durifolia in S2, and Pinus cooperi was the most important species in the Santa Bárbara reserve site. Santa Bárbara had the highest Shannon diversity index (1.51), and ejido Banderas had the lowest (0.93). The highest values for the Margalef index (1.79) corresponded to the Santa Bárbara reserve site (S4), and the lowest (0.97), to ejido El Brillante (S2). The Bray-Curtis ordination revealed similarity (25.59 %) between ejido Adolfo Ruíz Cortines and ejido El Brillante, indicating a tendency to heterogeneity.
Key words: Heterogeneity; Margalef index; Shannon-Wiener index; importance value index; Bray-Curtis ordination; species richness
Con el objetivo de evaluar la estructura y composición de especies en bosques de El Salto, Pueblo Nuevo, Durango, se establecieron cuatro sitios de estudio (2 500 m2), donde se ubicaron aleatoriamente 10 parcelas de 100 m2. Las variables registradas fueron altura (m), diámetro a la altura de pecho (cm) y área de copa (m2); la dominancia se calculó a partir del área basal y la densidad, de acuerdo con el número de árboles; se determinó el índice de valor de importancia (IVI). La diversidad y la riqueza de especies se estimaron utilizando los índices de Shannon-Wiener (H´) y Margalef (DMg). La similitud se obtuvo con el modelo de Bray-Curtis. Se identificaron 18 especies distribuidas en nueve géneros. El sitio 2 presentó la mayor diversidad (9 especies), y el de menor correspondió al S1 (6 taxones). En este y en el S3, Quercus sideroxyla registró el valor más alto de importancia ecológica; en S2, le correspondió a Quercus durifolia y en S2 a Pinus cooperi. El índice de Shannon-Wiener (1.51) y el de Margalef (1.79) más grandes se obtuvieron en este último sitio y el menor (0.93) en el ejido Banderas; mientras que el más bajo (0.97) para el de Margalef en el ejido El Brillante. El modelo de Bray-Curtis evidenció semejanza entre S1 y S3, con un valor de 25.59 %. Valores que indican tendencia a la heterogeneidad de los sitios.
Palabras clave: Heterogeneidad; índice de Margalef; índice de Shannon-Wiener; índice de valor de importancia; modelo de ordenación Bray-Curtis; riqueza de especies
Introduction
Mexico is one of the 10 countries with the greatest biodiversity and the largest surface area of primary forests in the world. It occupies the fourth place in species richness (Semarnat, 2011). It has a tree-covered surface area of over 64.8 million hectares of which 52 % correspond to temperate forests (Challenger, 1998; Conafor, 2012), distributed in the Sierra Madre Oriental (Eastern Mountain chain), the Sierra Madre Occidental (Western Mountain chain) and the Sierra Madre del Sur (Southern Mountain Chain) (FAO, 2005; Granados et al., 2007).
The Sierra Madre Occidental (WSM) is the largest mountain complex in Mexico; it stretches along almost 1 200 km from northeastern Sonora (30°35' N) to northern Jalisco (21°00' N). Despite its great environmental and economic importance, its composition and structure are still not well-known (González-Elizondo et al., 2012; Graciano-Ávila et al., 2017a).
The classification of vegetation units and types is an important tool for improving the management, exploitation and conservation of the ecosystems (González-Elizondo et al., 2012).
Durango is one of the most prominent Mexican states, due to its timber production and to the conservation of its resources; among the regions of this state, El Salto stands out for its forests with sparsely distributed conifers, including the Picea, Abies, and Pseudotsuga genera (Aguirre et al., 2003).
The vegetation structure refers to the distribution of the tree component, in both the vertical and horizontal planes. Basically, the horizontal structure is given by the mensuration distribution (basal area and volume per diametric category), as well as by the abundance, frequency and dominance. The basal area is a useful indicator of the productive potential of a forest (Finegan, 1992). The composition describes the number of families, genera and species within the forest at the time of the inventory. The components considered to best complement the information regarding the composition are diversity, species richness, and similarity between the species, among others (Louman et al., 2001).
Although the conservation of diversity is a part of forest management, there is evidence that this and the dimensional structure of the taxa have changed dramatically due to the dynamics of the ecosystem, as a result of the effects of both natural events and anthropic activities, such as cyclones, hurricanes, tornadoes, pests, diseases, forest exploitation, changes in soil use, and forest fires (Vetaas and Chaudhary, 1998; Hernández et al., 2013; Medrano et al., 2017).
The studies carried out by García-Arévalo (2008), Valenzuela and Granados (2009), De León et al. (2013), Delgado et al. (2016) and Medrano et al. (2017) stand out among the quantitative studies describing the composition and structure of the vegetation in the WSM. Although the El Salto region of Durango includes various topographic conditions that are characteristic of mountainous areas, there is little information about the composition and structure of its species; such information would be a significant contribution to our knowledge for the aim of incorporating them to conservation or forest exploitation programs. Therefore, according to the theoretical assumptions that frame the present research, there are no differences in the composition or structure of the vegetation in the study sites.
For this reason, several recorded measures, including the mensuration parameters total height (m) and crown diameter (m2) were quantified; crown diameter was estimated based on the length (north-south) multiplied by the width (east-west) of the crown of each individual tree, in order to calculate the partial and total cover of the species existing in each site.
The ecological indicators of abundance (A), dominance (D), frequency (F) and importance value (IV) were determined, and the results were compared among sites. Thus, the objective of the present research was to describe the structure and composition of the vegetation in four sites of the WSM, Mexico, in order to contribute to the biological knowledge of this area as a helpful instrument for the conservation and sustainable management of forest ecosystems.
Materials and Methods
The study was carried out in the summer of the year 2016, at four sites located in the state of Durango, Mexico (Figure 1). Site 1 (S1) was Adolfo Ruíz Cortines, in the municipality of Pueblo Nuevo, Durango; it is located at the geographical coordinates 23°44’39.82’’ N and 105°18’23.99’’ W, and at an altitude between 2 450 and 2 650 m, on a surface area of 4 223.83 ha. Its climate is temperate subhumid with summer rains, and it has a winter precipitation of 5 to 10.2 mm; its mean annual temperature is 18 °C, and its mean annual precipitation, 800 mm (García, 1981).
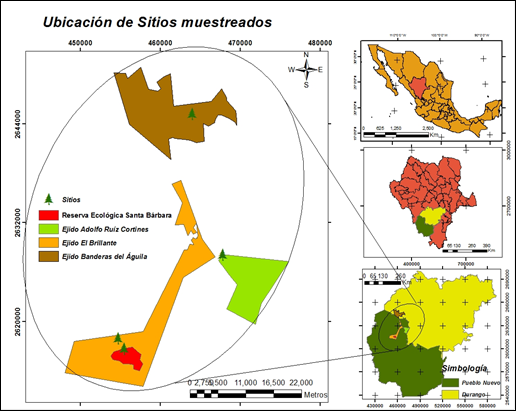
The soil types in this site are Lithosol and Regosol. The main plant communities consist of mixed forests including species of the genera Pinus and Quercus, plus a few shrubs; the most representative vegetation types are pine, pine-oak and oak-pine forests (INEGI, 2010).
Site 2 was Banderas del Águila (S2), in the municipality of Durango, located at the coordinates 23°58´33.01’’ N and 105°22´54.99” W, at an altitude of 2 400 m, on a surface of 2 100 ha. The climate is semicold-temperate subhumid, with an annual temperature ranging between 0 and 22 °C, and an annual precipitation of 400 to
1 200 mm (García, 1981). The soil types are Lithosol, Regosol and Cambisol, with a mean depth of 10 cm, a medium texture, and 18 % rockiness (INEGI, 2010). The predominant vegetation types are Pinus ayacahuite Ehrenb. ex Schltdl., Pinus cooperi C.E. Blanco, Pinus durangensis Martínez, Pinus leiophylla Schiede ex Schltdl. & Cham., Pinus teocote Schiede ex Schltdl. & Cham., Quercus durifolia Seemen ex Loes, Quercus rugosa Née, and Quercus sideroxyla Bonpl. forests (INEGI, 2010).
Site 3, El Brillante (S3), belongs to the municipality of Pueblo Nuevo, Durango; it is located at 23°40’30” N and 105°30’30” W, at an altitude ranging between 2 670 and 2 750 m. According to García (1981), its predominant climates are semicold subhumid with summer rains and temperate subhumid with summer rains. Its mean annual precipitation is 1 200 mm, and it covers a surface area of 9 516 ha. According to INEGI (2010), the prevailing soil types are Cambisol, Regosol and Lithosol. The vegetation corresponds to Pinus and Quercus forests, with shrubs like Arctosta phylos pungens Kunth and Quercus microphylla Née (INEGI, 2010).
Site 4, Santa Bárbara (S4), is located at the coordinates 23°39’39.12’’ N and 105°26’7.03’’ W, almost 24 km north of the Tropic of Cancer, and approximately 23 km south of El Salto, at an altitude of 2 721 m, and on a surface area of 65 ha; its mean annual precipitation is 800 mm (García, 1981); its predominant soil types are Lithosol and Regosol. The valley of Santa Bárbara has a permanent current and is protected against dry winds. Three conifer species grow in this particular site -Picea chihuahuana Martínez, Abies durangensis Martínez, and Pseudotsuga menziesii Mirb. (Franco)-, on a limited area of nearly 20 ha. These taxa are rare in Mexico, and in Durango they are protected remnants with a high degree of conservation. The presence of Picea chihuahuana is particularly significant. The proximity of this stand to the Tropic of Cancer provides a rarely occurring climate for the development of the genus Picea; only another one of its species can be found in Asia, at a locality with a similar altitude (Gordon, 1968). The area corresponding to the Santa Bárbara plot is not under management because it was declared a Protected Natural Area at state level in the year 2018.
The plots established in Adolfo Ruíz Cortines, Banderas del Águila and El Brillante have a forest management program consisting in selective felling (SF) silvicultural treatments, characterized by two conditions: the stands are not even-aged, and regeneration never loses the protection (or the competition) of the older age classes around it. The method involves extracting from individual trees (or small groups of trees), and the regeneration that grows in their place requires tolerant species capable of establishing and surviving under the conditions of these small openings in the stand canopy.
In the management units intervened with selective felling (SF), the felling targets mainly those categories with larger diameters, and is a priority in those individuals that are infested by pests, ill or physically damaged, suppressed or standing dead. However, under high density conditions, removal of trees of all diameter categories becomes necessary (UMAFOR, 2010).
Vegetation composition and structure
Ten 10 m × 10 m random sampling plots were selected in each study site, within a previously established plot (2 500 m2) representative of the site in question. The geographical location was registered using a Garmin Rino 650 GPS navigator. García et al. (2010) and Alanís-Rodríguez et al. (2011) used similar sampling dimensions to characterize the tree vegetations in temperate forests of Colombia and in northern Mexico, respectively.
During the summer of 2016, the density was quantified by plant species in each unit (only when at least half of an individual was located within the boundaries of the sampling unit); the following mensuration parameters were measured: normal diameter (d, cm, HaglöfTM Mantax Blue 950 Mm forest caliper), total height (h, m, Vertex IV Laser HaglöfTM HS102 hypsometer), and crown canopy (m2 ha-1, CM112 50 m Truper TM measuring tape). The crown canopy was estimated based on the length (north-south) and the width (east-west) of each crown, in order to calculate the partial and total cover of all the species present at each site.
The ecological indicators of abundance (A), dominance (D), frequency (F), and importance value (IV) were determined (Brower et al., 1997; Magurran, 2004). The Shannon-Wiener Diversity Index was utilized to determine the diversity of species (Matteucci et al., 1999). The application of the index requires that the sampling be random, and that all the species of a plant community be present in the sample (Mostacedo and Fredericksen, 2000).
The beta diversity was estimated based on a Bray-Curtis ordination model, which is a graphic representation of the variation in the plant composition. The analysis is based on an algorithm that allows analyzing the similarity between samples through the estimation of the similarity percentage (0-100 %) within a distance measure (Beals, 1984). This is one of the most appropriate methods for the phytosociological, multivariate analysis; it was developed using BioDiversity Pro 2.0 software (McAleece et al., 1997).
The dominance of the species was estimated based on the coverage data (Matteucci and Colma, 1982; Heiseke and Foroughbakhch, 1985).
Statistical analysis
One way analysis of variance was applied to the Shannon-Wiener diversity index and to the Margalef species richness index (Steel and Torrie, 1980). According to the Kolmogorov-Smirnov and Shapiro-Wilk statistical tests (with the correction by Lilliefors) and Levene statistical tests (Brown and Forsythe, 1974), the data exhibited homogeneity of variances and a normal distribution. They were statistically analyzed using the Tukey mean comparison test with a significance level of p=0.05 (Steel and Torrie, 1980), in order to detect differences between the means of the Shannon-Wiener diversity index and the Margalef species richness index of the sites (Steel and Torrie, 1980; Ott, 1993). All the statistical procedures were carried out using the Statistical Package for the Social Sciences, standard version 13.0 for Windows, SPSS Inc., Chicago, IL USA) (SPSS, 2004).
Results and Discussion
Floristic composition
A total of 1 020 individual trees and shrubs were registered, with an average height of 6.2 m for the four sites, and 18 species belonging to six families were identified. Of these, the richest ones were Pinaceae (10), Fagaceae (3), Cupressaceae (2), and Ericaceae (2), which group 94 % of the registered taxa. The Betulaceae family had only one taxon. The families with the largest number of genera were Pinaceae, with 4, and Cupressaceae, with 2, which together account 66 % of the total genera registered at the four study sites. The remaining families included only one genus each. Outstanding species were Pinus (7), Quercus (3), and Arbutus (2); Abies, Alnus, Picea, and Pseudotsuga had one taxon each.
The families Pinaceae, Fagaceae and Ericaceae stood out at the four sites for their number of individuals-393, 486 and 76, respectively-, while Cupressaceae had 47, and Betulaceae, only 18. S1 and S3 had the largest number of families (5), followed by S2 (4) and S4 (3). The sites most abundant in genera (5) were S1 and S3, followed by S2 (4) and S4, where three genera were identified. Nine species were identified at S4, eight at S1 and at S2, and six at S3. Quercus sideroxyla was the best represented species at S3 (323) and S1 (81). Q. durifolia (69) was best represented at S2, and Pinus cooperi (58), at S4. Only one individual was registered for each of the species Alnus acuminate Kunth, Pinus cooperi and Quercus rugosa at S1 and S2; Quercus sideroxyla registered 4 at S4, and Alnus acuminata, nineteen at S3. Of the 1 020 quantified individuals, the site with the highest number of specimens was S3 (512), followed by S1 (206), S4 (168), and S2 (134).
Prominent floristic studies carried out in the WSM are those by De León et al. (2003), García-Arévalo (2008), Valenzuela and Granados (2009), Aragón-Piña et al. (2010), Delgado et al.(2016), and Graciano-Ávila et al. (2017b), according to whom Pinaceae and Fagaceae are the most abundant families; Sánchez-González (2008) and González-Elizondo et al. (2012) point out that the high abundance of these families is due to the fact that they include 46 % of the pine species and 34 % of the oak species of Mexico. Likewise, they have been confirmed to be the dominant species in the forests of Durango (Graciano-Ávila et al., 2017a), and Zúñiga et al. (2018) have recently documented higher importance values for Pinus and Quercus.
Both families are of enormous economic interest in the forest ecosystems of the country, from which, respectively, 129 (80.1 %) and 141 (8.8 %) million m3 of roundwood were extracted in the years 1900-2012, adding up to 94.8 % of the national timber production (Semarnat, 2014). Other studies (Mendoza, 1993; Gavilán and Rubio, 2005) point out that this dominance may be due to silvicultural treatments geared at creating the adequate conditions -particularly of radiation- for the establishment of the commercially desirable species, whereby the number of species in the ecosystem is minimized.
Under traditional forest management conditions, there is insufficient control over the process or the functioning of the system to maintain the diversity of species -an essential requirement for sustainable forest management (Kazana et al., 2005). For this reason, an adequate silvicultural treatment has an effect over the composition and structure of the forests and produces wood and other environmental services (Promis et al., 2010).
Diversity of species in the study sites
The analysis of variance test detected significant differences in the diversity of species between sites and for the combination of sites (Table 1), due to the absence of similarity, at least in one site, in the species richness and the number of individuals.
Table 1 Results of the analysis of variance for the Shannon-Wiener diversity index and the Margalef species richness index.
| Index | Variation source | Sum of squares | Degrees of freedom | Mean square | F value | P value |
|---|---|---|---|---|---|---|
| Shannon-Wiener | Between sites | 2.004 | 3 | 0.668 | 12.265 | <0.001 |
| Within sites | 1.960 | 36 | 0.054 | |||
| Total | 3.964 | 39 | ||||
| Margalef | Between sites | 4.663 | 3 | 1.554 | 19.114 | <0.001 |
| Within sites | 2.928 | 36 | 0.081 | |||
| Total | 7.591 | 39 |
Therefore, S3 (512) stands out for the number of individuals contained in it, and is followed by S1 (206), S4 (168) and S2 (134). This tendency coincides with the interval registered by Aragón-Piña et al. (2010), Delgado et al. (2016) and Graciano-Ávila et al. (2017b); on the other hand, Návar-Cháidez and González-Elizondo (2009), Ramírez et al. (2003), and López-Hernández et al. (2017) estimated a lower average.
Table 2 illustrates the mean comparison test for the Shannon-Wiener diversity index and the Margalef species richness index.
Table 2 Shannon-Wiener diversity index and Margalef species richness index for the four study sites.
| Study site | Index | |
|---|---|---|
| Shannon-Wiener | Margalef | |
| Adolfo Ruíz Cortines | 1.357±0.067ab | 1.426±0.075b |
| Banderas del Águila | 1.102±0.063bc | 0.986±0.109c |
| El Brillante | 0.934±0.079c | 9.970±0.109c |
| Santa Bárbara | 1.512±0.083a | 1.793±0.053a |
The values represent the mean ± standard error (n=10). Values with different letters in the same column differ statistically, with a significance level of p=0.05, according to Tukey’s mean comparison or DHS test.
The Shannon-Wiener species diversity index was 0.93 (S2), 1.10 (S3), 1.35 (S1), and 1.51 (S4). The Margalef species richness index was 0.97 (S3), 0.98 (S2), 1.42 (S1), and 1.79 (S4). The average for the four study sites was 1.29 and 1.22, respectively. The main taxa were Pinus leiophylla and Pinus durangensis, which means that they have a greater structural dominance and a higher level of competitiveness.
According to Margalef (1972), Magurran (2004) and Ramírez (2006), the diversity is considered to be low when the values are below 2, medium when they are 3 to 5, and high when they are above 5. Consequently, the diversity at the study sites is low, like in the El Salto region of Durango (Návar-Cháidez and González-Elizondo, 2009; Delgado et al., 2016; Graciano-Ávila et al., 2017a; Medrano et al., 2017), with diversity values of 1.33, 1.19, 1.81, and 1.94, respectively.
The variation in the diversity of species is determined by the edaphoclimatic and ecological conditions and by the conversion of the land to extensive agriculture and livestock breeding, as well as to various anthropic activities, all of which lead to the presence of a variety of plant communities (Aragón-Piña et al., 2010; Alanís-Rodríguez et al., 2011; Ramírez et al., 2013; López-Hernández et al., 2017).
Site 4 had the greatest diversity; according to Gordon (1968) this may be due to its location within a valley that has a permanent current, is protected against dry winds, and is surrounded to the south and the east by a plateau of pine forests, and to the west, by a steep slope, a depression known as Quebrada del Infierno. Picea chihuahuana, Abies durangensis, and Pseudotsuga menziesii, three conifer species occurring at this site, are rare in Mexico in general, and in Durango particularly, where they are distributed as protected remnants with a high conservation status. The presence of Picea chihuahuana is particularly significant.
The proximity of this stand to the Tropic of Cancer provides an infrequent climate for Picea; only another species of this genus grows in Asia, at a locality with similar latitude. Furthermore, Site 4 lacks forest management, as it is located within an ecological reserve. Site 2 was the least diverse, due to the change in soil use from a forest to an extensive livestock breeding area.
Likewise, the variation in the diversity of species is greatly due to the historical precipitation registered at each site.
According to Návar-Cháidez and González-Elizondo (2009), the diversity diminishes with the increase in the removed basal area. Habitats with low fertility reduce diversity, through stress caused by nutrients, and the high fertility overcomes the limitations imposed by stress, leading to simplified communities (Rosenzweig and Abramsky, 1993; Tilman and Pacala, 1993).
Floristic similarity
The floristic composition at all four sites is represented by 18 species, of which they share only one (Juniperus deppeana Steud.), while Arbutus xalapensis Kunth is shared by sites S1, S2 and S3; Pinus cooperi is shared by sites S2, S3 and S4, and Quercus sideroxyla, by sites S1, S3 and S4; the last two stand out for their importance value.
According to the Bray-Curtis ordination dendrogram (Figure 2), the assessed sites have a low similarity. The sites with the highest similarity were between S1 and S3, with 29.81 %, followed by a similarity of 25.59 % in regard to S4; finally, S2 had a similarity of 12.94 % in relation to the next group (Table 3).
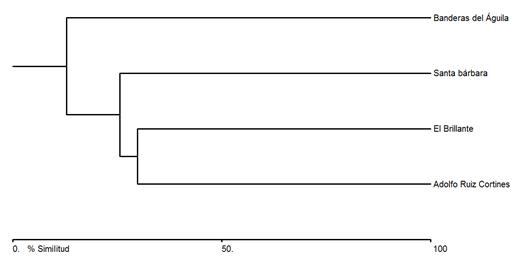
Table 3 Bray-Curtis cluster analysis similarity matrix between the study sites.
| Banderas del Águila | El Brillante | Santa Bárbara | |
|---|---|---|---|
| Adolfo Ruíz Cortines | 12.94 | 29.81 | 9.09 |
| Banderas del Águila | * | 4.33 | 1.99 |
| El Brillante | * | * | 25.59 |
García et al. (2010) cite similar results for two natural forests in Colombia, which have a similarity of 37 % as they share 21 out of 57 identified species, and conclude that the low similarity is due to differences in altitude and to certain characteristics that are specific to the area. In relation to four study sites of northeastern Nuevo León, Ramírez et al. (2013) register that those located within the same altitude gradient were similar in species composition. The authors contend that the dissimilarity between sites is due to the historical precipitation registered in them and to the characteristics of each ecosystem, as well as to differences in the altitudinal gradient.
In their assessment of the effect of silvicultural practices on the composition and diversity of species of a forest, Luna et al. (2015) registered that the similarity of species between the evaluated treatments increases with the time of application and is influenced by the biotic and abiotic conditions of the ecosystem resulting from the silvicultural treatment utilized.
Although the study sites were located within much the same altitude intervals and had similar mean temperatures in general, they exhibited a low similarity that ranged from 0.13 to 0.40 -an instance of the ecological complexity of the WSM (Delgado et al., 2016). However, the greatest inequality between sites (S2 and S4) = 1.99) may have been caused by the distance between them and by the differences in the characteristics of each site; site (S2) exhibits soil use change from forests to grasslands for extensive livestock breeding, as well as a low precipitation; while at S4 there are steep slopes with a variety of moderate gullies and canyons with water sources, a high humidity, and a higher precipitation than that of the other sites; furthermore, it is located within a protected natural area (PNA) with ecotouristic, scientific, and educational activities.
Ecological indicators at the study sites
Tables 4, 5, 6 and 7 summarize the results corresponding to the ecological variables for each of the four assessed sites.
Table 4 Ecological variables for the species identified at the Adolfo Ruíz Cortines site.
| Plant species | Density (N·ha-1) |
Rd (%) |
Frequency |
Rf (%) |
Crown Area (m2·ha-1) |
RCA (%) |
Basal area (m2·ha-1) |
RBA (%) |
IVI (%) |
|---|---|---|---|---|---|---|---|---|---|
| Alnus acuminata | 10 | 0.49 | 1 | 1.89 | 64 | 0.31 | 0.05 | 0.13 | 0.83 |
| Arbutus xalapensis | 190 | 9.22 | 8 | 15.09 | 2 194 | 10.68 | 3.78 | 8.16 | 10.82 |
| Juniperus deppeana | 60 | 2.91 | 4 | 7.55 | 494 | 2.41 | 0.58 | 1.26 | 3.91 |
| Pinus durangensis | 630 | 30.58 | 10 | 18.87 | 5 828 | 28.38 | 14.49 | 31.24 | 26.9 |
| Pinus leiophylla | 80 | 3.88 | 4 | 7.55 | 432 | 2.11 | 0.79 | 1.72 | 4.38 |
| Pinus teocote | 190 | 9.22 | 8 | 15.09 | 1 898 | 9.24 | 3.84 | 8.3 | 10.87 |
| Quercus rugosa | 90 | 4.37 | 8 | 15.09 | 1 039 | 5.06 | 2.7 | 5.83 | 8.43 |
| Quercus sideroxyla | 810 | 39.32 | 10 | 18.87 | 8 585 | 41.80 | 20.11 | 43.37 | 33.85 |
| Total | 2 060 | 100 | 53 | 100 | 20 537 | 100 | 46.38 | 100 | 100 |
Rd = Relative density; Rf = Relative frequency; RCA = Relative crown area; RBA = Relative basal area; IVI = Importance Value Index (Rd+Rf+RBA) /3.
Table 5 Ecological variables for the species identified at the Banderas del Águila site.
| Plant species | Density (N·ha-1) |
Rd (%) |
Frequency |
Rf (%) |
Crown Area (m2·ha-1) |
RCA (%) |
Basal area (m2·ha-1) |
RBA (%) |
IVI (%) |
|---|---|---|---|---|---|---|---|---|---|
| Arbutus chiapensis | 70 | 5.22 | 3 | 8.57 | 444 | 2.80 | 0.56 | 2.27 | 5.36 |
| Arbutus xalapensis | 110 | 8.21 | 3 | 8.57 | 365 | 2.30 | 0.45 | 1.80 | 6.19 |
| Juniperus deppeana | 20 | 1.49 | 2 | 5.71 | 120 | 0.76 | 0.21 | 0.86 | 2.69 |
| Pinus cooperi | 10 | 0.75 | 1 | 2.86 | 75 | 0.48 | 0.07 | 0.29 | 1.30 |
| Pinus engelmanii | 80 | 5.97 | 6 | 17.14 | 1 641 | 10.34 | 3.73 | 15.08 | 12.73 |
| Pinus leiophylla | 350 | 26.12 | 9 | 25.71 | 6 834 | 43.08 | 12.96 | 52.36 | 34.73 |
| Quercus durifolia | 690 | 51.49 | 10 | 28.57 | 6 247 | 39.38 | 6.59 | 26.63 | 35.57 |
| Quercus rugosa | 10 | 0.75 | 1 | 2.86 | 139 | 0.87 | 0.18 | 0.72 | 1.44 |
| Total | 1 340 | 100 | 35 | 100 | 15 864 | 100 | 24.75 | 100 | 100 |
Rd= Relative density; Rf= Relative frequency; RCA= Relative crown area; RBA= Relative basal area; IVI = Importance Value Index (Dr+Fr+ABr) /3.
Table 6 Ecological variables for the species identified at the El Brillante site.
| Pant species | Density (N·ha-1) |
Rd (%) |
Frequency |
Rf (%) |
Crown Area (m2·ha-1) |
RCA (%) |
Basal area (m2·ha-1) |
RBA (%) |
IVI (%) |
|---|---|---|---|---|---|---|---|---|---|
| Alnus acuminata | 170 | 3.32 | 3 | 6.38 | 592 | 2.15 | 0.88 | 1.96 | 3.89 |
| Arbutus xalapensis | 390 | 7.62 | 10 | 21.28 | 1 200 | 4.37 | 1.09 | 2.43 | 10.44 |
| Juniperus deppeana | 190 | 3.71 | 5 | 10.64 | 808 | 2.94 | 0.71 | 1.59 | 5.31 |
| Pinus cooperi | 680 | 13.28 | 10 | 21.28 | 9 998 | 36.36 | 26.8 | 59.33 | 31.30 |
| Pinus strobiformis | 460 | 8.98 | 9 | 19.15 | 6 507 | 23.66 | 6.52 | 14.43 | 14.19 |
| Quercus sideroxyla | 3 230 | 63.09 | 10 | 21.28 | 8 391 | 30.52 | 9.15 | 20.26 | 34.87 |
| Total | 5 120 | 100 | 47 | 100 | 27 498 | 100 | 45.17 | 100 | 100 |
Rd = Relative density; Fr = Relative frequency; RCA = Relative crown area; RBA = Relative basal area; IVI = Importance Value Index (Rd+Rf+RBA) /3.
Table 7 Ecological variables for the species identified at the Santa Bárbara site.
| Plant species | Density (n·ha-1) |
Rd (%) |
Frequency |
Rf (%) |
Crown Area (m2·ha-1) |
RCA (%) |
Basal area (m2·ha-1) |
RBA (%) |
IVI (%) |
|---|---|---|---|---|---|---|---|---|---|
| Abies durangensis | 60 | 3.57 | 5 | 8.47 | 1 693 | 4.82 | 4.27 | 5.04 | 5.7 |
| Cupressus lusitanica | 200 | 11.9 | 7 | 11.86 | 1 620 | 4.61 | 2.03 | 2.4 | 8.72 |
| Juniperus deppeana | 350 | 20.83 | 10 | 16.95 | 2 910 | 8.28 | 10.64 | 12.56 | 16.78 |
| Picea chihuahuana | 100 | 5.95 | 5 | 8.47 | 3 267 | 9.30 | 9.68 | 11.42 | 8.62 |
| Pinus cooperi | 580 | 34.52 | 9 | 15.25 | 13 506 | 38.44 | 31.07 | 36.67 | 28.82 |
| Pinus durangensis | 80 | 4.76 | 6 | 10.17 | 3 356 | 9.55 | 9.57 | 11.29 | 8.74 |
| Pinus strobiformis | 70 | 4.17 | 4 | 6.78 | 1 713 | 4.88 | 1.41 | 1.67 | 4.21 |
| Pseudotsuga menziesii | 210 | 12.5 | 10 | 16.95 | 4 116 | 11.72 | 6.84 | 8.07 | 12.51 |
| Quercus sideroxyla | 30 | 1.79 | 3 | 5.08 | 2 949 | 8.39 | 9.21 | 10.88 | 5.92 |
| Total | 1 680 | 100 | 59 | 100 | 35 134 | 100 | 84.73 | 100 | 100 |
Rd = Relative density; Fr = Relative frequency; RCA = Relative crown area; RBA = Relative basal area; IVI = Importance Value Index (Rd+Rf+RBA) /3.
The four study sites exhibited a coverage of 9 063.5 m2 ha-1. López-Hernández et al. (2017) observed a similar coverage (8 462.76 m2 ha-1) when assessing a temperate forest in the east of the state of Puebla. Graciano et al. (2009) point out a coverage of 8 838.35 m2 ha-1 in ejido La Campana in the WSM at sites with a similar vegetation to that studied by the present research. The variations in the cover may be greatly due to the historical precipitation received by each site. According to Valenzuela and Granados (2009), mountainous areas like those of the WSM remain temperate, with a high precipitation, favoring changes in the structure and the composition of the vegetation.
According to Piedra (2016), the changes are due not only to environmental issues but also to management activities such as the distribution of woody material or soil conservation related construction and actions, e.g. cordoning off, which stimulate the accumulation of dead leaves, and consequently hinder seed germination.
Challenger et al. (2009) document that the vegetation cover is affected by various activities, notably: destruction of the habitat, overexploitation, invasive species, pollutants, and climate change.
The estimated IVI indicates that in all four sites, dominance corresponds to Pinus spp., followed by Quercus spp. because their species have economic importance in the WSM. Thus, application of the silvicultural methods favors a higher density and frequency, and a larger coverage and basal area. Nevertheless, generic dominances make it possible to observe pine-oak or oak-pine forests in the same site , as documented in the Environmental Statutes of the state of Durango for the temperate forests of the area (Semarnat, 2007).
The comparative study between adjoining sites made it possible to detect structural and composition variations occurring within a particular ecosystem. Although in general one conifer or broadleaf species may grow at different degrees of slope, other taxa have preferences for particular topoforms (Martínez et al., 2013).
The association of Pinus cooperi var. ornelasi Martínez (Blanco) and Pinus durangensis with other Pinus and Quercus taxa is one of the most representative in the WSM of Durango; they are similar to those registered by Márquez and González (1998), Márquez et al. (1999), and González et al. (2007) and González-Elizondo (2012).
According to Guzmán (2009), when a species reaches the highest importance value, there is a clear ecological dominance, and usually a few species with the highest importance values are representative of the main population. Conversely, when several species compete at the site, none of them has an importance value above 50 %.
Conclusions
The Sierra Madre Occidental plays a major economic and ecological role in Mexico, as one of the main suppliers not only of wood but also of important environmental services in the country. The results suggest that, although Pinus cooperi ornelasi, P. durangensis, P. leiophylla, Quercus durifolia, and Q. sideroxyla are heterogeneous plant communities with a low similarity, they have high ecological importance values due to their frequency, density, dominance, and coverage. However, based on the Shannon and Margalef indices, the region is rated as having a low diversity, which shows that the differences between these plant communities are partially determined by the biophysical conditions in which they grow. Furthermore, the site with the greatest diversity has a history as a forest reserve.
This research contributes descriptive elements that must be taken into account in the decision making process both by forest managers and by the local population.
Acknowledgments
The authors wish to express their gratitude to the projects “Biogeochemical Cycles in forests of the Sierra Madre Occidental” of the El Salto region in Durango, Mexico, Project TECNM. 5746.16-P, and Dead Leaf Removal at three Sites of the Sierra Madre Occidental, Durango, Mexico, as well as to project SEP-ITM-ITESA-PTC-002, from which the present research was supported.
REFERENCES
Aguirre C., O. A., G. Hui., K. V. Gadow V y J. Jiménez P. 2003. Análisis estructural de bosques naturales en Durango, México. http://www.fao.org/docrep/ARTICLE/WFC/XII/1037-B1.HTM (15 de marzo de 2017). [ Links ]
Alanís-Rodríguez, E., J. Jiménez-Pérez, A. Valdecantos-Dema, M. Pando-Moreno, O. Aguirre-Calderón y E. J. Treviño-Garza. 2011. Caracterización de la regeneración leñosa post-incendio de un ecosistema templado del parque ecológico Chipinque, México. Revista Chapingo Serie Ciencias Forestales y del Ambiente 17(1): 31-39. http://dx.doi.org/10.5154/r.rchscfa.2010.05. [ Links ]
Aragón-Piña, E. E., A. Garza-Herrera, M. S. González-Elizondo y I. Luna-Vega. 2010. Composición y estructura de las comunidades vegetales del rancho El Durangueño, en la Sierra Madre Occidental, Durango, México. Revista Mexicana de Biodiversidad 81(3): 771-787. [ Links ]
Beals, E. W. 1984. Bray-Curtis ordination: An effective strategy for analysis of multivariate ecological data. Advances in Ecological Research 14: 1-56. [ Links ]
Brower, J. E., J. H. Zar and C. N. Von Ende. 1997. Field and Laboratory Methods for General Ecology. 4th edition. McGraw-Hill. Boston, MA USA. 273 p. [ Links ]
Challenger, A. 1998. Utilización y conservación de los ecosistemas terrestres de México; Pasado, Presente y Futuro. México: Comisión Nacional para el Conocimiento y Uso de la Biodiversidad. 847 pp. [ Links ]
Challenger, A. , R. Dirzo., J. C. López A., E. Mendoza., A. Lira N e I. Cruz. 2009. Factores de cambio y estado de la biodiversidad. In: Dirzo, R., R. González y I. J. March (comps.). Capital natural de México, vol. II: Estado de conservación y tendencias de cambio. Conabio. México, D.F., México. pp. 37-73. [ Links ]
Comisión Nacional Forestal (Conafor). 2012. Inventario Nacional Forestal y de Suelos, informe del 2004-2009 CONAFOR. http://www.cnf.gob.mx:8090/snif/portal/infys/temas/resultados-2004-2009 (18 de enero de 2018). [ Links ]
De León M., G. D., A. García A., S. Andrade H y A. Ruíz M. 2013. Distribución de la vegetación a través de un transecto sobre la Sierra Madre Occidental de Durango, México. Revista Latinoamericana de Recursos Naturales 9(1): 30-40. [ Links ]
Delgado, Z. D. A., S. A. Heynes S., M. D. Mares Q., M. L. Piedra L., F. I. Retana R., K. Rodríguez C., A. I. Villanueva H., M. S. González E y L. Ruacho G. 2016. Diversidad y estructura arbórea de dos rodales en Pueblo Nuevo, Durango. Revista Mexicana de Ciencias Forestales 7(33): 94-107. https://doi.org/10.29298/rmcf. [ Links ]
Finegan, B. 1992. El Potencial del Manejo de los Bosques Húmedos Secundarios Neotropicales de las Tierras Bajas. Serie Técnica. Informe Técnico Núm. 188. Colección Silvicultura y Manejo de Bosques Naturales Núm. 5. CATIE. Turrialba, Costa Rica. 28 p. [ Links ]
García C., C. Suarez C y M. Daza. 2010. Estructura y diversidad floristica de dos bosques naturales (Buenos Aires, Dpto Cauca, Colombia) . Revista Facultad de Ciencias Agropecuarias 8(1): 74-82. [ Links ]
García-Arévalo, A. 2008. Vegetación y flora de un bosque relictual de Picea chihuahuana Martínez del norte de México. Polibotánica 25: 45-68. [ Links ]
García, M. E. 1981. Modificaciones al Sistema de Clasificación Climática de Köppen. 3a edición. Universidad Nacional Autónoma de México. Instituto de Geografía. México, D.F., México. 252 p. [ Links ]
Gavilán, R. G. y A. Rubio. 2005. ¿Pueden los índices de diversidad biológica ser aplicados como parámetros técnicos de la gestión forestal? Cuadernos de la Sociedad Española de Ciencias Forestales 20: 93-98. [ Links ]
González E., M. S., M. González E. y M. A. Márquez L. 2007. Vegetación y ecorregiones de Durango. Plaza y Valdés Editores-Instituto Politécnico Nacional. México, D. F., México. 219 p. [ Links ]
González-Elizondo, M. S., M. González-Elizondo, J. A. Tena-Flores, L. Ruacho-González y I. L. López-Enríquez. 2012. Vegetación de la Sierra Madre Occidental, México: Una síntesis. Acta Botánica Mexicana 100: 351-403. [ Links ]
Gordon, A. G. 1968. Ecology of Picea chihuahuana Martínez. Ecology 49(5): 880-896. [ Links ]
Graciano-Ávila, G., O. A. Aguirre C., E. Alanís R y J. E. Lujan S. 2017a. Composición, estructura y diversidad de especies arbóreas en un bosque templado del noroeste de México. Ecosistemas y Recursos Agropecuarios 4(12): 535-542. [ Links ]
Graciano-Ávila, G., E. Alanís-Rodríguez, Ó. A. Aguirre-Calderón, M. A. González-Tagle, E. J. Treviño-Garza y A. Mora-Olivo. 2017b. Caracterización estructural del arbolado en un ejido forestal del noroeste de México. Madera y Bosques 23(3): 137-146. doi: 10.21829/myb.2017.2331480. [ Links ]
Granados, S. D., G. F López R y M. A. Hernández G. 2007. Ecología y silvicultura en bosques templados. Revista Chapingo Serie Ciencias Forestales y del Ambiente 13(1): 67-83. [ Links ]
Guzmán L., M. A. 2009. Distribución, sistemática, y algunos aspectos ecológicos del mezquite Prosopis spp. (L.) en el estado de Nuevo León, México. Tesis de Doctorado. Facultad de Ciencias Biológicas, UANL. San Nicolás de los Garza, N. L., México. 197 p. [ Links ]
Heiseke, D. y R. Foroughbakhch. 1985. El matorral como recurso forestal. Reporte Científico. Facultad de Silvicultura y Manejo de Recursos Renovables 1: 1-31. [ Links ]
Hernández, J., O. A. Aguirre C., E. Alanís R., J. Jiménez P y M. A. González T. 2013. Efecto del manejo forestal en la diversidad y composición arbórea de un bosque templado del noroeste de México. Revista Chapingo serie Ciencias Forestales y del Ambiente 19(3):189-199. http://dx.doi.org/10.5154/r.rchscfa.2012.08.052 [ Links ]
Instituto Nacional de Estadística y Geografía (INEGI). 2010. Prontuario de Información Geográfica Municipal de los Estados Unidos Mexicanos Durango, Durango. http://www3.inegi.org.mx/sistemas/mexicocifras/datosgeograficos/10/10005.pdf . (25 febrero de 2018). [ Links ]
Kazana, V., F. Bonnieux, P. Campos, A. Palacin, L. Caparrós, P. Croitorou, A. Gatto, M. Kazaklis, J. Merlo, C. Paoli and L. Zadnik. 2005. MEDMONT: Tools for evaluating investment in the mountain Mediterranean areas-An integrated framework for sustainable development. Final Report. Mediterranean Agronomic Institute of Chania (MAI.Ch). Alsyllion Agrokepion, Chania, Grecia. 255 p. [ Links ]
López-Hernández, J. A., Ó. A. Aguirre-Calderón, E. Alanís-Rodríguez, J. C. Monarrez-Gonzalez, M. A. González-Tagle yJ. Jiménez-Pérez . 2017. Composición y diversidad de especies forestales en bosques templados de Puebla, México. Madera y Bosques 23(1): 39-51. doi:10.21829/myb.2017.2311518. [ Links ]
Louman, B., D. Quiroz y M. Nilson. 2001. Silvicultura de bosques latifoliados húmedo con énfasis en América Central. Serie Técnica. Manual Técnico Núm. 46. CATIE. Turrialba, Costa Rica. 265 p. [ Links ]
Luna, B. L., P. Hernández R., A. Velázquez M., A. Gómez G y M. Acosta M. 2015. El sotobosque en la composición y diversidad de áreas bajo manejo forestal en Santa Catarina Ixtepeji, Oaxaca. Revista Chapingo Serie Ciencias Forestales y del Ambiente 21(1): 109-121. doi: 10.5154/r.rchscfa.2014.08.037. [ Links ]
Magurran, A. E. 2004. Measuring biological diversity. Blackwell Publishing. Oxford, UK. 256 p. [ Links ]
Margalef, R. 1972. Homage to Evelyn Hutchinson, or why is there an upper limit to diversity. Transactions of the Connecticut Academy of Arts and Sciences 44: 211-235. [ Links ]
Márquez, L., M. A y M. S. González E. 1998. Composición y estructura del estrato arbóreo de un bosque de pino-encino en Durango, México. Agrociencia 32(4): 413-419. [ Links ]
Márquez, L. , M. A., M. S. González E y R. Álvarez Z. 1999. Componentes de la diversidad arbórea en bosques de pino encino de Durango, México. Madera y Bosques 5(2): 67-78. [ Links ]
Martínez, A. P., C. Wehenkel, J. C. Hernández D., M. González E., J. Corral R and A. Pinedo Á. 2013. Effect of climate and physiography on the density of tree and shrub species in Northwest Mexico. Polish Journal of Ecology 61(2): 295-307. [ Links ]
Matteucci, S. D. y A. Colma. 1982. Metodología para el estudio de la vegetación, Serie Biología, Monografía 22. Secretaría General de la Organización de los Estados Americanos. Programa Regional de Desarrollo Científico y Tecnológico. Washington, DC USA. 168 p. [ Links ]
Matteucci, S. D., A. Colma y L. Pla. 1999. Biodiversidad vegetal en el árido falconiano (Venezuela). Interciencia 24: 300-307. [ Links ]
Mcaleece, N., P. J. D. Lambshead and G. L. J. Paterson. 1997. Biodiversity Professional (V.2.0). Natural History Museum and Scottish Association for Marine Science. http://www.sams.ac.uk/research/software/software/?searchterm=Biodiversity%20Pro (13 de marzo de 2018). [ Links ]
Medrano M., M. J., F. J. Hernández, S. Corral R y J. A. Nájera L. 2017. Diversidad arbórea a diferentes niveles de altitud en la región de El Salto, Durango. Revista Mexicana de Ciencias Forestales 8(40): 57-68. [ Links ]
Mendoza B., M. A. 1993. Conceptos básicos de manejo forestal. 1ª edición. Limusa-UTEHA. México, D.F., México 161 p. [ Links ]
Mostacedo, B y S. Fredericksen. 2000. Manual de métodos básicos de muestreo y análisis en ecología vegetal. BOLFOR. Santa Cruz de la Sierra, Bolivia. 92 p. [ Links ]
Návar-Cháidez, J. J. y S. González-Elizondo. 2009. Diversidad, estructura y productividad de bosques templados de Durango, México. Polibotánica 27: 71-87. [ Links ]
Organización de las Naciones Unidas para la Alimentación y la Agricultura (FAO). 2005. Evaluación de los Recursos Forestales Mundiales 2005: Informe nacional, FRA2005. Roma, Italia: 253 p. [ Links ]
Ott, L. 1993. An introduction to statistical methods and data analysis. 2nd edition. Duxbury Press. Boston, MA USA. 775 p. [ Links ]
Piedra L., N. L. 2016. Caracterización de composición y estructura de los extratos herbaceós y arbustivos en un ensayo de aclareos de Pueblo, Nuevo y San Dimas Durango. Tesis de Maestría. Instituto Politécnico Nacional CIIDIR. Victoria de Durango, Dgo., México. 63 p. [ Links ]
Promis, A., J. Caldentey y M. Ibarra. 2010. Microclima en el interior de un bosque de Nothofagus Pumilioy el efecto de una corta de regeneración. Bosque (Valdivia) 31 (2): 129-39. doi:10.4067/S0717-92002010000200006. [ Links ]
Ramírez G., A. 2006. Ecología: métodos de muestreo y análisis de población y comunidades. 1a edición. Pontificia Universidad Javeriana. Bogotá, Colombia. 272 p. [ Links ]
Ramírez L., R. G., T. G. Domínguez G., H. González R., I. Cantú S., M. V. Gómez M., J. I. Sarquís R y E. Jurado. 2013. Composición y diversidad de la vegetación en cuatro sitios del noreste de México. Madera y Bosques 19(2): 59-72. [ Links ]
Rosenzweig, M. L. and Z. Abramsky. 1993. How are diversity and productivity related? In: Ricklefs, R. E. and D. Schluter (eds.). Species Diversity in Ecological Communities. Historical and Geographical Perspectives. The University of Chicago Press. Chicago, IL USA. pp. 52-65. [ Links ]
Sánchez-González, A. 2008. Una visión actual de la diversidad y distribución de los pinos de México. Madera y Bosques 14(1): 107-120. [ Links ]
Secretaría de Medio Ambiente y Recursos Naturales (Semarnat). 2007. Ordenamiento Ecológico del Estado de Durango. Gobierno del Estado de Durango-SEMARNAT. Durango, Dgo., México. 194 p. [ Links ]
Secretaría de Medio Ambiente y Recursos Naturales (Semarnat). 2014. Ecosistema terrestres, el medio ambiente en México 2013-2014. http://apps1.semarnat.gob.mx/dgeia/informe_resumen14/02_ecosistemas/2_4.html (1 de febrero de 2018). [ Links ]
Secretaría de Medio Ambiente y Recursos Naturales (Semarnat). 2011. Anuario estadístico de la producción forestal 2009. http://www.semarnat.gob.mx/temas/gestionambiental/forestalsuelos/Anuarios/ Secretaría General de la Organización de los Estados Americanos (5 de febrero de 2018). [ Links ]
Statistical Package for the Social Sciences Inc. (SPSS). 2004. SPSS para Windows. Version 13.0. SPSS Inc. Chicago, IL USA. n/p. [ Links ]
Steel, R. G. D. and J. H. Torrie. 1980. Principles and procedures of statistics. A biometrical approach. 2nd edition. McGraw-Hill Book Company. New York, NY USA. 633 p. [ Links ]
Tilman, D. and S. Pacala. 1993. The Maintenance of Species Richness in Plant Communities. In: Rickelefs, R. E. and D. Shuleter (eds.). Species diversity in ecological communities. The University of Chicago Press. Chicago, IL USA. pp. 13-25. [ Links ]
Unidad de Manejo Forestal (UMAFOR). 2010. Estudio regional forestal de la unidad de manejo forestal UMAFOR 1002. Secretaría de Medio Ambiente y Recursos Naturales. México, D.F., México. 347 p. [ Links ]
Valenzuela N., L. M y D. Granados S. 2009. Caracterización fisonómica y ordenación de la vegetación en el área de influencia de El Salto, Dgo. Revista Chapingo Serie Ciencias Forestales y del Ambiente 15(1): 29-41. [ Links ]
Vetaas, O. R. and R. P. Chaudhary. 1998. Scale and species-environment relationships in a central Himalayan oak forest, Nepal. Plant Ecology 134(1): 67-76. [ Links ]
Zúñiga V., J. M., E. A. Martínez López., C. Navarrete G., J. J. Graciano L., D. Maldonado A y B. Cano M. 2018. Análisis ecológico de un área de pago por servicios ambientales hidrológicos en el ejido La Ciudad, Pueblo Nuevo, Durango, México. Investigación y Ciencia de la Universidad Autónoma de Aguascalientes 26(73): 27-36. [ Links ]
Received: March 12, 2018; Accepted: September 07, 2018
 Este es un artículo publicado en acceso abierto bajo una licencia Creative Commons
