


Servicios Personalizados
Revista
Articulo
 texto en
  Inglés (pdf)
 Artículo en XML
 Referencias del artículo
 Enviar artículo por email
Indicadores
-
 Citado por SciELO
 -
 Accesos
Links relacionados
-
 Similares en
SciELO
Similares en
SciELO
Compartir

 Permalink
Revista mexicana de ciencias pecuarias
versión On-line ISSN 2448-6698versión impresa ISSN 2007-1124
Rev. mex. de cienc. pecuarias vol.11 no.2 Mérida abr./jun. 2020 Epub 23-Oct-2020
https://doi.org/10.22319/rmcp.v11i2.5181
Articles
Development and validation of a visual pattern for evaluating beef meat color in Mexico
b Universidad Nacional Autónoma de México, Facultad de Medicina Veterinaria y Zootecnia, Ciudad de México, México.
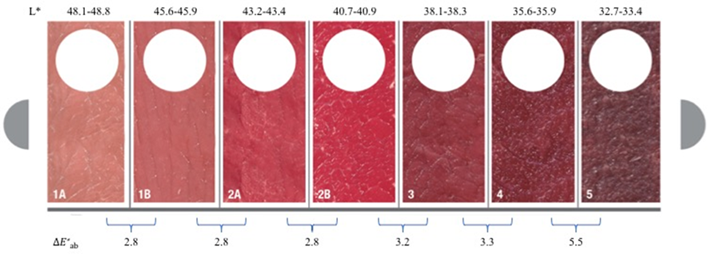
This study aimed to develop a visual scale for beef color evaluation. A total of 1,165 loins were analyzed 24 h postmortem in four slaughterhouses in Mexico. In each sample, it was determined color using a visual pattern and a spectrophotometer (CIELAB scale), taking a photograph of each loin. Seven categories were identified using the visual method (from very light red to very dark red), and the instrumental color variables (L*, a*, b*, C*, and h*) were used to create prediction models for the visual categories. The scale was constructed using L* as the sole predictor, as this model explained > 90 % of the observed variation. The pattern was illustrated with photos of the samples with an L* value within the 95 % confidence interval of the mean in each category, from very light red (48.1 <L*<48.8) to very dark red (32.7 <L*<33.4). The total color difference between the categories fluctuated between 2.8 and 5.5, which suggests that these are distinguishable with the naked eye. A trained sensory panel and a consumer panel, through tests, validated the scale. Trained panelists correctly rated the samples in 92.6 % of the evaluations. In meat with dark-cutting (DC) appearance, the trained panelists had 100 % hits, and the consumer panelists 85.3 %. The proposed visual pattern is supported by instrumental measurements and proved to be technically feasible for the evaluation of color in beef by trained personnel and consumers.
Key words Beef; Bovine; Quality; Color; Visual; Instrumental; Pattern
El objetivo fue desarrollar una escala visual para la evaluación del color en carne de bovino. Se analizaron 1,165 lomos, a las 24 h post mortem, en cuatro rastros de la República Mexicana. En cada muestra se evaluó el color con ayuda de un patrón visual y con un espectrofotómetro (escala CIELAB), tomándose una fotografía de cada lomo. Por el método visual se identificaron siete categorías, (de rojo muy pálido a rojo muy oscuro) y las variables instrumentales del color (L*, a*, b*, C* y h*) se usaron para generar modelos de predicción de las categorías visuales. La escala se construyó utilizando L* como único predictor, pues este modelo explicó >90 % de la variación observada. El patrón se ilustró con fotos de las muestras con valor de L* dentro del intervalo de confianza al 95% de la media en cada categoría, desde rojo muy pálido (48.1<L*<48.8) hasta rojo muy oscuro (32.7<L*<33.4). La diferencia total de color entre categorías fluctuó entre 2.8 y 5.5, lo que sugiere que éstas son diferenciables a simple vista. La escala se validó mediante pruebas con un panel sensorial entrenado y otro de consumidores. Los jueces entrenados calificaron correctamente las muestras en el 92.6 % de las evaluaciones. En carne con apariencia de corte oscuro (CO), el panel entrenado tuvo 100 % de aciertos y el de consumidores 85.3 %. El patrón visual propuesto se sustenta en mediciones instrumentales y mostró ser técnicamente viable para la evaluación del color en carne de bovino por personal entrenado y por consumidores.
Palabras clave Carne de res; Bovino; Calidad; Color; Visual; Instrumental; Patrón
Introduction
Fresh meat color is among the main quality attributes that influence the consumer buying decision1,2. It is a fact that meat color defects cause significant economic losses, as they lead to a discount on meat prices3-5. Therefore, color is one of the main attributes used to evaluate the quality of carcasses and meat in countries that are big traders, like the United States, Japan, Canada, and Australia6-9. These assessment schemes are carried out using visual scales, which are highly correlated with the consumer buying decision10. Furthermore, the early detection of these color defects allows the segregation of meat with an undesirable appearance and redirect it to manufacturing processes in which this attribute is less important7.
Different countries develop visual patterns for meat color evaluation because this attribute is a multifactorial phenomenon. For example, factors like breed, production system, diet, and pre- and post-slaughter handling, which are different in each country, are relevant sources of meat color variation11,12. Therefore, the use of these tools by the meat industry must follow scientific evidence originated from local herds. The latter is especially important in cattle, a species that usually presents a high variation in its quality attributes13.
In Mexico, beef cattle production is among the most economically important livestock activities14. Furthermore, beef is highly popular in the country, with an annual per capita consumption of 17.40 kg15, however, there are no scientifically supported tools for the segregation of meat according to color. The Mexican standard for carcass classification includes color as one of the quality determining attributes16. However, it proposes the use of a solid color scale from the Pantone system of just three levels, which are cherry-red, deep red, and dark red meat color. This scale is not representative of the whole range of hues that beef can have, nor does it describe the appearance associated with quality defects, like dark-cutting beef (DC). Moreover, this method does not consider that meat has an irregular surface, with muscular fibers in different directions, connective tissue, and intramuscular fat. Therefore, the use of photographic patterns is considered a better alternative for the subjective evaluation of meat color17.
Despite some current private initiatives and several regional studies18-22, so far, a visual pattern has not been developed to serve as a reference for the national industry. This situation represents a commercial disadvantage for local producers, who can receive economic penalties according to subjective evaluations from customers. Therefore, this study aims to develop and validate a visual pattern for beef meat color evaluation at an industrial scale in Mexico. This research hope to contribute to market organization and to improve communication between the different links of the value chain, as well as to generate a subjective evaluation method for meat color, based on scientific evidence, that will eliminate the deficiencies in the system considered in current regulations.
Material and methods
Sampling scheme
The slaughterhouses that participated in the study were selected using a non-probability sampling plan, based on the following criteria: 1) companies located in one of the three ecological-livestock areas of Mexico (arid and semiarid, wet tropics, and dry tropics); 2) carcass halves are cut between the twelfth and thirteenth ribs; 3) the company is a Federal Inspection Type (TIF) slaughterhouse, and 4) availability of working areas with technical lighting and space conditions, access to primary cuts, and cutting area with a refrigeration temperature of 6-8 ºC.
According to these criteria, four TIF slaughterhouses were selected, located in Baja California, Sinaloa, Querétaro, and Tabasco states, in which a total of 1,165 samples were analyzed (Figure 1). Before color evaluation, meat was exposed to oxygen for 30 min; this created a much slower working rate compared to the process flow. Therefore, it was not possible to analyze all the carcasses processed in one day. The goal was to take at least 170 carcasses per slaughterhouse, which was the minimum sample size determined, considering a confidence level of 95 %, an accuracy of 0.5 units in the instrumental color variables, and a variance of 10.69, estimated from preliminary tests. Thus, using the equation
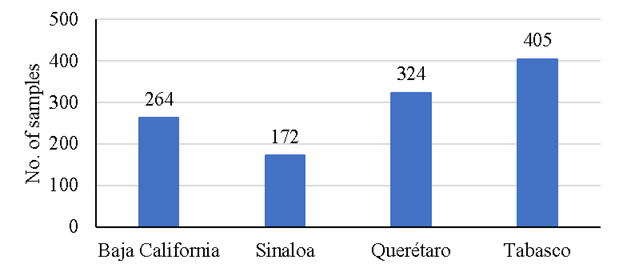
Figure 1 Number of loin samples analyzed in TIF slaughterhouses of four Mexican states between November 2012 and July 2013
The population of animals from which the data were obtained was made up, in about 80%, of non-castrated entire males, the remaining percentage were females. As the research was carried out on slaughterhouses, it was not always possible to know the age at slaughter. However, in a sample of around 300 animals in which this data was available, 86 % were 24-mo-old or less. Overall, this was the age expected for the studied sample, considering previous reports that document the preponderance of young bulls in the beef cattle slaughter population in Mexico23.
Color measurement
Color measurements, both visual and instrumental, were carried out following the American Meat Science Association guidelines24. Readings were made at 24 h postmortem in the cutting and deboning area of each TIF slaughterhouse, with a controlled room temperature of 6 to 8 ºC. The complete loins (Longissimus dorsi muscle), recently separated from the carcass and with a temperature not higher than 3 ºC, were collected. The selected loins were left to rest for 30 min on a stainless-steel table, with the loin eye area between the twelfth and thirteenth ribs exposed to air, to allow optimal oxygenation of myoglobin before the readings.
The visual color evaluation was performed under standardized conditions. As a light source, it was used a photographic quality Osram incandescent lamp with an intensity of 150 foot candles (1,614 luxes) and a color temperature of 3,200 ºK, placed at a 45° angle concerning the surface of the chop. A professional photographer took high-resolution photos of each loin chop evaluated; for this purpose, was used a 12-megapixel Nikon D300S camera with a Sigma 24-70 f. 2.8 zoom lens. Photographs were taken against a black background to eliminate color differences associated with the meat surface. The photographs function as illustrative images of the different hues of the meat, which could be included in the visual color scale that was being developed. Subsequently, using the United States eight-level color pattern for beef (Figure 2)9, an experienced researcher performed the visual color evaluation in order to have a preliminary reference about the number of possible visual categories in the studied sample.
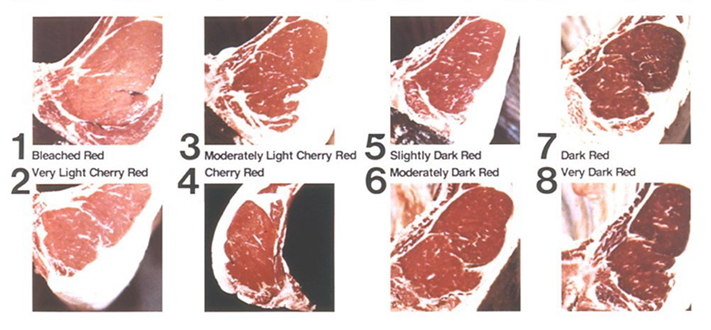
Figure 2 Visual scale for color evaluation in beef carcasses developed in the United States of America9
For instrumental measurements, was used a Hunter MiniScan EZ 4500L spectrophotometer with a 45/0 geometry and a port size opening of 25 mm (Hunter Associates Laboratory, Inc, Reston, Virginia, United States). The instrument was configured as follows: A/10° illuminant/observer combination and specular component excluded. Furthermore, the instrument was remotely operated using the program OnColor QC Lite, version 6 (CyberChrome, Inc., New Paltz, New York, United States) for computer data capture. Calibrations were performed before starting measurements and after every 100 readings or after 1 hour (whichever occurred first), using the black trap and white tile supplied by the manufacturer. From each loin chop, four readings were obtained, and their average was used to calculate the lightness (L*), redness (a*), yellowness (b*), hue (h*), and Chroma (C*) of each loin chop in the CIELAB scale. Along with these data, we also collected the spectral curves, which constitute the color footprint and were necessary for the professional impression of the scale.
Data analysis and visual scale conformation
For the statistical analysis was used the Statgraphics XV Centurion software for Windows (Statpoint, Inc., The Plains, Virginia, United States). The means of the color instrumental values were compared between the quality categories visually assigned. For this, a one-way analysis of variance (ANOVA) was performed using the Generalized Linear Model (GLM) procedure. As a result of the different number of observations per level, when significant differences were found, the means were discriminated using the Bonferroni multiple comparison procedure.
Different prediction models were tested to construct the scale, by means of the GLM procedure, using the visual category as the dependent variable and different combinations of the instrumental variables and their interactions as explicative variables (See Table S1 in Supplementary Information). Among the generated models, the one that explained the highest percentage of the observed variation between visual categories was chosen, which turned out to be the one that uses L* as the only explicative variable. Therefore, 95 % confidence intervals of L* were constructed within each visual category. To illustrate the scale, we selected the photographs that corresponded to L* loin chop values within the confidence interval of the mean in each category.
Lastly, it was necessary to determine if the categories could be differentiated visually. For this, it was calculated the total color difference (
Preliminary validation experiment
In order to validate the visual scale, we evaluated the newly developed visual standards in an industrial setting, under the conditions described below. The visual scale was tested in a slaughterhouse not included in the initial sampling. For validation, a trained sensory panel was formed, with six people familiar with the proposed color pattern. Panelists were selected using the Farnsworth-Munsell test (http://www.color-blindness.com/farnsworth-munsell-100-hue-color-vision-test/#prettyPhoto), which allows dismissing people with color appreciation deficiencies. Selected panelists were required to have a color vision deficiency score of “none” or “mild” (0 to 70 points). The initial group was formed by 20 candidates selected according to the generally accepted guidelines for the planning and selection of trained judges26.
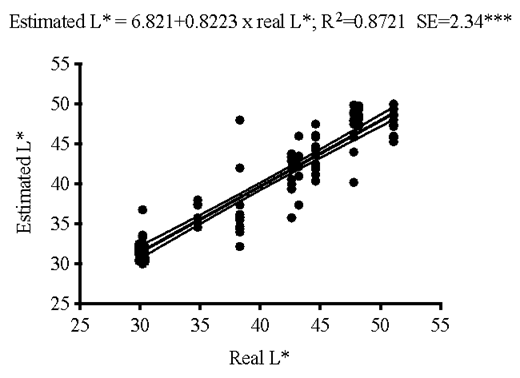
As a result of the selection process, the sensory panel ended up with six members. Each panelist participated in six evaluation sessions, in which they evaluated six meat samples (2 of normal-colored meat (N), 2 with moderate DC, and 2 with extreme DC), for a total of 36 measurements per judge. For the evaluations, the judges received instructions on how to use a structured 10-cm-long scale, ranging from very light red (L* = 50) to very dark red (L* = 30):
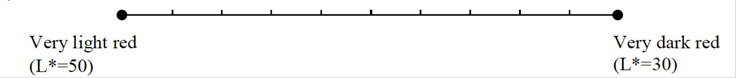
According to the proposed visual scale, extreme DC meat has L* values between 30 and 34; moderate DC between 35-37; and N meat, 38 or more. Judges were asked to mark the scale with a cross to indicate the color that corresponded to the evaluated sample. The position of the cross was measured with a ruler to obtain the estimated L* value. The data were analyzed by a three-factor analysis of variance (judge, sample, session, and their interactions); this corroborated that the only source of significant variation in the evaluations was the sample. Finally, a correlation analysis was performed between the L* values estimated from the color evaluation made by the judges and the real L* values determined with the spectrophotometer. In order to validate the proposed visual scale for beef color evaluation, it was necessary to obtain a significant discriminatory power of the judges, a significant high-magnitude correlation between the real L* values of the samples and the L* values estimated by the judges, as well as a positive hit rate > 80% when assigning a color category to each sample. In previous studies with orange juice and wine, the visual differences of the samples were validated with a much lower hit percentage of the sensory panel (e.g., >50 %)27,28. However, the present study looked for a higher hit rate in order to determine if the visual scale worked for most people, which is why color evaluations were also conducted with an untrained panel (n = 6). Consumer panelists were asked to indicate if they observed any difference between N and DC meat samples. The latter meant to corroborate the reliability of the scale when used by people without color evaluation training. Samples were selected and displayed under the same conditions previously described for the trained panel. However, the untrained panel was only presented with pairs of samples, and panelists were asked to choose the sample they preferred based on color.
Results
Definition of visual categories and their relation with instrumental measurements
Visual evaluation allowed to identify, in the studied sample, seven of the eight categories represented in the North American visual standards because none of the samples had an appearance similar to category 5 (slightly dark red). Figure 3 shows the distribution of samples in each of the seven identified classes.
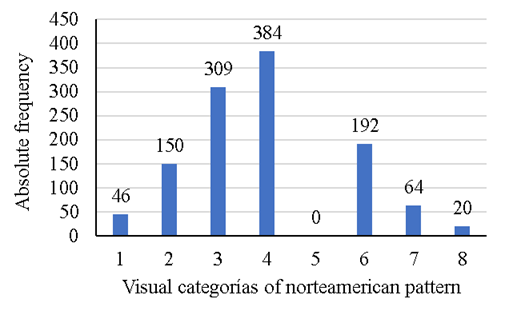
Figure 3 Distribution of samples (n = 1,165) in each of the visual categories identified using the North American pattern for beef color evaluation (the description of each category is the same as in Figure 2).
The meat proportion associated with quality defects (categories 7 and 8 represent different degrees of DC appearance) was relatively low (7 %). In contrast, more than 70 % of the samples corresponded to the categories 2-4, an appearance generally associated with normal quality meat.
Moreover, the ANOVA was significant (P<0.0001) for all the instrumental color variables (Table 1). However, L* was the only variable with significant differences between the means across all the categories. Furthermore, the ANOVA of L* was the only one with a high coefficient of determination (R2=0.9171), while in the other variables, it ranged from 0.2744 to 0.4284.
Table 1 Least square means of the instrumental color variables in meat of each of the visual categories identified in the sample
| Variable | Visual categories | SE±1 | R2 | ||||||
|---|---|---|---|---|---|---|---|---|---|
| 1 | 2 | 3 | 4 | 6 | 7 | 8 | |||
| n | 30 | 62 | 283 | 264 | 314 | 144 | 68 | ||
| L* | 48.8a | 46.7b | 44.4c | 42.1d | 40.1e | 37.7f | 34.8g | 0.94*** | 0.9171 |
| a* | 27.4a | 27.8a | 27.5a | 27.1ab | 26.3b | 25.1c | 22.6d | 2.04*** | 0.2744 |
| b* | 20.1a | 20.2a | 19.1b | 18.3c | 17.3d | 16.0e | 13.5f | 2.12*** | 0.3522 |
| C* | 34.1a | 34.3a | 33.4ab | 32.7b | 31.5c | 29.8d | 26.3e | 2.21*** | 0.3082 |
| h* | 36.3a | 35.9a | 34.7b | 33.9c | 33.2d | 32.4e | 30.7f | 1.41*** | 0.4284 |
1Standard error of the estimator.
a,b,c,d,e,f,g Means with different letters in a same row indicate statistical difference (P<0.05).
***P<0.0001.
Although other prediction models were tested (see Table S1 in supplementary information), none of them were better than the one obtained with L* as the only explicative variable and, hence, were discarded. Therefore, 95 % confidence intervals of the mean value of L* were used as a criterion to select the representative photos from each of the visual categories that form the developed color scale (Figure 4). An important feature of the latter is that meat appearance in some adjacent categories is very similar. For example, categories 1 and 2 represent light meat. Similarly, categories 3 and 4 are representative of the bright cherry-red hue, which is usually the most attractive to consumers at retail. Therefore, at first, we considered merging both pairs of categories into one. However, the
Preliminary validation of the descriptive scale under industrial conditions
The first validation criterion for the color scale was for the sensory panel to detect the differences between the samples. Judges, both individually and as a group, showed sufficient discriminatory power (significant ANOVA, P<0.0001); therefore, results were satisfactory. Furthermore, the sample was the only factor that significantly influenced (P=0.0002) the score of the judges (see Tables S2 to S4 in supplementary information).
The correlation between the real L* values of the samples and the values assigned by the judges (Figure 5), which was the second validation criterion, was significant and of high magnitude (r=0.9338, P<0.0001). These results correspond to the percentage of correct answers by the judges, third and last validation criterion of the scale; judges, on average, correctly assigned the samples to the visual category of the pattern in 92.6 % of the evaluations. The scale showed even better performance in the detection of DC; the judges correctly assigned samples with this condition in 100 % of the evaluations. Furthermore, the scale also allowed to distinguish the different degrees of the DC defect; trained judges confused moderate DC with extreme DC in only 5 % of the evaluations. Finally, the evaluation performed by the untrained panel corroborated the relevance of the categories that describe the DC defect, since in 85.3 % of the evaluations performed by untrained panelists, the color of N meat was preferred over the color of DC meat. Overall, the results of the sensory tests demonstrate the technical viability of the proposed color scale since both trained personnel and consumers were able to use it to dictate the appearance of meat correctly.
Discussion
This research presents the first visual pattern for evaluating beef meat color in Mexico, scientifically supported by data obtained from domestic cattle. The developed scale contains categories that describe light, cherry-red, deep red, dark red, and very dark red-looking beef. These hues are visually differentiable and, also, show a high correlation with instrumental color variables, particularly with L*. The latter coincides with results from previous studies, in which L* was the variable best related to the visual appearance of the meat29,30.
Some studies performed in Mexico have used Chroma (C*<30) as one of the criteria to identify DC meat3. Although the instrument and measurement conditions in this study were different, C* values of less than 30 were also observed in meat with dark-cutting appearance. However, C* only explained about 30 % of the differences between the different levels of the scale, while for L*, the coefficient of determination was greater than 90 %. The high correlation between L* and visual appearance observed in this study suggests that instrumental measurements can either guide evaluators who use the visual scale or substitute the use of the latter in companies with instrumental technology to measure color.
Moreover, the categories included in the scale can be associated with specific commercial advantages or quality defects. For example, the meat represented in categories 1A and 1B has an appearance similar to that described in pale, soft, and exudative (PSE) meat31. This defect is associated with impaired functional properties, especially with a reduced water holding capacity. However, the PSE phenomenon occurs very rarely in cattle, and it usually only occurs when the carcasses are subjected to very slow chilling32. Nonetheless, 46 units (3.9 %) of the analyzed sample had an extremely pale appearance, and another 150 (12.9 %) were classified as moderately pale; probably due to slow chilling of carcasses or excessive muscularity that limits or delays heat loss and promotes a faster drop in muscle pH, conditions that could be common in many TIF slaughterhouses in Mexico. However, recent studies suggest that Mexican consumers perceive the light red color as a quality indicator in beef33, which implies that fresh meat with this appearance must not suffer price penalties.
The following two categories (2A and 2B) represent the typical appearance (bright cherry-red) that consumers look for in fresh beef4. Apparently, a good part of the beef produced in the country meets this demand, since 60 % of the samples analyzed presented these hues. Therefore, the identification of this type of meat helps to exploit to the maximum the competitive advantages offered by its favorable appearance for retail sales.
Moreover, category 3 describes the meat that is in the limit of acceptable quality. Its appearance is slightly darker, determined by the lowest L* values, which puts it at a disadvantage concerning cherry-red, which is associated with younger animals. As animals grow old, the lightness of meat decreases, which results in a darker appearance34. However, category 3 keeps a relatively safe total color difference (3-5 CIELAB units) regarding the categories that describe the DC defect (4 and 5).
Finally, categories 4 and 5 represent the DC defect, which leads to millionaire losses to the industry and is, by far, on a global scale, the most important quality defect in beef7. Although different degrees of the DC condition have been described (e.g., classic, light, and atypical), recent studies have shown that all share an undesirable dark appearance and deteriorated quality attributes5,35, for which they deserve economic penalization. In Mexico, according to estimations, the value of DC carcasses decreases by approximately 85 USD3. Although the proportion of units with DC appearance in the analyzed sample is low (7 %), the economic impact of this rate, if it occurred at a national scale, can represent millions of dollars, considering that the annual slaughter is 4 million heads, only on TIF slaughterhouses36. Therefore, the description of DC meat on the proposed scales is highly relevant, since it provides the basis for the early detection of this defect, offering the possibility of segregating the defective meat and, also, managing the slaughter-associated processes to reduce its incidence.
The calculation of
Moreover, validation proved the relevance of the followed scale developing strategy, with a high correlation between the trained sensory panel and the predictive variable used (L*); this undoubtedly contributed to more than 90 % of the trained judges correctly assigning the visual category to the evaluated samples. Similarly, the categories associated with DC, which is the primary quality defect in beef, are easily identified by both trained people and consumers. The latter opens the possibility of using the visual scale routinely in the industrial environment, as an alternative to instrumental measurements, which requires economic investments that are beyond the reach of most of the industry.
Despite what has been analyzed so far, it should be noted that the present study does not propose the use of the visual pattern as the only criterion to determine meat quality. Although it is widely documented that color is a key factor affecting consumer choices, it is known that it does not correlate well with tenderness or palatability of meat4. Hence, to evaluate the quality of carcasses, it will be necessary to complement the color evaluation with that of other quality attributes (e.g., final pH, physiological maturity of the animals, marbling, among others)7. Furthermore, the scale herein is based on measurements made at 24 h postmortem. Therefore, its application across segments of the distribution chain could not be entirely consistent, since storage temperature, type of packaging, muscle biochemistry, among other factors, can modify the color of meat and its stability11,37.
Moreover, although it is possible to opt for the exclusive use of instrumental measurement for color evaluation, certain precautions must be taken. First, the typical L* values reported for each category were measured with a spectrophotometer whose configuration (port size opening, geometry, illuminant, among others) may be different from that of other equipment. Therefore, the use of different instruments or configurations may vary the results.
Despite the latter, the developed scale can be very useful to estimate, from the slaughterhouses, whether the appearance of the meat could have a positive or negative impact on the consumer buying decision. Furthermore, its use can facilitate more efficient communication through the use of an objective technical descriptor, when marketing meat. In particular, the scale proved to work very well for the identification of meat with a dark-cutting appearance, the early detection of which, on the slaughterhouses, is of great economic importance.
Conclusions and implications
The descriptive scale developed in this study provides representative illustrations of beef appearance in Mexico, as well as the L* intervals associated with each one of them. The concurrence of visual and instrumental criteria in the tool allows its versatile implementation, either with sensory panels, with instrumental measurements, or by combining both. The scale is conceived as a tool for color evaluation on the slaughterhouse at 24 h postmortem and has shown excellent performance for the detection of meat with a dark-cutting appearance in validation tests performed under industrial conditions. In companies that perform carcass evaluation, this tool could be included as an additional criterion to define their quality.
Acknowledgments
This study was carried out with resources from the SAGARPA-CONACYT sector fund, project 109127. The authors thank Professor Melvin C. Hunt for his technical assistance in reviewing and developing the work methodology used in this study.
REFERENCES
1. Wulf D, Wise W. Measuring muscle color on beef carcass using the L*a*b* color space. J Anim Sci 1999;77(9):2418-2427. [ Links ]
2. Mancini RA, Hunt MC. Current research in meat color. Meat Sci 2005;71(1):100-21. [ Links ]
3. Leyva-García IA, Figuerosa-Saavedra F, Sánchez-López E, Pérez-Linares C, Barreras-Serrano A. Impacto económico de la presencia de carne DFD en una planta de sacrificio Tipo Inspección Federal (TIF). Arch Med Vet 2012;44(1):39-42. [ Links ]
4. Troy DJ, Kerry JP. Consumer perception and the role of science in the meat industry. Meat Sci 2010;86(1):214-226. [ Links ]
5. Prieto N, Lopez-Campos O, Suman SP, Uttaro B, Rodas-Gonzalez A, Aalhus JL. Exploring innovative possibilities of recovering the value of dark-cutting beef in the Canadian grading system. Meat Sci 2018;137(1):77-84. [ Links ]
6. Aus-Meat. Handbook of Australian meat, 7th ed. Australia: South Brisbane; 2005. [ Links ]
7. Aalhus JL, López-Campos Ó, Prieto N, Rodas-González A, Dugan MER, Uttaro B, Juárez M. Review: Canadian beef grading - Opportunities to identify carcass and meat quality traits valued by consumers. Can J Anim Sci 2014;94(4):545-556. [ Links ]
8. JMGA. Japan Meat Grading Association. Beef carcass grading standard. http://wagyu.org/breed-info/meat-grading/ . Accessed May 5, 2018. [ Links ]
9. Tatum D. Beef grading. National Cattlemen’s Beef Association. https://www.beefresearch.org/CMDocs/BeefResearch/PE_Fact_Sheets/Beef_Grading.pdf . Accessed May 4, 2018. [ Links ]
10. Carpenter CE, Cornforth DP, Whittier D. Consumer preferences for beef color and packaging did not affect eating satisfaction. Meat Sci 2001;57(4):359-363. [ Links ]
11. King DA, Shackelford SD, Wheeler TL. Relative contributions of animal and muscle effects to variation in beef lean color stability. J Anim Sci 2011;89(5):1434-51. [ Links ]
12. King DA, Shackelford SD, Kuehn LA, Kemp CM, Rodriguez AB, Thallman RM, Wheeler TL. Contribution of genetic influences to animal-to-animal variation in myoglobin content and beef lean color stability. J Anim Sci 2010;88(3):1160-1167. [ Links ]
13. Chávez A, Pérez E, Rubio MS, Méndez RD, Delgado EJ, Díaz D. Chemical composition and cooking properties of beef forequarter muscles of Mexican cattle from different genotypes. Meat Sci 2012;91(2):160-164. [ Links ]
14. SAGARPA. ACUERDO por el que se dan a conocer las Reglas de Operación del Programa de Fomento Ganadero de la Secretaría de Agricultura, Ganadería, Desarrollo Rural, Pesca y Alimentación. http://dof.gob.mx/nota_detalle.php?codigo=5327093&fecha=18/12/2013 . Consultado 4 May, 2018. [ Links ]
15. FAOSTAT. Food Balance Sheets. Food and Agricultural Organization of the United Nations, Statistics Division. http://faostat3.fao.org/download/FB/FBS/E . Accessed May 6, 2018 [ Links ]
16. SCFI. NMX-FF- 078-SCFI-2002. Productos pecuarios - carne de bovino en canal - clasificación (cancela a la NMX-FF-078-1991). http://www.economia-nmx.gob.mx/normas/nmx/2002/nmx-ff-078-scfi-2002.pdf . Consultado 5 May, 2018. [ Links ]
17. Girolami A, Napolitano F, Faraone D, Braghieri A. Measurement of meat color using a computer vision system. Meat Sci 2013;93(1):111-118. [ Links ]
18. Pérez LC, Figueroa SF, Barreras SA. Relationship between management factors and the occurrence of DFD meat in cattle. J Anim Vet Adv 2006;5(7):578-581. [ Links ]
19. Peréz LC, Figueroa-Saavedra F, Barreras-Serrano A. Management factors associated to DFD meat in bovine on desertic climate. Arch Zoot 2008;57(220):545-547. [ Links ]
20. Torrescano UG, Sánchez EA, Vásquez PM, Paz PR, Pardo GD. Characterization of bovine carcasses and meat from animals fattened in Central Sonora. Rev Mex Cienc Pecu 2010;1(2):157-168. [ Links ]
21. Miranda-de la Lama GC, Leyva IG, Barreras-Serrano A, Perez-Linares C, Sánchez-López E, et al. Assessment of cattle welfare at a commercial slaughter plant in the northwest of Mexico. Trop Anim Health Prod 2012;44(3):497-504. [ Links ]
22. Zorrilla-Rios JM, Lancaster PA, Goad CL, Horn GW, Hilton GG, Galindo JG. Quality evaluation of beef carcasses produced under tropical conditions of México. J Anim Sci 2013;91(1):477-482. [ Links ]
23. Mendez RD, Meza CO, Berruecos JM, Garces P, Delgado EJ, Rubio MS. A survey of beef carcass quality and quantity attributes in Mexico. J Anim Sci 2009;87(11):3782-3790. [ Links ]
24. AMSA. Meat color measurement guidelines. American Meat Sci ence Association. http://www.meatscience.org/publications-resources/printed-publications/amsa-meat-color-measurement-guidelines . Accessed May 5, 2018. [ Links ]
25. Abril M, Campo MM, Onenc A, Sanudo C, Alberti P, Negueruela AI. Beef colour evolution as a function of ultimate pH. Meat Sci 2001;58(1):69-78. [ Links ]
26. Costell E, Durán L. El análisis sensorial en el control de calidad de los alimentos. III. Planificación, selección de jueces y diseño estadístico. Rev Agroquím Tecnol Aliment 1981;21(4):454-470. [ Links ]
27. Fernández-Vázquez R, Stinco CM, Hernanz D, Heredia FJ, Vicario IM. Colour training and colour differences thresholds in orange juice. Food Qual Prefer 2013;30(2):320-327. [ Links ]
28. Martínez JA, Melgosa M, Pérez MM, Hita E, Negueruela AI. Note. Visual and instrumental color evaluation in red wines. Food Sci Technol Int 2001;7(5):439-444. [ Links ]
29. Holman BWB, Mao Y, Coombs CEO, van de Ven RJ, Hopkins DL. Relationship between colorimetric (instrumental) evaluation and consumer-defined beef colour acceptability. Meat Sci 2016;121(1):104-106. [ Links ]
30. Goñi V, Indurain G, Hernández B, Beriain MJ. Measuring muscle color in beef using an instrumental method versus visual color scales. J Muscle Foods 2008;19(2):209-221. [ Links ]
31. Adsitey F, Nurul H. Pale soft exudative (PSE) and dark firm dry (DFD) meats: causes and measures to reduce these incidences - a mini review. Int J Food Res 2011;18:11-20. [ Links ]
32. Aalhus JL, Best DR, Murray AC, Jones SDM. A comparison of the quality characteristics of pale, soft and exudative beef and pork. J Muscle Foods 1998;9:267-280. [ Links ]
33. Ngapo TM, Brana Varela D, Rubio Lozano MS. Mexican consumers at the point of meat purchase. Beef choice. Meat Sci 2017;134:34-43. [ Links ]
34. Gagaoua M, Picard B, Monteils V. Associations among animal, carcass, muscle characteristics, and fresh meat color traits in Charolais cattle. Meat Sci 2018;140:145-156. [ Links ]
35. Holdstock J, Aalhus JL, Uttaro BA, Lopez-Campos O, Larsen IL, Bruce HL. The impact of ultimate pH on muscle characteristics and sensory attributes of the longissimus thoracis within the dark cutting (Canada B4) beef carcass grade. Meat Sci 2014;98(4):842-849. [ Links ]
36. SIAP. Resumen estatal pecuario, sector porcino. Producción, precio, valor y peso de ganado en pie 2014. http://www.siap.gob.mx/ganaderia-resumen-estatal-pecuario/ . Consultado 5 May, 2018. [ Links ]
37. de Huidobro FR, Miguel E, Blazquez B, Onega E. A comparison between two methods (Warner-Bratzler and texture profile analysis) for testing either raw meat or cooked meat. Meat Sci 2005;69(3):527-36. [ Links ]
(Supplementary information)
Table S1 Visual category prediction models, tested in a step-by-step selection strategy, using the visual category as a dependent variable, and the instrumental color variables and their interactions as explicative variables (n= 1,165) in the Generalized Linear Model procedure of Statgraphics XV Centurion
| Explicative variables included in the model | SE±1 | P | R2 |
|---|---|---|---|
| L* | 0.40 | <0.0001 | 0.9145 |
| a* | 1.22 | <0.0001 | 0.2134 |
| b* | 1.13 | <0.0001 | 0.3269 |
| C* | 1.18 | <0.0001 | 0.2651 |
| h* | 1.05 | <0.0001 | 0.4172 |
| L*, a*, b*, C*, h* | 0.40 | <0.0001 | 0.9168 |
| L*, a*, b*, C* | 0.40 | <0.0001 | 0.9153 |
| L, a*, b* (L* x a* x b*) | 0.40 | <0.0001 | 0.9163 |
| L*, a*, (L* x a*) | 0.40 | <0.0001 | 0.9165 |
| L*, b*, (L* x b*) | 0.40 | <0.0001 | 0.9159 |
| L*, C*, (L* x C*) | 0.40 | <0.0001 | 0.9160 |
| L*, h*, (L* x h*) | 0.40 | <0.0001 | 0.9156 |
1Standard error of the estimator.
Table S2: F value and statistical significance level (P) of the ANOVA performed with the color grading data emitted by each trained judge (n= 36) in meat samples with light red, normal, moderate DC, and extreme DC appearances
Table S3: ANOVA performed with the color grading data emitted by trained sensory panel in meat samples with light red, normal, moderate DC, and extreme DC appearances
| Source | Sum of squares | DF1 | Mean square | F ratio | P value |
|---|---|---|---|---|---|
| Between groups | 141.022 | 3 | 47.0074 | 639.52 | 0.0000 |
| Intra-groups | 7.64444 | 104 | 0.0735043 | ||
| Total (Cor.) | 148.667 | 107 |
1Degrees of freedom.
Received: December 05, 2018; Accepted: July 30, 2019
 Este es un artículo publicado en acceso abierto bajo una licencia Creative Commons
