


Servicios Personalizados
Revista
Articulo
 texto en
  Inglés (pdf)
 Artículo en XML
 Referencias del artículo
 Enviar artículo por email
Indicadores
-
 Citado por SciELO
 -
 Accesos
Links relacionados
-
 Similares en
SciELO
Similares en
SciELO
Compartir

 Permalink
Revista mexicana de ciencias agrícolas
versión impresa ISSN 2007-0934
Rev. Mex. Cienc. Agríc vol.12 no.7 Texcoco sep./nov. 2021 Epub 22-Mar-2022
https://doi.org/10.29312/remexca.v12i7.2531
Articles
Competitiveness of the Mexican red tomato in the international market: analysis 2003-2017
1Instituto Tecnológico Superior de Mulegé. Loma de los frailes s/n, Col. Centro, Santa Rosalía, Baja California Sur, México. CP. 23920. Tel. 615 6890000. (ivan.vp@mulege.tecnm.mx; kennia.vl05@gmail.com).
In Mexico, the agro-livestock sector contributes about 3.4% of the national GDP, with horticultural activity standing out with 45% of the exports of the sector, where the red tomato represents 8.41%. Mexico is the main supplier of this product worldwide, with a share of 19% of world exports, above Spain or the Netherlands. The objective is to determine the competitiveness of the Mexican red tomato in the international market through the relative export advantage (RXA) and constant market share (CMS). Competitiveness of the Mexican product in the US market and a high market concentration were found, sending 98% of Mexican red tomato exports to that destination.
Keywords: agricultural product; competitiveness; exports; market
En México el sector agropecuario contribuye con cerca de 3.4% del PIB nacional, sobresaliendo la actividad hortofrutícola con 45% de las exportaciones del sector, donde el tomate rojo representa 8.41%. México es el principal proveedor a nivel mundial de este producto con una participación de 19% de las exportaciones mundiales por arriba de España o Países Bajos. El objetivo es determinar la competitividad del tomate rojo de México en el mercado internacional mediante la ventaja relativa de exportación (VRE) y la participación constante de mercado (CMS). Se encontró competitividad del producto mexicano en el mercado estadounidense y una alta concentración de mercado, enviando 98% de las exportaciones de tomate rojo mexicano hacia ese destino.
Palabras claves: competitividad; exportaciones; mercado; producto agrícola
Introduction
Agriculture in Mexico is an important activity not only because of food production but also because it generates jobs, foreign exchange and the related links that arise around the activity (Álvarez et al., 2017). In Mexico, the agro-livestock sector contributes about 3.4% of the gross domestic product (GDP), generates 13% of employment, registers four million production units (INEGI, 2007), covers an area of 110 million hectares, of which 32 million are for agricultural use (CEDRSSA, 2019) and contributes 1.75% of world agricultural exports.
Fruit and vegetable activity represents 45% of exports, which places it as the most dynamic activity in terms of exports since the signing of the North American Free Trade Agreement (Avendaño and Schwentesius, 2012; Ávila and González, 2012), with the export of products such as avocado (2.4%), lemons (2.86%), onion (2.23%), cucumber (3.31%), pepper (3.90%) and tomato (7.77%) (FAOSTAT, 2021) standing out. The agricultural sector in Mexico maintains a positive trade balance (SADER, 2021), which helps to stimulate the national economy with the generation of jobs and higher incomes.
Mexico contributes 1.70% of world tomato production, below China, Mainland China, India and the United States of America, among others, contributes 19% of the volume of exports worldwide, which places it as the main exporting country above Spain (14%) and the Netherlands (13%) (FAOSTAT, 2020). During the period from 2003 to 2017, an average of 2.5 million tons of red tomato were produced in Mexico and 14 759 million pesos are generated per year (SIAP, 2020).
Mexico has characteristics that have generated favorable conditions for the production and export of vegetables, such as climate, natural resources, availability of labor, geographical proximity to the U.S. market (considered the largest in the world) and use of technological innovations (Bracamontes and Méndez, 2011; Hernández et al., 2017; Hernández, 2019). This relates to David Ricardo’s comparative advantage, which determines who will produce a good. Krugman and Obstfeld (2006) mentioned that a country has a comparative advantage in the production of a good if the opportunity cost in the production of this good in terms of other goods is lower in this country than it is in other countries.
In addition, Pugel (2004) mentions that a country will have a comparative advantage when it exports those goods and services that it can produce at a lower opportunity cost and will import those goods and services that it would otherwise produce at a higher opportunity cost. For the measurement of export competitiveness in the international market, Vollrath’s (1991) revealed comparative advantage index can be used by means of the relative export advantage index and the revealed comparative advantage index. The relative export advantage indicates a country’s export advantages over the world (Ramírez et al., 2020).
The sources of comparative advantage can be: differences in the endowment of factors of production, technological differences or differences in demand (Macías, 2010). Studies have been carried out to measure the competitiveness of Mexican fruit and vegetable products in the international market, such as avocado (Torres, 2009), strawberry (Ávila and González, 2012; Ramírez et al., 2016), pecan nut (Ávila et al., 2020), coffee (Valencia, 2016), grape (Valencia and Duana, 2019), onion (Valencia and Espinoza, 2017), among others, or studies where the competitiveness of agricultural products is estimated, finding that Mexican fruits and vegetables are competitive in the world market (Avendaño and Schwentesius, 2005).
The objective of this paper is to determine the competitiveness of the Mexican red tomato in the international market by means of the relative export advantage and constant market share. The hypothesis of the document is that Mexico is highly competitive in red tomato exports and maintains a high concentration in the US market.
Production and international trade of red tomato
Tomato production worldwide has shown a significant growth of around 22% per year during the period from 2003 to 2017. The main producing countries are China (23%), Mainland China (22%) and to a lesser extent India (7%), the United States of America (7%) and Turkey (6%) (Figure 1). This group of countries concentrates 64% of the world tomato production. For its part, Mexico contributes 2% of world production and ranks 11th among tomato-producing countries.

Trusts Instituted in Relation to Agriculture (FIRA, for its acronym in Spanish), mentions that China and India stand out for their dynamism in world production, and this is partly due to the increase in China’s productivity, while in India, a greater part of the area sown was allocated to this vegetable (FIRA, 2017).
World tomato exports have grown, on average, by 4% per year. Mexico ranks as the world’s leading exporter of tomatoes, participating with about 19% of the export volume during the period 2003-2017. Behind, Spain and the Netherlands export approximately 13% each (Table 1).
Table 1 Main tomato-exporting countries (tons).
| Year | Spain | Jordan | Morocco | Mexico | Netherlands | Turkey | World |
| 2003 | 946 511 | 186517 | 179 804 | 903 384 | 690 949 | 227 400 | 4 615 576 |
| 2004 | 1 023 028 | 237 859 | 107 365 | 895 126 | 771 848 | 235 364 | 4 950 300 |
| 2005 | 923 907 | 285 169 | 166 570 | 900 767 | 770 750 | 250 182 | 5 072 827 |
| 2006 | 987 260 | 304 529 | 192 353 | 1 03 503 | 776 496 | 304 372 | 5 778 283 |
| 2007 | 880 630 | 386 968 | 297 593 | 1 07 646 | 834 589 | 372 094 | 6 459 293 |
| 2008 | 938 596 | 393 983 | 346 222 | 1 042 727 | 839 550 | 439 729 | 6 547 256 |
| 2009 | 829 540 | 431 713 | 410 118 | 1 136 299 | 923 954 | 542 259 | 6 962 655 |
| 2010 | 738 773 | 371 257 | 372 112 | 1 509 616 | 943 119 | 574 279 | 7 190 079 |
| 2011 | 964 054 | 434 830 | 392 435 | 1 493 316 | 1 023 496 | 576 573 | 7 562 419 |
| 2012 | 908 755 | 418 516 | 443 811 | 1 472 390 | 977 664 | 560 430 | 7 440 702 |
| 2013 | 1 004 009 | 611 519 | 457 854 | 1 535 157 | 1 013 529 | 483 046 | 7 864 153 |
| 2014 | 958 272 | 517 207 | 485 421 | 1 537 946 | 1 021 484 | 585 202 | 8 485 605 |
| 2015 | 949 366 | 419 287 | 417 332 | 1 560 588 | 1 010 843 | 541 355 | 8 137 967 |
| 2016 | 911 106 | 361 439 | 524 907 | 1 748 858 | 992 601 | 485 963 | 8 576 288 |
| 2017 | 809 612 | 282 271 | 527 724 | 1 742 619 | 1 089 230 | 522 876 | 8 258 502 |
| (%) participation | 13% | 5% | 5% | 19% | 13% | 6% | 100% |
| AAGR | -1% | 3% | 7% | 4% | 3% | 6% | 4% |
Elaboration with information from FAOSTAT.
However, when estimating the average annual growth rate, it is observed that Morocco and Turkey grew above the world average of tomato exports (4%). The first had a growth rate of 7% and Turkey 6%. For its part, Mexico grew at the same rate as world exports; while Spain showed a 1% decrease in tomato exports (FAOSTAT, 2020).
The main importers of tomatoes during the analysis period were the United States of America (21%), Germany (11%), the Russian Federation (9%), France (8%) and the United Kingdom of Great Britain (6%). While the Russian Federation and the United States of America grew by an annual average of 6% and 4%, respectively (FAOSTAT, 2020). Although the United States of America stands out as one of the main producers worldwide, its demand is higher, so it requires complementing apparent consumption with imports.
Red tomato production in Mexico
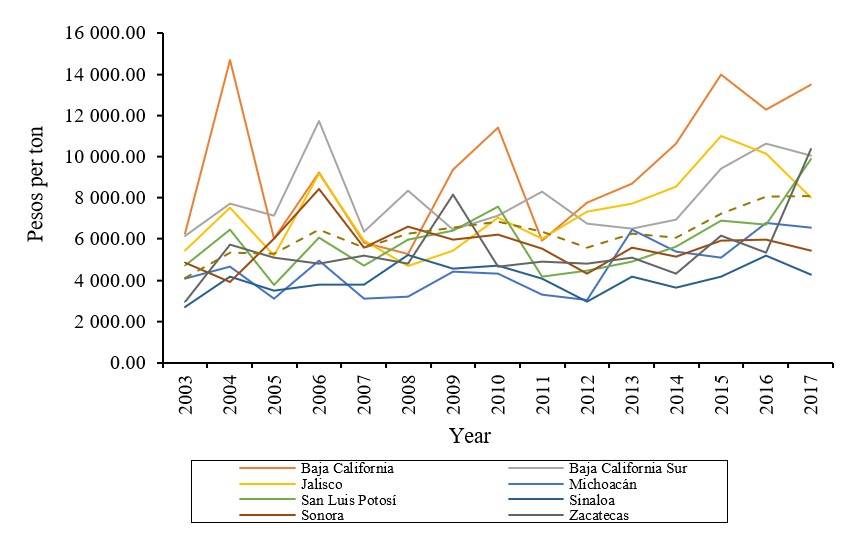
In Mexico, most of the states produce red tomatoes, however, eight states concentrate 72.02% of the national production (SIAP, 2020). The main producer is Sinaloa, which, during the period 2003-2017, contributed with more than 32% nationwide (Table 2). Behind, Baja California (8.25%), Michoacán (7.05%), San Luis Potosí (6.62%), Jalisco (5.43%), Zacatecas (4.73%), Baja California Sur (4.54%) and with lower participation Sonora (3.12%) (SIACON, 2020).
Table 2 Mexico: volume of red tomato production, 2003-2017 (tons).
| Year | Baja California | Baja California Sur | Sinaloa | Sonora | Michoacan | San Luis Potosi | Jalisco | Zacatecas | Rest of the states | National |
| 2003 | 251057 | 122045 | 742 685 | 68 377 | 237454 | 208 799 | 102 469 | 58 939 | 379 335 | 2171159 |
| 2004 | 294076 | 113450 | 991 113 | 51 339 | 162476 | 125 123 | 109 930 | 37 333 | 429 790 | 2314630 |
| 2005 | 262458 | 117954 | 845 477 | 47 412 | 150730 | 162 053 | 117 500 | 70 347 | 472 316 | 2246246 |
| 2006 | 216000 | 114462 | 783 314 | 73 096 | 134178 | 120 120 | 87 534 | 106212 | 458 516 | 2093432 |
| 2007 | 196388 | 132873 | 827 011 | 63 609 | 224898 | 120 289 | 141 796 | 112980 | 605 559 | 2425403 |
| 2008 | 206257 | 112028 | 782 910 | 43 994 | 175703 | 139 653 | 122 421 | 76 199 | 604 038 | 2263202 |
| 2009 | 180135 | 102607 | 668 303 | 41 400 | 140185 | 112 150 | 115 544 | 95 121 | 588 370 | 2043815 |
| 2010 | 221626 | 103212 | 687 057 | 60 131 | 155354 | 98 093 | 140 802 | 144361 | 667 155 | 2277791 |
| 2011 | 162325 | 92 883 | 345 011 | 60 718 | 148081 | 108 614 | 136 540 | 134369 | 683 941 | 1872482 |
| 2012 | 189636 | 106859 | 1039368 | 82 324 | 171039 | 116 137 | 156 660 | 139131 | 837 217 | 2838370 |
| 2013 | 196453 | 108422 | 983 288 | 91 856 | 98 435 | 141 108 | 134 437 | 143905 | 796 454 | 2694358 |
| 2014 | 135741 | 141237 | 867832 | 121387 | 169769 | 196 011 | 158 561 | 151692 | 932 933 | 2875164 |
| 2015 | 220848 | 123032 | 849342 | 136045 | 223678 | 221 561 | 161 805 | 145234 | 1016785 | 3098329 |
| 2016 | 226062 | 135223 | 924153 | 128038 | 235,785 | 306 621 | 158 232 | 191654 | 1043387 | 3349154 |
| 2017 | 179574 | 99379 | 937796 | 118526 | 253576 | 340 836 | 219 134 | 193363 | 1127524 | 3469707 |
| AAGR | -2.21 | -1.36 | 1.57 | 3.74 | 0.44 | 3.32 | 5.2 | 8.24 | 7.53 | 3.17 |
| (%) of participation 2003-2017 | 8.25 | 4.54 | 32.27 | 3.12 | 7.05 | 6.62 | 5.43 | 4.73 | 27.98 | 100 |
Elaboration with data obtained from SIAP.
Although the main producer is Sinaloa, it maintains a less significant growth compared to Zacatecas and Jalisco, which had an average annual growth of 8% and 5%. According to Macías (2010), the loss of productivity in Sinaloa is mainly due to water scarcity and pest growth. While Zacatecas has intensified the use of production systems under protected agriculture in an expansive manner (Padilla et al., 2008). Similarly, Sonora, Michoacán and San Luis Potosí grew in a smaller proportion than the national average.
While the states of Baja California and Baja California Sur had negative growth rates of 2.21% and 1.36% during the period from 2003 to 2017. These last two states, located in arid zones, have limitations of water resources due to the overexploitation of their aquifers and low rainfall, which cause the availability and quality of water to be insufficient for agricultural production, essential elements for the development of the activity (Velasco et al., 2019). Some states such as Baja California, Baja California Sur, Jalisco and Michoacán were established as an operation of Sinaloa’s companies that sought to complement the offer, deseasonalize production and greater access of exports to take advantage of the growing North American market (Avendaño, 2008; FIRA, 2019).
During the period from 2003 to 2017, it was found that these same states showed a growth in the value of production of approximately 6% and maintained a price paid to the producer above the national average ($6 281.00 t-1), with Baja California standing out, with a price above 50% of the national (Figure 2).
Materials and methods
To analyze the competitiveness of the Mexican red tomato in the US. market, two methods were used: the relative export advantage (RXA) index proposed by Vollrath (1989) and the method of constant market share analysis (CMS) according to Ahmadi-Esfahani’s (1995) approach. To this end, statistical information was obtained from FAOSTAT and ERS-USDA.
Relative export advantage (RXA) index
The RXA index proposed by Vollrath is actually a rethinking of the index proposed by Ballasa, called revealed comparative advantage (RCA) (Laursen, 1998). The index (RXA) reflects that a given country has a relative export advantage in a product if (RXA) is positive or greater than 1, while if (RXA) is negative or less than 1, it indicates a relative export disadvantage. In general terms, the (RXA) indicates that as its value increases, a country is considered more specialized and more competitive. The RXA index is defined as follows: RXAai= (Xai/Xni)/(Xar/Xnr). Where: RXAai= is the relative advantage of exports of the product a in country i. Xai= is the value of exports of the product a in country i. Xni= is the value of total exports in country I excluding product a. Xar= is the value of the total exports of the product a in the world, excluding country i. Xnr= is the value of total exports in the world excluding product a and country i.
Constant market share (CMS) analysis
The CMS method allows explaining the change in the exports of a given product from its structural and competitiveness components. This method was proposed by Leamer and Stern, later adapted to expand the analysis of export growth (Avendaño, 2008). Ahmadi-Esfahani (1995) decomposes the change in exports into two levels: the first level of decomposition is carried out according to the following equality: Δq= Sj0ΔQj + ΔSjQj0 + ΔSjΔQj. Sj0ΔQj= structural effect, it reflects the expected change in exports if the country’s initial share of the world market and in the destination country remains constant.
If this component is positive, it means that the increase in demand for the product favors the increase in exports. ΔSjQj0= competitiveness effect or residual, it reflects the part of the change in exports that can be attributed to an increase in competitiveness in the analysis period. If this component is positive, it means that competitiveness has increased, while if the sign is negative then it is interpreted as a loss of competitiveness. ΔSjΔQj= interaction or second-order effect, it reflects the effect of a change in both market share and demand on the change of exports.
The second level of decomposition is performed by obtaining six additional effects from the components described in the first level of decomposition. In this case the equality is as follows: Δq= St0ΔQj + (Sj0ΔQj - St0ΔQj) + ΔStQj0 + (ΔSjQj0 - ΔStQj0) + (QtI / Qt0-I) (ΔSjQj0) + (ΔSjΔQj - QtI / Qt0-I) (ΔSjQj0)). St0ΔQj= growth effect, it reflects the part of the increase in exports that is due to an increase in world demand while the share of the exporting country in the world market remains constant.
(Sj0ΔQj - St0ΔQj) = market effect, it measures the additional change in exports, while the exporter maintains its share of the target market constant. If the sign is positive, it implies a concentration of exports in each market. ΔStQj0= pure residual effect, it reflects the change in exports that would occur due to a change in overall competitiveness. ΔSjQj0 - ΔStQj0= static structural residual effect, it reflects the change in exports that is attributed to a change in competitiveness in each market. QtI/Qt0-I (ΔSjQj0)= pure second-order effect as it measures the interaction between the change in the exporter’s share of the target market and the change in world demand. ΔSjΔQj - (QtI / Qt0-I) (ΔSjQj0)= dynamic structural residual effect, it reflects the interaction between the change in the exporter’s share of the target market and the change in the demand of that market.
Results and discussion
The competitiveness of a product in the international market depends on its comparative advantages and is a function of production costs, which include structure, transportation and marketing costs. Considering that this is affected by factors such as product quality, seasonality of production and market, degree of differentiation and government policies of both the exporting and importing country (Contreras-Castillo, 1999). For Sánchez-Gómez et al. (2019), Mexico bases its comparative advantages on labor and excess supply of land with productive potential.
During the analysis period 2003-2017, Mexican tomato exports grew by an annual average of 4%, concentrating 98% toward the U S market. The latter being the main importer worldwide, absorbing 21% of world tomato imports (FAOSTAT, 2020). Sánchez-Gómez et al. (2019) mention that, in 2013, Mexican tomato exports to the US. market represented 32.61% of total exports.
The RXA index of the Mexican red tomato in the U.S. market had a positive value, that is, it shows competitiveness throughout the period 2003-2017, in addition, red tomato exports showed an average annual growth rate of 6% (Figure 3). Its competitiveness is mainly due to comparative advantage, influenced by factors of geographical proximity, price, quality and the seasonality of tomato production in the United States of America, which decreases in the winter (Hernández et al., 2004). In addition, it is derived from the integration process between Mexico and the United States of America (Macías, 2003).

Figure 3 Mexico: tomato exports and relative export advantage index in the U S market, 2003-2017. Elaboration with information from FAOSTAT.
Although the RXA indicator is greater than 1, and the higher it is, the more specialized it is considered, in recent years, since 2011 the competitiveness of the Mexican red tomato in the U.S. market has decreased, with the RXA index going from 33 to 18. Although competitiveness is positive, it shows a downward trend. Which would indicate that Mexico cedes its market share to other countries and that it loses specialization in this subsector. According to Avendaño et al. (2006), Canada is specializing in greenhouse tomato production. This may be due to the different trade and phytosanitary policies imposed by the United States of America, for several reasons, the first derived from the fact that in some years there were epidemiological outbreaks associated with fruits and vegetables, including tomatoes.
In response to these outbreaks, in 1997, Produce and Imported Food Safety Initiative was designed (Avendaño et al., 2006). The second, caused by the imposition of tariffs on Mexican tomato exports in order to protect producers in Florida, the main tomato-producing area in that country or because of accusations of unfair trade practices, dumping against Mexican tomato producers (Avendaño and Acosta, 2009; CEDRSSA, 2018).
Likewise, Soto (2018) found that Mexico shows competitiveness in tomato exports during the period from 1994 to 2016 when analyzing the revealed comparative advantage index. In addition, he points out that Mexico maintains levels of competitiveness higher than its NAFTA trading partners and China. For their part, Crespo and Plzákova (2018), in their study, conclude that Mexican tomato exports in the U S market are the most competitive and with a positive trend compared to Guatemala, Canada, the Dominican Republic and the Netherlands.
Constant market share (CMS)
The CMS shows the competitiveness and behavior of exports in the destination market. The first and second order of decomposition were estimated for the main exporting countries of red tomato in the market of the United States of America, where Mexico concentrates about 89%. Canada exports approximately 10% and with a smaller share, but during the period, the Dominican Republic, Guatemala and the Netherlands have maintained their exports (Figure 4).
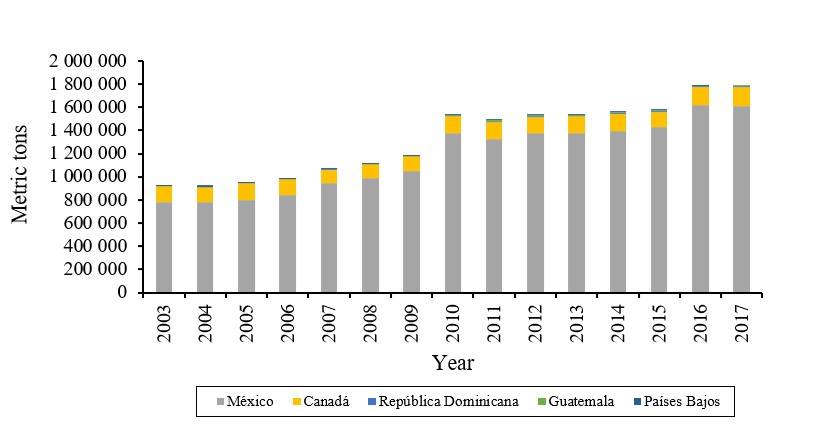
Figure 4 Main tomato-exporting countries to the United States of America, 2003-2017 (metric tons). Elaboration with data from ERS-USDA.
The results of the application of the CMS method are shown in Table 3. The first aspect that stands out is that the change in the volume of exports was positive for Mexico, Canada, the Dominican Republic and Guatemala, while for the Netherlands it is negative.
Table 3 Constant market share of red tomato exports in the market of the United States of America, 2003-2017.
| Concept | Mexico | Canada | Dominican Republic | Guatemala | Netherlands |
| First-order effect | |||||
| Change in exports | 757 106.78 | 21 857.21 | 5 648.55 | 5 139.44 | -13 564.91 |
| Structural effect | 654 934.65 | 108565.28 | 17.52 | 1.08 | 12 668.53 |
| Competitiveness effect | 53 229.55 | -45 173.11 | 2 933.65 | 2 676.97 | -13 667.08 |
| Second-order effect | 48 942.57 | -41 534.97 | 2 697.38 | 2 461.38 | -12 566.36 |
| Second-order effect | |||||
| Growth effect | 400 927.52 | 58 338.34 | 202.82 | 10 070.85 | 306 647.53 |
| Market effect | 254 007.13 | 50 226.94 | -185.3 | -10 069.77 | -293 979 |
| Pure residual effect | 57 158.4 | -9 127.17 | 2 174.57 | 3 373.38 | -53 579.17 |
| Static structural residual effect | -3 928.84 | -36 045.93 | 759.09 | -696.4 | 39 912.09 |
| Pure second-order effect | 37 875.05 | -32 142.55 | 2 087.42 | 1 904.78 | -9 724.69 |
| Dynamic structural residual effect | 11 067.52 | -9 392.42 | 609.97 | 556.60 | -2 841.67 |
Elaboration with data from FAOSTAT and ERS-USDA.
At the first level of decomposition, the structural effect is positive for all countries, reflecting growth in tomato demand that favors exports, mainly for Mexico. Crespo and Plzákova (2018) conducted a study selecting the same countries, obtaining that the structural effect is positive for all countries, where Mexico has the greatest advantage given its geographical proximity to the U.S. market. In another study, Avendaño and Acosta (2009) found that the structural effect is positive for tomato-exporting countries that were selected for the U S market (Canada, Spain, Israel, Mexico and the Netherlands) and they point out a positive impact on world tomato demand.
In the case of the competitiveness effect, the sign is positive, mainly for Mexico and in less impact for the Dominican Republic and Guatemala, showing a loss for Canada and the Netherlands. The second-order effect shows the influence of market share and changes in demand for red tomato exports, it is positive for Mexico, the Dominican Republic and Guatemala, derived from the behavior in competitiveness. The increase in world demand for red tomatoes grew on average 4% per year of the volume of imports (FAOSTAT, 2020), causing a positive impact on the growth effect for all countries during this analysis period.
Avendaño and Acosta (2009) indicate similar results, finding that the growth effect is positive for all countries, mainly favoring the Netherlands; however, exports its exports and Mexico’s exports have been displaced by Canada. The market effect is positive for Mexico and Canada, which shows that both concentrate their exports toward a single market. In the specific case of Mexico, it exports about 98% of the volume of red tomatoes to that destination. While, for Guatemala, the Dominican Republic and the Netherlands, the sign is negative, related to market diversification; for instance, Guatemala, in 2017, exported to El Salvador 44 073 tons and only 6 221 tons to the United States of America. More than 90% of exports to the US. market are concentrated in Mexico, generating vulnerability to Mexican producers when subjected to the market conditions of the United States of America, changes in purchasing and consumption patterns and the country's economic situation.
The pure residual effect is positive for Mexico, Guatemala and the Dominican Republic, showing an increase in competitiveness. Despite this, the static structural residual effect shows a positive sign for the Dominican Republic and the Netherlands, indicating an improvement in their competitiveness, generating greater participation in the world market. Finally, the pure second-order effect and the dynamic structural residual effect show a positive sign for Mexico, the Dominican Republic and Guatemala, which means that tomato-exporting countries have been able to increase their share of the U S market, at the same rate as world demand and demand in the destination market were growing.
Conclusions
Mexico is a highly competitive country in the export of red tomato in the market of the United States of America, derived from its geographical location, the use of technological innovations, availability of land, labor, among other factors that are related to comparative advantage. The little market diversification of Mexican tomato exports shows a vulnerability as they are subject to tariff and non-tariff barriers imposed by the destination market to support and protect local producers.
Although Mexico has shown competitiveness during the period of analysis, it is important to design marketing strategies that allow it to explore new destinations and maintain the share of exports. To do this, it is suggested that Mexican producers take advantage of the trade agreements that have been signed with different countries, product differentiation through its varieties and forms of production, in addition to entering the market of processed tomato products.
Literatura citada
Ahmadi, F. Z. 1995. Wheat market share in the presence of Japanese import quotas. J. Policy Model. 3(17):315-323. [ Links ]
Álvarez, M. M. T.; Núñez, R. M. A. y Wendladt, A. T. R. 2017. Caracterización de la cadena de valor del tomate rojo fresco en México. Rev. Glob. Negoc. 3(5):45-58. [ Links ]
Avendaño, R. B. D. 2008. Globalización y competitividad en el sector hortofrutícola: México el gran perdedor. México. Rev. Cotid. 147:91-98. [ Links ]
Avendaño, R. B. D. y Acosta, M. A. I. 2009. Midiendo los resultados del comercio agropecuario mexicano en el contexto del TLCAN. Rev. Estud. Socia. 33(17):41-81. [ Links ]
Avendaño, R. B. D.; Rindemann, S. R.; Lugo, M. S. Y. y Mungaray, L. A. 2006. La inocuidad alimentaria en México. Las hortalizas frescas de exportación. UABC-Miguel Ángel Porrúa. 1a. (Ed.). Mexicali, Baja California, México. 226 p. [ Links ]
Avendaño, R. B. y Schwentesius, R. R. 2012. El sector hortofrutícola mexicano de exportación: acciones y políticas para su fortalecimiento. In: políticas agropecuarias, forestales y pesqueras. Análisis estratégico para el desarrollo. Calva, J. L. (Coord.). 9. Juan Pablos (Ed.). México, DF. 305-319. [ Links ]
Avendaño, R. B. y Schwentesius, R. R. 2005. Factores de competitividad en la producción y exportación de hortalizas: el caso del Valle de Mexicali, BC. México. Rev. Latinoam. Econ. Prob. Des. 140(36):165-192. [ Links ]
Ávila, A. D. y González, M. D. 2012.La competitividad de las fresas (Fragaria spp.) mexicanas en el mercado nacional, regional y de Estados Unidos. México. Rev. Agric. Soc. Des. 1(9):17-27. [ Links ]
Ávila, A. D.; González, M. D.; Montaño, M. I. E. y Vizcaíno, V. L. A. 2020. Análisis de la competitividad de nuez pecanera mexicana en el mercado internacional. Rev. Mex. Cienc. Agríc. 4(11):895-904. [ Links ]
Bracamontes, A. y Méndez, R. 2011. Subvenciones y reconversión productiva. El caso del trigo en Sonora. México. El colegio de sonora. Hermosillo, Sonora, México. 204 p. [ Links ]
CEDRSSA. 2018. Centro de Estudios para el Desarrollo Rural Sustentable y la Soberanía Alimentaria. La producción y el comercio del tomate en México. http://www.cedrssa.gob.mx /files/b/13/86Tomate.pdf. [ Links ]
CEDRSSA. 2019. Centro de Estudios para el Desarrollo Rural Sustentable y la Soberanía Alimentaria. Reporte resultados de la encuesta nacional agropecuaria 2017. http://www.cedrssa.gob.mx/files/b/13/37ResultadosENA2017.pdf. [ Links ]
Contreras, C. J. M. 1999. La competitividad de las exportaciones mexicanas de aguacate: un análisis cuantitativo. México. Rev. Chapingo. Ser. Hortic. 5:393-400. [ Links ]
Crespo S. L. and Plzákova L. 2018. Production of tomatoes in Mexico and its competitiveness in the U.S. market.Hradec Economics Days 2018 171-179. 10.36689/uhk/hed/2018-01-016. [ Links ]
FIRA. 2017. Fideicomisos Instituidos en Relación con la Agricultura. Panorama Agroalimentario, tomate rojo 2017. https://www.inforural.com.mx/fira-panorama-agroalimentario-tomate-rojo-2019/. [ Links ]
FAOSTAT. 2020. Organización de las Naciones Unidas para la Alimentación y la Agricultura. Estadísticas. http://www.fao.org/faostat/es/#home. [ Links ]
Hernández, M. J.; García, M. R.; Valdivia, A. R. y Omaña, S. J. M. 2004. Evolución de la competitividad y rentabilidad del cultivo del tomate rojo (Lycopersicon esculentum) en Sinaloa, México. Agrociencia. 38:431- 436. [ Links ]
Hernández, P. L. 2019. Desarrollo tecnológico e integración comercial de los productores agrícolas de la Costa de Hermosillo en la globalización. México. Rev. Reg. Socie. 31:1-25. [ Links ]
INEGI. 2007. Instituto Nacional de Estadística y Geografía. Censo Agrícola, Ganadero y Forestal 2007. https://www.inegi.org.mx/programas/cagf/2007/. [ Links ]
Krugman, R. P. y Obstfeld, M. 2006. Economía internacional. 7ª (Ed.). Pearson Education. [ Links ]
Laursen, K. 1998. Revealed comparative advantage and the alternative as measures of international specialization. Danish research unit for industrial dynamics, working paper. 98-30 pp. [ Links ]
Macias, M. A. 2003. Enclaves agrícolas modernos: el caso del jitomate mexicano en los mercados internacionales. México. Región y Sociedad. 26(15):103-151. [ Links ]
Macías, M. A. 2010. Competitividad de México en el mercado de frutas y hortalizas de Estados Unidos de América, 1989-2009. Rev. Agroalimentaria. 31(16):31-48. [ Links ]
Padilla, B. L. E.; Rumayor, R. A. F. y Pérez, V. O. 2008. La competitividad sistémica de la industria del tomate de agricultura protegida en Zacatecas. México. Rev. Merc. Negoc. 9(17):38-59. [ Links ]
Pugel, T. A. 2004. Economía internacional . 12ª (Ed.). Mc Graw-Hill. [ Links ]
Ramírez, P. L. C.; Caamal, C. I.; Pat, F. V. G.; Martínez, L. D. y Pérez, F. A. 2020. Análisis de los indicadores de competitividad de las exportaciones de fresa mexicana. Rev. Mex. Cienc. Agríc. 4(11):815-827. [ Links ]
Ramírez, P. L. C.; Caamal, C. I.; Pat, F. V. G. y Martínez, L. D. 2016. Índices de competitividad de la fresa (Fragaria vesca L.) de México en el mercado mundial. Agroprod. 5(9):29-34. [ Links ]
SADER. 2021. Secretaría de Agricultura y Desarrollo Rural. Análisis de la balanza comercial agroalimentaria de México. https://www.gob.mx/cms/uploads/attachment/file/627936/ Balanza- Comercial-Agropecuaria- y-Agroindustrial-enero-2021.pdf. [ Links ]
Sánchez-Gómez, C.; Caamal-Cauich, I. y del Valle-Sánchez, M. 2019. Exportación hortofrutícola de México hacia los Estados Unidos de América. Estudios Sociales. Rev. Aliment. Contemporánea y Desarrollo Regional. 29(54):1-20. [ Links ]
SIACON. 2020. Servicio de Información Agroalimentaria y Pesquera. Producción agrícola. https://www.gob.mx/siap/documentos/siacon-ng-161430. [ Links ]
SIAP. 2020. Sistema de Información Agroalimentaria y Pesquera. Producción agropecuaria y pesquera. https://www.gob.mx/siap/acciones-y-programas/produccion-agricola-33119. [ Links ]
Soto, H. D. 2018. Análisis de la competitividad del tomate mexicano en el contexto del TLCAN: escenario ante el mercado chino. Rev. Econ. Admin. 15(1):15-31. [ Links ]
Torres, P. V. H. 2009. La competitividad del aguacate mexicano en el mercado estadounidense. Revi. Geog. Agríc. 43:61-79. [ Links ]
Valencia, S. K. y Zetina, E. A. M. 2017. La cebolla mexicana: un análisis de competitividad en el mercado estadounidense, 2002-2013. Región y Sociedad. 29(70):133-153. https://doi.org/10.22198/rys.2017.70.a348. [ Links ]
Valencia, S. K. y Ávila, D. 2019. La competitividad del comercio de uva en el mercado internacional y en Estados Unidos: el caso de México y Perú. Rev. Cimexus. 14. 10.33110/cimexus140103. [ Links ]
Valencia, S. K. 2016. Competitividad de las exportaciones de café de Colombia, Guatemala y México hacia el mercado estadounidense (2001-2014). Rev. Ciencia ergo-sum. 23:239-246. [ Links ]
Velasco, A. L.; De la O. B. V.; Ruiz, C. J. S. y Méndez, H. S. 2019. Gestión del agua en empresas productoras de hortalizas del Valle de San Quintín, Baja California. Rev. Glob. Negoc. 7(3):87-94. [ Links ]
Vollrath, T. 1989. Competitiveness and protection in world agriculture. United States. Agriculture Information Bulletin. 567:1-9. [ Links ]
Vollrath, T. 1991. A theoretical evaluation of alternative trade intensity measures of revealed comparative advantage. Review of World Economics. 127(2):265-279. [ Links ]
Received: June 01, 2021; Accepted: September 01, 2021
 Este es un artículo publicado en acceso abierto bajo una licencia Creative Commons
