


Servicios Personalizados
Revista
Articulo
 texto en
  Inglés (pdf)
 Artículo en XML
 Referencias del artículo
 Enviar artículo por email
Indicadores
-
 Citado por SciELO
 -
 Accesos
Links relacionados
-
 Similares en
SciELO
Similares en
SciELO
Compartir

 Permalink
Revista mexicana de ciencias agrícolas
versión impresa ISSN 2007-0934
Rev. Mex. Cienc. Agríc vol.8 no.1 Texcoco ene./feb. 2017
https://doi.org/10.29312/remexca.v8i1.70
Articles
Relationship between performance indicators and irrigation qualityusing central pivot
1Escuela Superior de Agricultura del Valle del Fuerte-UAS. Calle 16 y ave. Japaraqui S/N. Juan José Ríos, Ahome, Sinaloa, México, CP. 81110. Tel. 687 8960908. (blancalopezvzla@hotmail.com).
2Facultad de Agronomía-UAS. Carretera Culiacán-El Dorado, km 17.5. Sinaloa, México. CP. 80000. Tel. 667 846-1084. (tdiaz@hotmail.com; teresadejesus_v@yahoo.com.mx).
3. Centro de Investigación en Química Aplicada. Enrique Reyna Hermosillo Núm. 140. Saltillo, Coahuila, México, CP. 25294, Tel. (844) 438-9830, ext 1253. (juan.munguia@ciqa.edu.mx).
4Universidad Tecnológica de Culiacán, Carretera Culiacán-Imala, km 2.0. Culiacán, Sinaloa, México. CP. 80014. Tel. 667 1041599. (parpolo@yahoo.com.mx).
The use of water for agriculture in regions under conditions of scarcity and low efficiencies, requires research, innovation and an appropriate technological transfer, to improve the quality of irrigation. The tools to optimize the use of water include pressurized irrigation systems, which despite the technological advantages, require proper maintenance and operation for the correct agronomic and hydraulic operation, so its evaluation must be a routine procedure. The central pivot irrigation system has advantages over other pressurized systems and is a good choice for the production of some crops. The traditional performance indices are the coefficient of uniformity and uniformity of water distribution. The objective of the study was to compare irrigation quality based on performance indicators: the Heermann and Hein (CUh) uniformity coefficient, distribution uniformity (UD), adequately irrigated area (ARA) and application efficiency (Ea) and determine the relationship between them. The rainfall assessments were conducted in northern Sinaloa, Mexico, in two cropping cycles (2013-2015). Rainfall showed a “high quality” irrigation with a “very well-watered” area, the analysis by sections showed the lowest performance in sections one, two and the pendant. The analysis of the total rainfall showed high ratios CUh-ARA, CUh-Ea and Ea-ARA (R2= 0.9262, 0.8661, 0.9041, respectively) and for sections only in CUh-ARA (R2= 0.7648); the performance indicators CUh and ARA are sufficient to evaluate the quality of irrigation.
Keywords: adequately irrigated area; efficiency; sprinkler irrigation; uniformity
El uso del agua para la agricultura en regiones bajo condiciones de escasez y bajas eficiencias, requieren de investigación, innovación y una apropiada transferencia tecnológica, para mejorar la calidad del riego. Las herramientas para optimizar el uso del agua incluyen sistemas de riego presurizados, que a pesar de las ventajas tecnológicas, requieren de un mantenimiento y operación adecuados para el correcto funcionamiento agronómico e hidráulico, por que su evaluación debe ser un procedimiento rutinario. El sistema de riego por pivote central presenta ventajas sobre otros sistemas presurizados y es una buena opción para la producción de algunos cultivos. Los índices de desempeño tradicionales son el coeficiente de uniformidad y uniformidad de distribución del agua. El objetivo del estudio fue comparar la calidad del riego a partir de los indicadores de desempeño: coeficiente de uniformidad de Heermann y Hein (CUh), uniformidad de distribución (UD), área regada adecuadamente (ARA) y eficiencia de aplicación (Ea) y determinar la relación entre ellos. Las evaluaciones pluviométricas se realizaron en el norte de Sinaloa, México, en dos ciclos agrícolas (2013-2015). La pluviometría mostró una “alta calidad” del riego con un área “muy bien regada”, el análisis por tramos mostró el menor desempeño en los tramos uno, dos y el colgante. El análisis de la pluviometría total mostró alta relaciones CUh-ARA, CUh-Ea y Ea-ARA (R2= 0.9262, 0.8661, 0.9041, respectivamente) y por tramos solo en CUh-ARA (R2= 0.7648); los indicadores de desempeño CUh y ARA son suficientes para evaluar la calidad del riego.
Palabras clave: área regada adecuadamente; eficiencia; riego por aspersión; uniformidad
Introduction
The water is a key factor in human society and its care is a constant challenge (Samian et al., 2015). At the global level, the availability of readily accessible freshwater resources is limited (Yacoubi et al., 2012; Cisneros et al., 2014). The agricultural activity is the main consumer of water, so measures should be taken to be more efficient in its use (Castro et al., 2008). The area under cultivation in the world is approximately 1 527 million hectares, of which 19.7% corresponds to agriculture under irrigation (FAO, 2011). The large irrigation zones in Mexico are located in the arid and semi-arid zones, which require irrigation to ensure commercial yields (Flores et al., 2014). The irrigation is a limiting factor in production, so a good irrigation should be characterized by high efficiency and uniformity to ensure a rational use of this (Ortiz et al., 2012). The methods used for irrigation by gravity are the most common to apply water to agricultural land in arid, semi-arid and sub-humid areas worldwide and Mexico is no exception (Benjamín et al., 1994; González et al., 2006).
In Mexico, about 22 million hectares are used for agriculture, 6.4 million are cultivated under irrigation and 10% use pressurized irrigation systems (CONAGUA, 2009), but with an overall efficiency of water use that does not exceed 40% (INIFAP, 2010). As a result of the low efficiency of application of gravity irrigation, it is necessary to study different irrigation management alternatives (Flores et al., 2014).
Under these conditions, efficient water use improves economic performance through reduced water and energy consumption (Yacoubi et al., 2012; Samian et al., 2015), and minimizes negative environmental impact (Louis and Selker, 2000). The potential management tools to economize water use include the use of efficient irrigation and precision farming systems (Levy et al., 2013), although irrigation technology does not imply that high efficiencies are achieved if these systems they do not operate properly under the design assumptions (Tun et al., 2011), since insufficient or excessive applications of water cause losses and limit their efficiency (Florez et al., 2013). The self-propelled sprinkler irrigation machines have proven to be a worldwide success with respect to other irrigation systems (Ouazaa et al., 2015), their advantages include: 1) high potential for uniformity and application efficiency; 2) high degree of automation; and 3) ability to apply water and nutrients over a wide range of soils, crops and topographic conditions (Evans and King, 2012).
The great advantages of the central pivot as an irrigation system have aroused interest among agricultural producers, not only because of the lower investment cost per hectare irrigated (to a greater length of equipment), but also because of other characteristics such as their versatility to be used In different soil, climate and crop conditions, high degree of automation, the possibility of applying different loads of water according to the actual needs of the crop, injection of agrochemicals and the uniformity of application of the water, which will be high when the design of the equipment in the factory, field assembly and operation, are adjusted to the characteristics of the exploitation and water demand of the crop according to its stage of development (Montero et al., 2013).
The most common performance indices are the uniformity coefficient (CU) and the uniformity of distribution (UD) (Baum et al., 2005; Marjang et al., 2012; Zhang and Merkley, 2012), the Heermann and Hein uniformity coefficient is a modification of the coefficient of Christansen, where each rain gauge represents a circular crown of increasing area as it moves away from the pivot point; is indicative of the joint performance of issuers in conditions of field, environment and pressure, where a value less than 80% is characterized as bad, between 80 and 84% regular, 85 and 90% good, and, on this value, very good (Cezar et al., 2008). Most spray irrigation systems require a minimum water distribution uniformity of 80% (Tun et al., 2011), it must be considered that low values of uniformity of distribution may be due to incorrect designs of the systems of irrigation, which limits its performance and optimum functioning (Buendía et al., 2004).
The objective of the study was to compare irrigation quality based on performance indicators: Heermann and Hein (CUh) uniformity coefficient, distribution uniformity (UD), adequately irrigated area (ARA) and application efficiency (Ea) Obtained from the analysis of the total rainfall and by “sections” of the central pivot and to determine the relation between them.
Materials and methods
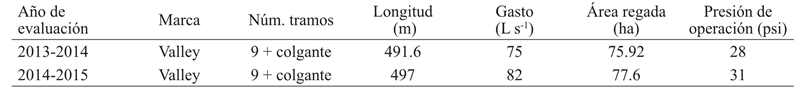
Location. The work was carried out in Irrigation District No. 075 “Río Fuerte”, in the north of Sinaloa, Mexico, in two central pivot machines, composed of 9 sections and a pendant (Table 1), in plots of commercial potato production, operated according to the use and custom of the producers of the region, with sources of surface water supply, during the agricultural cycles 2013-2014 and 2014-2015.
Weather. The climate variables were measured at an automated meteorological station located 100 m from the test plots, with readings every five minutes during the tests and until the collector volumes were finished measuring. Evaluations were performed early in the morning in the absence of wind or at speeds below 2 m s-1, when speeds were higher were discarded.
Evaluation of rainfall. Three pluviometric evaluations were performed in each central pivot machine, with three different irrigation sheets, determined by the producer: Lr1= 25.4 mm, Lr2= 12.7 mm and Lr3= 6.35 mm, during the cycle 2013-2014 and for Lr4= 12.63 Mm, Lr5= 8.21 mm and Lr6= 3.28 mm in the 2014-2015 cycle, according to the methodology of Merriam and Keller (1978) and ANSI/ASAE S436.1 (ANSI/ASAE, 2003). The plastic rain gauges with a diameter in the catchment area of 12.7 cm and a height of 18 cm were placed in a radial line with a separation of 3 m, using metallic supports to place them on the canopy of the crop, when foliage interfered with the uptake of irrigation water. The volumes were measured with 200 and 500 ml graduated test tubes as needed.
Indicators of performance. For each pluviometric evaluation, the uniformity coefficient of Heermann y Hein (CUh), distribution uniformity (UD), adequately irrigated area (ARA) and application efficiency (Ea) were determined as follows.
The coefficient of uniformity of Heermann and Hein (1968) was calculated with the following expression:
Where: n= number of collectors used in the analysis; i= number assigned to identify a collector (i= 1, 2, 3, 4 ... n); Ci= water sheet collected in the collector i (with i varying between 1 and n); Di= position of the collector i with respect to the pivot point (with i varying between 1 and n); Lmp= weighted average sheet of the irrigation sheets collected in the “n” rain gauges (mm) and calculates:
Uniformity of distribution (UD). According to Keller and Bliesner (1990) it is obtained from the following equation:
Where: Lmp 25% valores más bajos= are the media weighted 25% of the lowest values of the irrigation sheets collected.
Adequately irrigated area (ARA). The irrigation sheet is considered to be within the range of ± 15% of the weighted average sheet (Tarjuelo, 2005).
Efficiency of application of the central pivot or proportion of water reaching the ground. It is defined as the relationship between the average water sheets collected by the rain gauges between the average sheets discharged by the emitters, mathematically defined as:
Where: Ea= efficiency of application of the central pivot or proportion of water reaching the soil (fraction); Ln= average water sheet collected by the rain gauges (mm), and Lb= average sheet discharged by the emitters (mm).
Statistical analysis. The determination of performance indicators was performed considering the central pivot pluviometry as a whole; In addition to doing it individually. The statistical analysis was performed using the Statistical Analysis System (SAS Institute, Inc. Version 9.0), applying an analysis of variance and a Tukey test, with a level of significance α= 0.05 for the comparison of means of CUh values, ARA and Ea by sections, for each irrigation sheet; for the comparison between the mean values of the CUh, ARA and Ea data, obtained from the pluviometry by sections and the total rainfall, a student’s T test was performed with a significance level α= 0.05, while to determine the CUh-ARA, CUh-Ea, Ea-ARA, CUh-UD, Ea-UD and ARA-UD associations, a linear regression was performed.
Results and discussion
Analysis of the total rainfall of the irrigation system
Coefficient of uniformity of Heermann Hein. The information obtained from the rainfall analysis of the total precipitated leaves of the two irrigation systems by central pivot shows values greater than 85% in the CUh (Table 2) for Lr1, Lr2, Lr4, Lr5 and Lr6, which classified as a “good irrigation” according to Tarjuelo et al. (1999), while for Lr3 the value is 80.45%, which although considered inadequate for these irrigation systems is a value very close to what is classified as “good irrigation”.
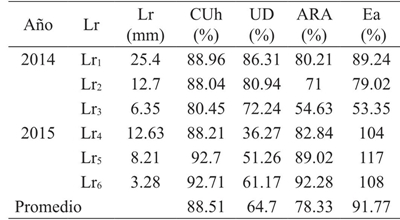
Uniformity of distribution. The values of UD (Table 2) were very variable, ranging from 36.27% in Lr4 to 86.31% in Lr1, being considered adequate for Lr1 and Lr2 (greater than 80%), but unsuitable for the rest (< 80%) According to Tun et al. (2011). It should be considered that the UD is obtained from 25% of the lowest values of the sheets captured in the rain gauges, which may be due to poor design, although it is usually associated with a lack of maintenance and inadequate operation of the system (nozzle wear, alteration of the hydraulic design, deterioration of pressure regulators, leaks in the hydraulic system, closure of emitters by system managers, etc), as indicated by Keller et al. (1981) that establish that UD values depend more on the management of the irrigation system.
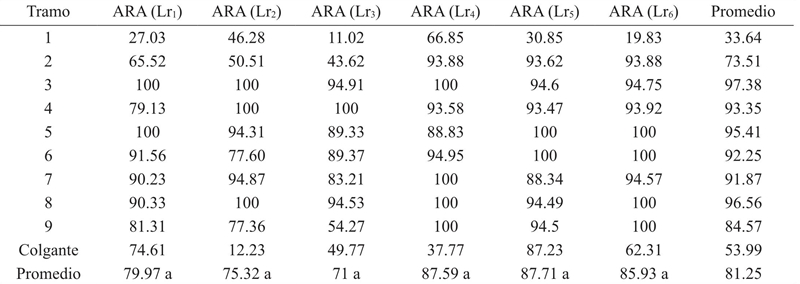
Properly irrigated area. With regard to ARA (Table 2), it is shown that for Lr1, Lr2, Lr4, Lr5 and Lr6 there is a “very well-watered” area, while for Lr3 (54.63%) it is “inadequately watered”, although the value is very close to 55%, which classifies it as irrigated according to Tarjuelo (2005) and Jimenez (2010; 2012). These results show a clear correspondence with the values obtained for the CUh.
Efficiency of application of the irrigation system. The values obtained from Ea are suitable for Lr1 and Lr2, but not for Lr3, since it is considered low for central pivot, nor for Lr4, Lr5 and Lr6, since it exceeds 100% which means that more water is applied than the one programmed. These values show a relationship with the values obtained for UD, having their best performance in Lr1 and Lr2, and in the rest are inadequate.
Average rainfall. When considering the average values of the performance indicators (CUh= 88.51%, UD= 64.7%, ARA= 78.33% and Ea= 91.77%), it should be concluded that the two pivot irrigation systems central provide a “high quality” irrigation and the area is “very well-watered”. The lowest values of CUh, ARA and Ea are found in Lr3, while the lowest values and the highest values of Ea, together with the lowest values of UD, are Lr3, Lr4, Lr5 and Lr6, which may be an indicator of failure in the design or operation and maintenance of the irrigation system since, although low, there is a relation in the association Ea-UD with R2= 0.3482.
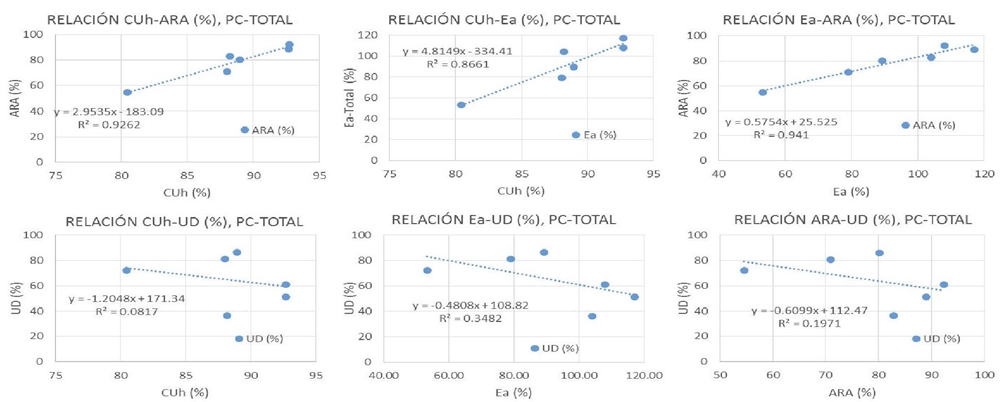
Associations between performance indicators. When analyzing the associations between performance indicators and total rainfall (Figure 1), there is a high relation between the associations CUh-ARA, CUh-Ea and Ea-ARA (R2= 0.9262, 0.8661 and 0.9041, respectively). A low Ea-UD ratio (R2= 0.3482), and very low for the CUh-UD and ARA-UD (R2= 0.0817 and 0.1971, respectively) associations.
Analysis of the pluviometry by sections of the irrigation system
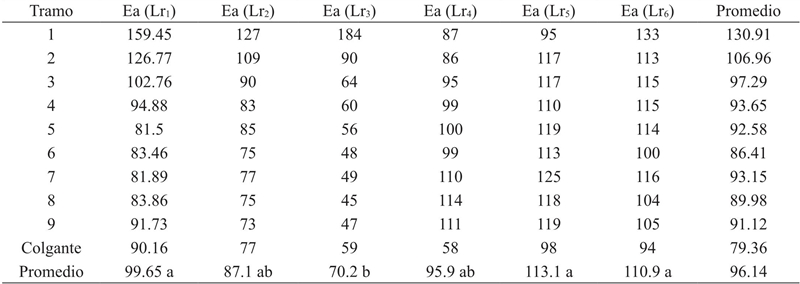
An analysis of variance and a Tukey test (α= 0.05) were performed for the values of CUh, ARA and Ea, obtained by irrigation and central pivot sections, finding that there is no significant statistical difference between irrigation sheets for (Table 3), or for ARA (Table 4), while for Ea (Table 5), there are no statistically significant differences between Lr1, Lr2, Lr4, Lr5 and Lr6, but with Lr3, neither Found statistically significant differences between Lr2, Lr3 and Lr4.
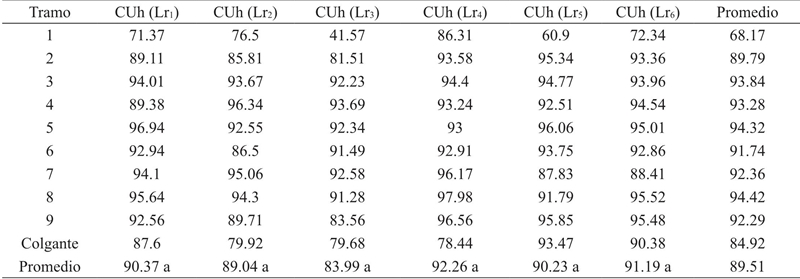
Coefficient of uniformity of Heermann Hein. For the CUh, lower values were found in section one and pendant (68.17 and 84.92% on average, respectively), while in the rest of the central pivot they presented values ranging from 89.79 to 94.42%, with an average value of 89.51%, throughout the system, which meant that the irrigation presents a very good uniformity considering that section one covers only 0.95% of the total irrigated area and the pendant 8.93%, but with a value close to 85% considered As “good” by Tarjuelo et al. (1999).
Properly irrigated area. For the ARA, the behavior is similar to that of the CUh, the lowest values were found in section one and pendant (33.64 and 53.99% on average, respectively), while in the rest of the central pivot are values between 73.51 and 97.38% with an average of 81.25%, for the whole system, which meant that the area was “very well-watered”, especially considering that the ARA value for the pendant is very close to 55% suggested by Tarjuelo (2005) to consider a “well-watered” area, coinciding with Alfonso (2005) who carried out similar studies finding that all sections in central pivot machines received water amounts comprised in 85% and 115% of the weighted average sheet.
Efficiency of application of the irrigation system. According to the Ea values found, section one is applying a larger than planned irrigation sheet (30.91%), although it only covers 0.95% of the irrigated area, while the two section covers 2.93% of the area, but with an over watering of only 6.96% of the programmed blade, the rest of the central pivot presented values between 79.36 and 97.29%, with an average of 90.44% for the rest of the system, which is a higher value than expected in these systems, which is a higher value than expected in these irrigation systems especially considering that the smallest value was 79.36% (in the pendant) which is very close to the 80% usually used for the design of these irrigation systems.
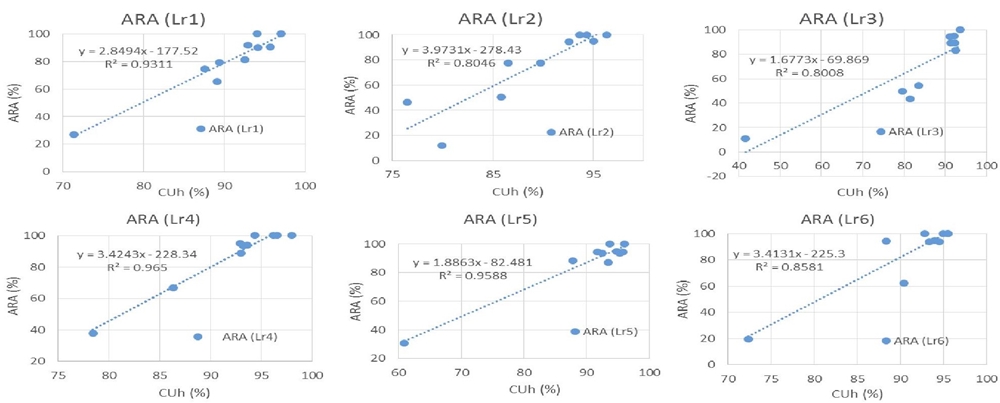
Associations between performance indicators. When analyzing the CUh-ARA associations, in sections (Figure 2), R2 values between 0.8012 and 0.965 were presented, with a general equation: ARA= 2.2764 CUh -122.51 and an R2= 0.7648, indicating a high relation between values of CUh and ARA.
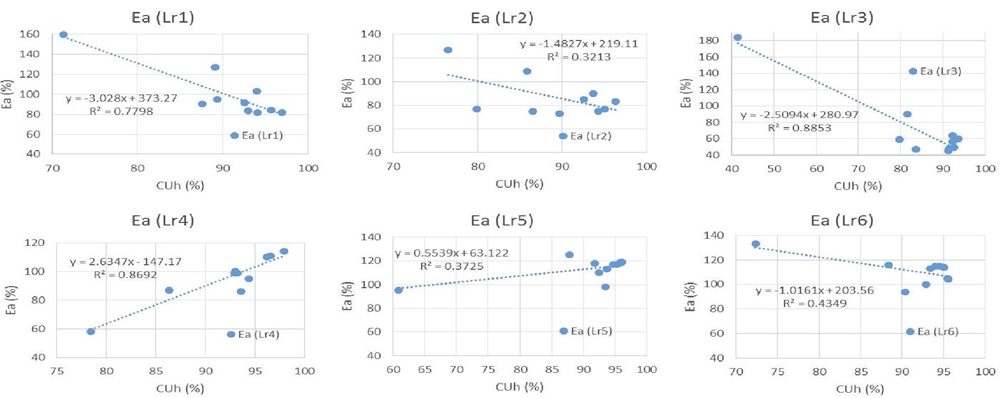
For the case of the association CUh-Ea (Figure 3), the result was different, values of R2 were between 0.3213 and 0.8848, with negative slopes in Lr1, Lr2, Lr3 and Lr6 and positive in Lr4, Lr5 with values of R2 of 0.3725 and 0.8692, respectively, with a general equation: Ea= -0.9261 CUh + 179.04 and an R2= 0.1099. For the Ea-ARA relation, a general equation was found: ARA= -0.1737 Ea + 97.955 and an R2= 0.0348.
To perform a comparison between the results obtained from the performance indicators CUh, ARA and Ea, from the analysis of total rainfall and by sections (Table 6), a student’s T test was used with a significance level α= 0.05, finding that there is no statistically significant difference between means.

Conclusions
No statistically significant differences were found between the performance indicators obtained from the analysis of total rainfall and the average of the analysis by sections. The pluviometric analysis by sections shows the variations of these indicators along the irrigation system by central pivot and allows to detect the performance for each individual section.
In the total rainfall analysis, a high association between the CUh, ARA and Ea indicators was found, while the associations with UD were very low with Ea and almost nil with CUh and ARA. When performing the pluviometric analysis by sections, only a high relation was found for the association CUh-ARA.
It is advisable to perform the pluviometric analysis by sections, allows us to determine the quality of the irrigation with the parameters CUh and ARA, while the determinations of UD and Ea contribute to detect the sections with the lowest performance and its possible causes.
Literatura citada
Alfonso, M. L. 2005. Evaluación de máquinas de riego en empresas de cultivos varios en la provincia de Matanzas. Congreso internacional de riego y drenaje. La Habana, Cuba. 417-427 pp. [ Links ]
ANSI (American National Standards Institute). ASAE (American society of agricultural engineers), 2003. (ANSI/ASAE) standards S436.1. Test for determining the uniformity of water distribution of center pivot and lateral move irrigation machines equipped with spray or sprinkler nozzles. In ASAE Standards. St. Joseph, MI. USA. Asae standar. 931-938 pp. [ Links ]
Baum, M. C.; Dukes, P. E. M. D. and Miller, G. L. 2005. Analysis of residential irrigation distribution uniformity. J. Irrig. Drainage Eng. 131(4):336-341. [ Links ]
Benjamín, J. G.; Havis, H. R.; Ahuja, L. R. and Alonso, C. V. 1994. Leaching and water flow patterns in every-furrow and alternate-furrow irrigation. Soil Sci. Soc. Am. J. 58(5):1511-1517. [ Links ]
Buendía, J. C. E.; Palacios, V. E.; Chávez, M. J. y Rojas, M. B. 2004. Impacto del funcionamiento de los sistemas de riego presurizados en la productividad de ocho cultivos, en Guanajuato, México. Agrociencia. 34(5):477-486. [ Links ]
Castro, P. M.; Águila, M. F. M.; Quevedo, N. A.; Kleisinger, S.; Tijerina, C. L. y Mejía, S. E. 2008. Sistemas de riego automatizado en tiempo real con balance hídrico, medición de humedad del suelo y lisímetro. Agric. Téc. Méx. 34(4):459-470. [ Links ]
Cisneros, Z. E.; González, A. A.; García, L. A.; Placeres, M. Z. y Jiménez, E. E. 2014. Evaluación y propuesta de medidas en diferentes técnicas de riego por aspersión para un uso eficiente del agua. Ing. Agríc. 4(1):22-28. [ Links ]
CONAGUA (Comisión Nacional del Agua). 2009. Estadísticas agrícolas de los Distritos de Riego, “Año agrícola 2007-2008”. México, D. F. 34 p. [ Links ]
Evans, R. G. and King, B. A. 2012. Site-specific sprinkler irrigation in water limited future. Trans. ASABE 55(2):493-504. [ Links ]
FAO (Food and Agricultural Organization). 2011. The state of the world’s land and water resources for food and agricultural (SOLAW) managing systems at risk. Food an agricultural Organization of the United Nations, Roma and Earthscan, London. 294 p. [ Links ]
Flores, G. H.; Sifuentes, I. E.; Flores, M. H.; Ojeda, B. W. y Ramos, G. C. R. 2014. Técnicas de conservación del agua en riego por gravedad a nivel parcelario. Rev. Mex. Cienc. Agríc. 5(2):241-252. [ Links ]
Flórez, T. N.; Zution, G. I.; Rodrigues, C. D.; Agnellos, B. E. A.; Ponciano, de D. F.; Diego, R. M. y Eiji, M. E. 2013. Eficiencia de aplicación de agua en la superficie y en el perfil del suelo en un sistema de riego por aspersión. Agrociencia. 47:107-119. [ Links ]
González, C. J. M.; Muñoz, H. B.; Acosta, H. R. y Mailhol, J. C. 2006. Modelo de la onda cinemática adaptado al riego por surcos cerrados. Agrociencia. 40(6):731-740. [ Links ]
Heermann, D. F. and Hein, P. R. 1968. Performance characteristics of self-propelled center-pivot sprinkler irrigation system. Trans. ASAE 11(1):11-15. [ Links ]
INIFAP. 2010. Reporte anual 2009. Ciencia y tecnología para el campo mexicana. México, D. F.: Gobierno de los Estados Unidos Mexicanos. Publicación Núm. 5. 76 p. [ Links ]
Jiménez, E. E. R.; Domínguez, G. M.; Pérez, H. R.; Montero, S. J. L. y Cun, G. R. 2010. Estudio de la uniformidad de riego, en una máquina de pivote central. Rev. Cienc. Téc. Agrop. 19(1):73-78. [ Links ]
Keller, J.; Corey, W. R. and Vavra, M. E. 1981. Evaluation of irrigation systems. Irrigation challenges on the 80’s. St. Joseph, Michigan, USA. ASAE 95-105. [ Links ]
Keller, J. and Bliesner, R. D. 1990. Sprinkle and tickle irrigation. A VI book. Van Nostrand Reinhold. New York. 652 p. [ Links ]
Levy, A.; Coleman, W. K. and Veilleux, R. E. 2013. Adaptation of potato to water shortage: irrigation management and enhancement of tolerance to drought and salinity. Am. J. Potato Res. (90):186-206. [ Links ]
Louis M. and, Selker J. 2000. Sprinkler head maintenance effects on water application uniformity. J. Irrig. Drainage Eng. ASCE. 126(3):142-148. [ Links ]
Merriam, J. L. and Keller, J. 1978. Farm irrigation system evaluation: a guide for management. Utah State University. Logan UT. 87 p. [ Links ]
Montero, J.; Martínez, A.; Valiente, M.; Moreno, M. A. and Tarjuelo, J. M. 2013. Analysis of water application cost a center pivot system for irrigation of crops in Spain. Irrig. Sci. 31:507-521. [ Links ]
Ouazaa, S.; Latorre, B.; Burguete, J.; Serreta, A.; Playán, E.; Salvador, R.; Paniagua, P. and Zapata, N. 2015. Effect of the start-stop cycle of center-pivot towers on irrigation performance: experiments and simulations. Agric. Water Manag. 147:163-174 [ Links ]
Samian M.; Mahdei, K. N.; Saadi H. and Movahedi R. 2015. Identifying factors affecting optimal management of agricultural water. J. Saudi Soc. Agric. Sci. 14:11-18. [ Links ]
Tarjuelo, M. B. J. M. 2005. El riego por aspersión y su tecnología. Edición Mundi Prensa, Madrid, España. 3ra Edición. 569 p. [ Links ]
Tarjuelo, J. M.; Montero, J.; Honrubia, F. T.; Ortiz, J. J. and Ortega, J. F. 1999. Analysis of uniformity of sprinkle irrigation in a semi-arid area. Agric. Water Manag. 40:315-331. [ Links ]
Tun, D. J. de la C.; Ramírez, J. G.; Sánchez, C. I.; Lomas, B. T. L. y Cano, G. A. de J. 2011. Diagnóstico y evaluación de sistemas de riego en el Distrito 048 Ticul, Yucatán. Rev. Mex. Cienc. Agríc. Pub. Esp. 1:5-18. [ Links ]
Yacoubi S.; Zayani K.; Slatni A. and Playán, E. 2012. Assessing sprinkler irrigation performance using field evaluations at the medjerda lower valley of tunisia. Engineering. 4:682-691. [ Links ]
Zhang, L. and Merkley, G. P. 2012. Relationships between common irrigation application uniformity indicators. Irrig. Sci. 30:83-88. [ Links ]
Received: February 2017; Accepted: March 2017
 Este es un artículo publicado en acceso abierto bajo una licencia Creative Commons
