


Servicios Personalizados
Revista
Articulo
 texto en
  Inglés (pdf)
 Artículo en XML
 Referencias del artículo
 Enviar artículo por email
Indicadores
-
 Citado por SciELO
 -
 Accesos
Links relacionados
-
 Similares en
SciELO
Similares en
SciELO
Compartir

 Permalink
Revista mexicana de ciencias agrícolas
versión impresa ISSN 2007-0934
Rev. Mex. Cienc. Agríc vol.7 no.3 Texcoco abr./may. 2016
Articles
Properties of soils coffee in the Biosphere Reserve El Triunfo, Chiapas, Mexico
1 Campo Experimental Centro de Chiapas-INIFAP. Carretera Ocozocoautla-Cintalapa, km 3, A. P. Núm. 1, C. P. 29140. Ocozocoautla, Chiapas. Tel: 01 96 86 88 29 11. (castro.itzel@inifap.gob.mx; salinas.eileen@inifap.gob.mx; reynoso.roberto@inifap.gob.mx; lopez.jaime@inifap.gob.mx).
The low productivity of 12 000 hectares of coffee grown in the Biosphere Reserve El Triunfo (REBITRI), besides affecting the income of families represents the main threat of change in land use, loss of biodiversity and services ecosystem in the protected area by encouraging the opening of new areas of cultivation to compensate inefficiency. The damage caused by the recent rust disease has encouraged farmers to improve their farming practices, especially fertilization. The properties of soils in order to initiate a fertilization program that contributes to sustainably improve productivity levels were analyzed coffee. The results indicate a generalized acidity caused mainly by the H + in the soil solution, with no H and Al ions in colloids. The high content of organic matter they assume that acidic conditions are affecting their humification and mineralization. The CIC dynamics in soils is influenced by pH and organic matter content. Over 90% of the plots have high levels of K, Ca and Mg and content low P and B in 50 and 84%, in the latter could have response to the application of these nutrients. The Ca excess could be limiting the absorption of K and Mg and the Mn excess in the soil they could be associated with physiological problems to absorb and store.
Keywords: coffee; ecosystem services; fertilization; protected area
La baja productividad de 12 000 ha de café que se cultivan dentro de la Reserva de la Biósfera El Triunfo (REBITRI), además de afectar el ingreso de las familias, representa la principal amenaza de cambio de uso de suelo, pérdida de biodiversidad y servicios ecosistémicos en el área natural protegida, al incentivar la apertura de nuevas áreas de cultivo para compensar la ineficiencia. El daño causado por la reciente enfermedad de la roya ha incentivado a los productores a mejorar sus prácticas de cultivo, especialmente la fertilización. Se analizaron las propiedades de los suelos con el propósito de iniciar un programa de fertilización que coadyuve a mejorar de manera sustentable los niveles de productividad del café. Los resultados indican una acidez generalizada ocasionada principalmente por el H+ en la solución del suelo, con ausencia de iones de H y Al en los coloides. Los altos contenidos de materia orgánica hacen suponer que las condiciones de acidez están afectando su humificación y mineralización. La dinámica de la CIC en los suelos está influenciada por el pH y el contenido de Materia Orgánica. Más de 90% de las parcelas presentan niveles altos de K, Ca y Mg y bajo contenido de P y B en el 50 y 84%, en estas últimas podría haber respuesta a la aplicación de estos nutrientes. Los excesos de Ca podrían estar limitando la absorción de K y Mg y los excesos de Mn en el suelo podrían estar asociados a problemas fisiológicos para absorberlo y almacenarlo.
Palabras claves: área natural protegida; café; fertilización; servicios ecosistémicos
Introduction
Coffee production in Chiapas, is one of the most important productive activities in economic, social, cultural and environmental terms. Involved in it 83 of the 118 municipalities of the state with about 186 000 farmers in an area of 260 129.43 ha and a production of 402 t of coffee cherry 099.78 (SAGARPA, 2014). With approximately 12,000 ha is the main economic activity within the polygon of the Biosphere Reserve El Triunfo (REBITRI) located in the Sierra Madre de Chiapas, particularly in the municipalities of Angel Albino Corzo, Montecristo de Guerrero and La Concordia, where it represents the main source of income of the population and also the main threat of loss of biodiversity and ecosystem services associated with this protected area (Lopez et al., 2011).
The Coffee in the REBITRI is grown in small areas (80% of producers have surface under 2 ha) with slopes greater than 30 degrees. Plantations are characterized by their advanced age, susceptible to rust disease varieties, few management practices (only weed control, pruning and desombre) and low yields and variable with an average of 12 Qq/ha (±7.7) and totally dependent on natural fertility complemented by the humification and mineralization of organic matter of litter from coffee plants and shade trees. The 90% of producers have no culture of applying nutrients to the soil and fertilize the few who lack technical support to determine the nutrients, quantities, times and sources that should apply. Severe damage of rust in the last 2 years, with losses of up to 70% of production, have encouraged producers to improve their management practices, especially fertilization (Castiaux et al., 2014).
The aim of this study was to analyze the main properties of the coffee soils as a first input to design a nutrition program that contributes to improve sustainable manner levels of productivity and profitability in the area, as part of the strategy of the coffee sector for adaptation, mitigation and reduced vulnerability to climate change of the Sierra Madre de Chiapas, proposed by the alliance between institutions, ONG’s and producers (Conservation International, 2011).
Materials and methods
Characteristics of the study area
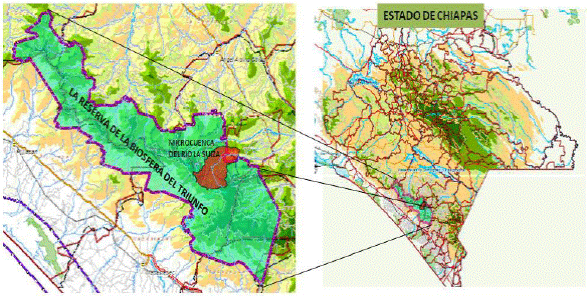
The analyzed coffee soils are found within the watershed The Switzerland located in the municipality of Montecristo de Guerrero (Figure 1), with a total area of 6 437.1 ha, of which 82% is within the REBITRI (Lopez et al., 2011). According to Palacios (2012), 55.7% of the area of the watershed is occupied with forest, 37.2% (2 391 ha) and 3.7% coffee paddocks.
According to soil information Series II, 1: 250 000 (INEGI, 2006), 95% of the area of the watershed classified as Leptosols the mollic type (product of weathered calcareous material) soils, characterized dominated by very on continuous and extremely shallow gravelly and stony rock with less than 20% (by volume) fine earth and high susceptibility to erosion (FAO, 2014).
Sampling
The soil to a depth of 0-30 cm layer in which is 86% of the absorbing roots of the culture was analyzed (Carvajal et al., 1969). In each site, the physical properties were measured in five repetitions and for the case of the chemical properties of a sample of soil from the mixture of five subsamples was obtained.
Analytical methods
In 49 farms distributed throughout the watershed were determined according to the NOM-021-SEMARNAT 2000 (DOF, 2002), the following properties: texture boyoucos (% sand, silt and clay), pH in water (1:2), organic matter (%), total carbon (%), P Bray (ppm), K, Ca, Na, Mg and exchangeable acidity (KCl 1N) in cmoles +Kg-1 and micronutrients B, Zn, Mn, Cu and Fe in ppm by DTPA.
Results and discussion
In Table 1, the means and extreme values of the properties studied are presented. In examining the coefficients of variation (CV) high variability in all soil properties with extreme cases such as exchangeable acidity (%) saturation of Al, Na and Zn is observed with values of 215, 251, 170 and 120% respectively. The pH and particle size fractions of sand, silt and clay are the most homogeneous characteristics within the watershed with a variation coefficient of 7.5, 26, 21 and 27% respectively. The wide variability observed in soil properties is the product of the interaction between the natural circumstances of the watershed (high rainfall, rugged terrain, steep slopes and parent material) and management practices cultivation of coffee (application organic matter, fertilization practices and implementing erosion control).
Table 1 Statistical soil chemical properties of coffee farmers in the watershed La Suiza.
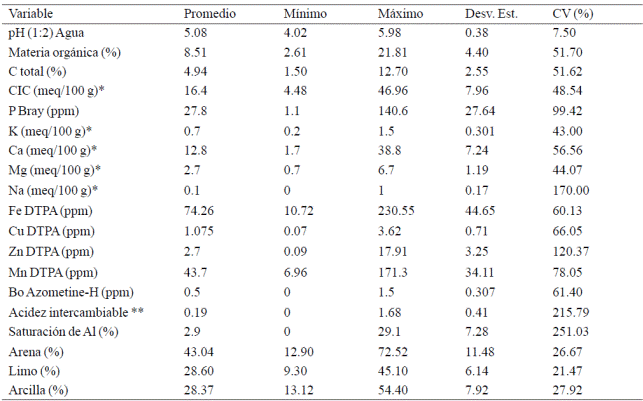
(*)= NH4OAc 1 N pH 7; (cmoles+Kg-1) (**)= KCl 1N (meq/100 g).
Soil acidity
Soils are classified as moderately acid (Table 1) by presenting an average pH 5.08 (± 0.38). The pH is probably the most important soil chemical characteristic that influences almost every other aspect of it (Bloom, 2000; Benzing, 2001). The saturation value as a measure of acidity percentage of cation exchange complex is occupied by aluminum and hydrogen is the best criterion for diagnosing problems acidity (Molina, 1998). Although each culture has its degree of tolerance for acidity, in general terms it may indicate that almost any crop supports more than 60% saturation of acidity and the desirable value for most plants is between 10 and 25%.
In Figure 2, it is observed that the soils studied show a negative correlation between pH and Al saturation because as it increases the first, the second decreases. Based on the proportion of shared variance between two variables a 50.21% Al saturation is explained by the pH levels in the soil.
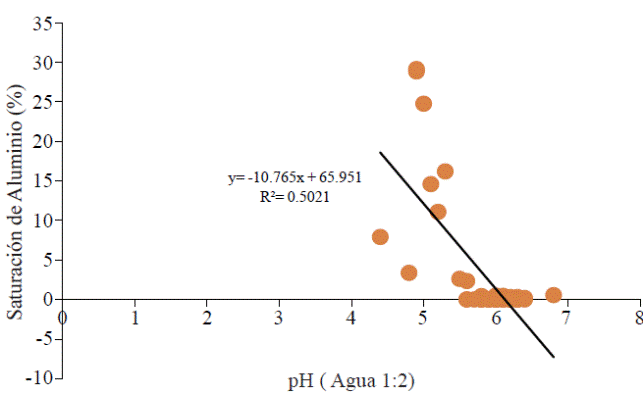
It is common that when the pH is greater than 5.5 the toxicity problem is eliminated because it Al is precipitated as insoluble hydroxides (Agro, 2012). This remark coincides with the results of study since Al saturation decreased when pH values are greater than 5.5 and instead increased to 29.9% with lower pH values.
Because only 6 sites had levels of Al saturation > 10%, and only two of them had levels above 25% (28.8 and 29.9) noted by Bertsch (1998), as toxic for growing coffee, it follows that 96% (n= 47) of the sampled plots no problems of toxicity Al and 61% (n= 30) of them have levels zero. The limited presence of Al indicates that the main cause of low pH values is the H + exchange and in the soil solution product of the decomposition of organic matter, which is related to the high content of calcium found.
Valencia (1998) notes that if the source of acidity is only the H + in the soil solution, coffee plants can normally grow at relatively low pH between 3-5-4.0. However, although the H + ions are only toxic to plants in extremely high concentrations, it must bear in mind the negative effect due to the influence of acid pH in the availability of mineral nutrients and microbial activity in the soil (Anzorena, 1995).
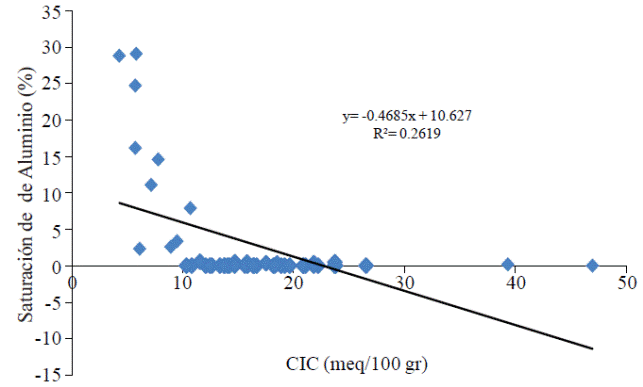
Another factor that influences the saturation (%) in the soil is the Cation Exchange Capacity or CIC (Cochrane et al., 1980), Figure 3 shows that in the soils studied Al saturation begins its increase when the CIC falls below 10 meq/100 g soil, however, only two plots have levels of Al saturation above 25% which is very likely to be Al toxicity to roots coffee plants as a result of that Al is the predominant cation exchange complex.
Organic matter and carbon
The average organic matter content is 8.51% (±, 4.40) with a range between 2.61 and 21.81% (Table 1) showing a wide variability between farms (CV= 51.7%). A third of the plots (n= 16) have low and very low content with values less than or equal values of 6% organic matter; 48% (n= 24) present media content between 6.1 and 10.9% and only 18.36% (n= 9) have high content and high with values greater than 11%. It is very likely that in the plots with medium and high organic matter content acidity conditions are holding back the development of bacteria and folding down the mineralization process (Noriega et al., 2014).
According to Valencia (1998) a response to nitrogen application is expected as 81% (n= 40) of the coffee plots are located in the minimum range with a lower content of 11.4% organic matter. The average carbon content (Table 1) is 4.94% (± 2.55) with a range between 1.5 and 12.7% carbon.
They possess organic matter soils comes from the litter produced by coffee plants and shade trees. Farfan and Urrego (2007), in a study conducted at the experimental station Paraguaicito, Colombia, estimated a contribution of 1 kg plant-1 of coffee and 1.5 kg tree-1 shade. Avila and Zamora (2010), found in coffee plantations deciduous forest of Veracruz, Mexico that total litter production was 2 626.5 kg ha-1 yr-1, higher than at 49 and 45% to that in the coffee plantations jungle sub perennifolia medium and low high evergreen forest.
The cation exchange capacity (CIC)
The CIC is the total number of exchangeable cations that can be retained by a soil depending on the magnitude of its negative charges (Chavez, 2012). It is one of the most important parameters of soil fertility because of its role as a store of K, Mg and Ca readily available, but protected from the leaching process (Benzing, 2001; Arcila and Farfan, 2010). The higher the CIC, potentially more cations and exchange may retain soil.
On average soils have a CEC of 16.4 (± 7.96) meq/100 g with a minimum value of 3.5 and a maximum of 47 with a wide variability evidenced by C.V. 48.5% (Table 1). The 47% of the analyzed plots (n= 49) have low levels of CIC with Cmoles' below 15 kg-1 values, another 47% have average levels between 15-25 and only three plots are above 25 Cmoles' kg-1 corresponding to newly built properties to productive activity.
In the Figure 4 shows the influence of soil pH on the CIC of the soils studied. Observed that 32% of the behavior of the CIC is explained by the level of acidity of the soil, the lowest values of CIC occur when the pH is below 5.5 and the highest when the pH has values between 6 and 7.
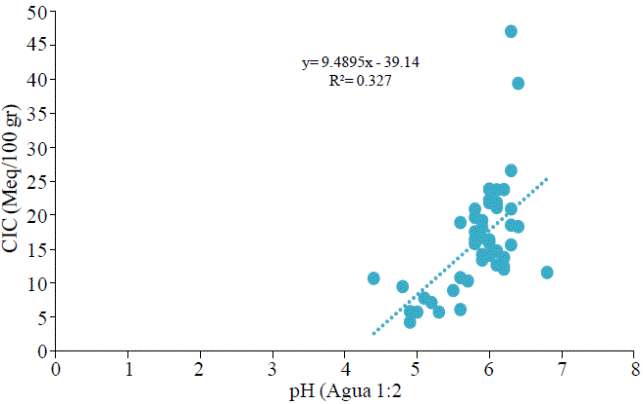
This dependence on the CIC with the acidity is because with increasing soil pH new negative charges are generated in the exchange complex and is reported by Anzorena (1995) and Benzing (2001), as a variable CIC, which is more common in the CIC from organic matter, which clays. Foth and Ellis (1996) indicate that in mineral soils with low organic matter content, the influence of pH on the CIC is minimal. This variability can be deduced that a large part of the CIC in soils of the watershed comes from humus organic matter.
The 14.5% of the behavior of the CIC is explained by the level of organic matter in the soil, in Figure 5, it is observed that in some soils lower CIC values occur when this presents values below 10%; however, there are also plots with low CIC with very high values, which could be influenced by the high level of acidity which limits the rate of humification and mineralization of organic matter.

For its part the clay has little influence (r2= 0.0457) on the behavior of the CIC, which may be due to the sandy loam soil texture represented by 43% (± 11.48) sand, 28.8% (± 7.93) clay and 28.2 (± 6.14) of silt.
Based on the above it follows that the dynamics of the CIC in coffee soils of the watershed La Suiza, is influenced by the pH and organic matter content.
Phosphorus
This nutrient has a great variability between plots with C. V. 110% (Table 1). On average the content is 25 ppm (± 27.5) with a minimum value of zero and a maximum of 140.6. There are five plots where the content is zero and two with a very high content with 141.89 and 83 ppm. Almost half (49%) of the plots have lower content of 15 ppm, which could be a response to the application of phosphate fertilizer (International Plant Nutrition Institute, 2014). A moderate positive influence of the CIC (r2= 0.3921) and Ca (r2= 0.433) on the content of P in soil was observed. P is likely to react with the calcium this form calcium phosphate salt is a completely insoluble and very stable which does not allow P to be assimilated by plants (Sephu, 2013).
Basic cations (K, Ca, Mg, Na)
The base saturation has little variability between plots with C.V. 7.5% (Table 1). On average has a value of 97% (± 7.3) and 88% of the plots are located in the range of 90-100%. This high saturation of the CIC bases, highlights the absence of H and Al ions in colloids (FAO, 2014) and more presence of metal cations. In the Figure 6 shows the contents of K, Ca, Mg and Na in soil and shows that regardless of the total of exchangeable cations always predominates Ca between the four cations (Figure 6), which is related to the geology of soils in the watershed.

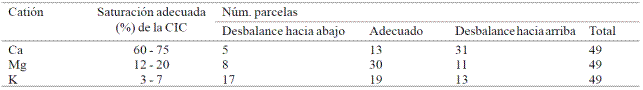
Table 2 shows the criteria for adequate saturation of the CIC by K, Ca and Mg proposed by Valenca (1998), highlights the imbalance up having the Ca in 63.2% of the plots with a higher percentage of saturation to 75 %. It also stands out that 35% of the plots have an imbalance down the saturation percentage K.
The 92% of the plots have adequate levels of K with values above 0.3 meq/100 g, including one could say that some plots have excess conditions. OIRSA (2001) points out that excess of this element causes increased fruit drop (which ferment on the ground hurting quality) and can also induce Mg deficiency and to a lesser degree of Ca, although in this case observed by correlations a positive relationship between K and Mg (r= 0.4382) and between K and Ca (r= 0.2355).
With respect to calcium, 67% of the plots with high content with values above 10 meq/100 g soil, 18% is located with an average content and only 14% in classes low and very low. The excess of this element is antagonistic with the K, Mg and Na (Valencia, 1998). According to the International Plant Nutrition Institute (2014), generally 100% of the plots do not show Ca deficiency because its content is greater than 0.5 meq/100 g of Ca, considered critical level, in fact the minimum value found is 1.7 is 3.4 times greater than this critical value. In particular for the cultivation of coffee, according to the criteria proposed by Valencia (1998), 90% of the plots have no problems introducing Ca deficiency values well above the critical level of 1.6 meq/100 g.
According to the International Plant Nutrition Institute (2014), 100% of the plots have no Mg deficiency because its content is greater than 0.2 meq/100 g of Mg considered critical level fact Pussycat found value of 0.7 is 3.5 times greater than this critical value. By this means Bertsch (1998), 98% (n= 48) of the parcels are within the range of 1-10 meq/100 g considered ideal. According to NOM-021- SEMARNAT-2000 (DOF, 2000) and Valencia (1998), 90% of the plots have no Mg deficiency problems. Comparing the different classifications proposed for Mg, it follows that there is an adequate and excess in soils.
The cationic relationships are other criteria support the interpretation of soil analysis, particularly between bases (Chavez, 2012). Referencing the general critical values suggested by Bertsch (1998), it was found that more than one third of the plots (39%) show a positive imbalance in the Ca/Mg and Ca/K ratio, indicating an excess content Ca which could induce deficiencies of Mg and K. 26% of the plots have a negative imbalance in the Mg/K ratio indicating an excess of K that could induce Mg deficiency. As for the ratio Ca + Mg/K a 22.4% of the plots have negative imbalance where the K content is higher and the lower Ca. According to these criteria follows that the high values of Ca could be inducing deficiencies of Mg and K in coffee plants, in cases where the Ca/Mg and Ca/K ratio present a positive imbalance.
Micronutrients (B, Cu, Fe, Mn and Zn)
Of all the micronutrients analyzed boron is the most deficient in 84% of the plots of the watershed The Swiss, followed to a lesser extent by zinc in 16% of the plots element. Valencia (1998), indicates that boron (as Ca) is related to the absorption of macro- and micronutrients (P, Mg and Ca), root growth (associated with calcium), growth, number of side branches , number and differentiation of flower buds, pollen germination and tube growth of pollinators and fruit growth. Excess manganese in soils with an average content of 43.7 ppm (± 34.11) well above the critical level of 1 ppm, may be related to low physiological ability of plants to absorb and store (Rodriguez and Morales, 2005).
Conclusions
Soils have generalized acidity caused mainly by the H + in the soil solution. High base saturation indicates no H and Al ions in colloids and higher presence of metal cations. The values of organic matter indicate that although in the watershed there are appropriate conditions of temperature and precipitation, acid pH is affecting your humification and mineralization, due to limited bacterial action. The CIC dynamics in soils is influenced by pH and organic matter content. Most soils have high levels of K, Ca and Mg. Low P and B were detected in 50 and 84% respectively of the soil. As cationic excess Ca ratios, may be limiting the absorption of K and Mg and excess Mn in the soil could be associated to physiological problems to absorb and store.
Literatura citada
Anzorena, M. N. 1995. El suelo en la agricultura y el medio ambiente. Fertilidad del suelo: acidez y complejo de cambio. Revista Sustrai. 36(1):40-44. [ Links ]
Arcila, P. J. y Farfán, V. F. 2010. Capítulo nueve: Consideraciones sobre la nutrición mineral y orgánica en la producción de la finca. In: sistema de producción de café en Colombia. Ospina, O. H. F. y Marin, L. S. M. (Eds.). FNC-Cenicafé. Primera edición. Colombia. 202-232 pp. [ Links ]
Benzing, A. 2001. Materia orgánica-fósforo. In: agricultura orgánica. Alemania: Neckar-Verlag. 56:166-193. [ Links ]
Bertsch, F. 1998. Potasio, calcio y magnesio en el sistema suelo-café. Curso regional sobre nutrición mineral del café. San José, Costa Rica. IICA-PROMECAFE. San José, Costa Rica. 83-88 pp. [ Links ]
Bloom, P. R. 2000. Soil pH and pH buffering. In: handbook of soil sciencie. Ming, H. P.; Li, Y. and Summer, M. E. (Eds.). CRC Press. Boca Raton, FL, USA. 333-352 pp. [ Links ]
Carvajal, J. F.; Acevedo, A. and López, C. A. 1969. Nutrient uptake by the coffee tree during a yearly cicle. Turrialba. 19(1):13-20. [ Links ]
Castiaux M., Crossman K., Jurjonas M., Mondragón R. L. 2014. A participatory Diagnostic for Coffe Production Planning in the La Suiza Micro-Wateershed of Chiapas, México. Tesis de Magister Scientiae. Colorado State University y Colegio de la Frontera Sur. 159 p. [ Links ]
Chávez, S. M. 2012. Relaciones catiónicas y su importancia para la agricultura. Rev. Ventana Lechera. 18(6):11-20. [ Links ]
Cochrane, T.; Salinas, J. and Sánchez, P. 1980. An equation for liming acid mineral soils to compesate crops aluminium tolerance. Tropical Agric. 57(2):133-140. [ Links ]
Conservación Internacional. 2011. Estrategia del sector cafetalero para la adaptación, mitigación y reducción de la vulnerabilidad ante el cambio climático de la Sierra Madre de Chiapas. Informe de Resultados de Foros Regionales de Consulta. 80 p. [ Links ]
DOF. 2002. Interpretación de Resultados de Materia Orgánica. Norma Oficial Mexicana NOM-021-SEMARNAT-2000 que establece las especificaciones de fertilidad, salinidad y clasificación de suelos, estudio, muestreos y análisis. Diario Oficial de la Federación del día martes 31 de diciembre de 2002. México. 85 p. Consultado el 22 de agosto de 2015 en: Consultado el 22 de agosto de 2015 en: http://biblioteca.semarnat.gob.mx/janium/Documentos/Ciga/libros2009/DO2280n.pdf . [ Links ]
FAO. 2014. Propiedades del suelo. Propiedades químicas. En portal de suelos. http://www.fao.org/soils-portal/levantamiento-de-suelos/propiedades-del-suelo/propiedades-quimicas/es/. [ Links ]
Farfán, V. F. y Urrego, J. B. 2007. Descomposición de la hojarasca y liberación de nutrientes de Coffea arabica, Cordia alliodora, Pinus oocarpa y Eucalyptus grandis, en sistemas agroforestales con café. Centro Nacional de Investigaciones de Café. 58(1):20-39. [ Links ]
Foth, D. N. and Ellis, B. G. 1996. Soil fertility. CRC Press LLC. Second edition. Boca Raton, FL, USA. 282 p. [ Links ]
INEGI. 2006. Edafología; conjunto de datos vectorial edafológico escala 1:2500 serie II. http://www.inegi.org.mx/geo/contenidos/ recnat/edafologia/vectorial_serieii.aspx. [ Links ]
International Plant Nutrition Institute. 2014. Características del suelo y sus Interpretaciones. http://www.ipni.net/ppiweb/Itamn.nsf/$webindex/article=69FC4C5285256E1B001455BC650 0B0. Instituto Internacional de Nutrición de las Plantas. [ Links ]
López, B. W.; Salinas, C. E. y Santos, R. R. 2011. Conectividad hídrica entre municipios, cuencas y Reserva de la Biósfera El Triunfo. Potencial para la creación de un mercado local de agua. Libro Técnico Núm. 10. Campo Experimental Centro de Chiapas, INIFAP. Ocozocoautla, Chiapas, México. 80 p. [ Links ]
López-Báez, W.; Magdaleno-González, R. y Castro-Mendoza, I. 2012. Riesgo a deslizamientos de laderas en siete microcuencas de la Reserva de la Biósfera El Triunfo. Libro técnico Núm. 7. Campo Experimental Centro de Chiapas, INIFAP. Ocozocoautla, Chiapas, México. 208 p. [ Links ]
Molina, E. 1998. Encalado para la corrección de la acidez del suelo. Asociación Costarricense de la Ciencia del Suelo. San José, Costa Rica. 45 p. [ Links ]
Noriega, A. G.; Cárcamo, R. B.; Gómez, C. M. A.; Schwentesius, R. R.; Cruz, H. S.; Leyva, B. J.; García, de la R. E.; López, R. U. I. y Martínez, H. L. 2014. Intensificación de la producción en la agricultura orgánica: caso café. Rev. Mex. Cienc. Agríc. 5(1):163-169. [ Links ]
OIRSA. 2001. Nutrientes macro (fósforo). Manual técnico buenas prácticas en cultivo del café orgánico. San José, Costa Rica. 69-75 pp. [ Links ]
Palacios, B. 2012. Análisis participativo de la oferta, amenazas y estrategias de conservación de los servicios ecosistémicos (SE) en áreas prioritarias de la subcuenca “La Suiza”- Chiapas México. Tesis de maestría. Centro Agronómico Tropical de Investigación y Enseñanza. Turrialba, Costa Rica. 118 p. [ Links ]
Rodríguez, M. y Morales, V. 2005. Toxicidad por manganeso en huertos de mango Haden en Venezuela. Instituto de la Potasa y el Fósforo. Informaciones agronómicas núm. 56. 9-10 pp. [ Links ]
SAGARPA. 2010. Servicio de información agroalimentaria y pesca. Secretaría de Agricultura, Ganadería, Desarrollo Rural, Pesca y Alimentación. México. http://www.siap.gob.mx/. [ Links ]
SEPHU. 2013. Cultivo del café. Tratamientos de choque para resolver los problemas derivados del bloqueo de suelos por la fertilización química. Sociedad Española de Productos Húmicos. Noticias SEPHO NO. 082. Zaragoza, España. 8 p. [ Links ]
Valencia, G. 1998. Manual de nutrición y fertilización del café. International Plant Nutrition Institute. Costa Rica. 18-34 pp. [ Links ]
Received: January 2016; Accepted: April 2016
 Este es un artículo publicado en acceso abierto bajo una licencia Creative Commons
