


Servicios Personalizados
Revista
Articulo
 texto en
  Español (pdf)
 Artículo en XML
 Referencias del artículo
 Enviar artículo por email
Indicadores
-
 Citado por SciELO
 -
 Accesos
Links relacionados
-
 Similares en
SciELO
Similares en
SciELO
Compartir

 Permalink
Agricultura, sociedad y desarrollo
versión impresa ISSN 1870-5472
agric. soc. desarro vol.13 no.3 Texcoco jul./sep. 2016
Articles
Economic structure and policy analysis in rural localities of sonora
1 El Colegio de Sonora (rosanamb00@hotmail.com)
The rural economic analysis at the level of rural localities, especially the one carried out with economic-accounting tools -Social Accounting Matrix (SAM) and Multisectoral Models (MM)- makes it possible to generate key and timely information for the design of promotion strategies and policy actions in accordance to the rural reality. This research, developed in five rural localities of the state of Sonora, contributes significant elements about the current rural economy and its response capacity to future incentives or external shocks.
Key words: rural development; economy; localities; promotion policy
El análisis económico rural a nivel de localidades rurales, en especial el realizado a partir de herramientas económico-contable -Matrices de Contabilidad Social (MCS) y los Modelos Multisectoriales (MM)-, posibilita la generación de información clave y oportuna para el diseño de estrategias de fomento, y acciones de política acordes a la realidad rural. Esta investigación, desarrollada en cinco localidades rurales del estado Sonora, aporta elementos significativos sobre la economía rural actual y su capacidad de respuesta futuros incentivos o choques externos.
Palabras claves: desarrollo rural; economía; localidades; política de fomento
Introduction
The changes in economic matters that have taken place since the end of the past century -commercial openness, crisis of the countryside and food, reconsideration of the sectorial policy, among others- have affected considerably the rural economy. These events modified the traditional scheme of the agricultural and livestock policy, breaking the connection between the national policies and the support programs that benefit countryside producers, especially those residing in rural localities. In Sonora, the latter have not been foreign to those impacts; its residents make an effort day after day to offset the basic needs, becoming employed in activities of low pay, with high levels of uncertainty and with little or null opportunities for development. The changes in the agricultural and livestock sector have affected its prosperity; the strategies designed to reactivate its economies are scarce, and those that do exist seem not to have had the expected effect.
There is, it seems, disengagement between the promotion strategy and the rural economy: while the rural economy policy is concentrated in the promotion of agricultural and livestock activities, particularly those directed at commercial production (extensive/exports), income sources that are not agricultural/livestock acquire greater presence in rural localities. This situation creates a void that leaves aside the rural localities and which disregards at the same time the guidelines by international organizations and agencies that advocate for countries to strengthen their rural environment and to fight to reach food security.
The solution requires the design of an economic policy in accordance to the current situations and whose objectives are projected in the medium and long term; more importantly still, the effectiveness of the rural development strategy would entail a prior diagnosis of the current requirements and especially of the economic potentials of rural localities. An optimal tool for this recognition is the Social Accountability Matrix (SAM), which allows understanding the economy of a country, state or locality determined under a quantitative approach, but involving economic and social particularities. The SAMs, especially those of towns, have broad flexibility and can be adapted to the needs and the preferences of those who build them. They are excellent instruments for the planning and design of policies. Once the economic structure is described, both qualities make it possible to elaborate Multisectoral Models (MMs) where alternate scenarios and/or exogenous changes are tested, such as policy modifications, fall of prices, and increase of remittances, among others.
In this idea, the objective is to show how the economic analysis at the level of rural localities, especially the one carried out stemming from SAMs and MMs, enables the generation of key and timely information for the design of promotion strategies and policy actions in accordance to the rural reality.
In addition to this introduction, in order to fulfill what has been stated, the document contemplates three sections. In the first one, the role of the rural localities as units of economic analysis is discussed, as well as the importance of constructing community databases and elaborating economic models. In a second section, some results obtained from the use of these techniques are shown for a group of rural localities in Sonora; the economic structure is presented basically. Finally, the results of a series of policy simulation exercises in the rural environment are presented in the third section. The document contains a set of conclusions and the list of bibliography consulted.
Rural localities and economic modelling: SAMs and MMs
Rural localities have a key role in economic development and the solution to poverty. These are territories that have undergone constant processes of reorganization and change, both in their economic and social structures. This transformation affects the living conditions of their residents and generates a series of economic and social difficulties1.
In general, the economic flows in rural towns are conceived as relatively simple; however, there are cases where the institutional structure, the consumption and the exchange relationships have great complexity. It concerns a small economy that functions with the difficulties characteristic of an open one2. This complicated reality, which most times is not taken into account, alters the results obtained from research that studies the implications of variations in economic policy or unexpected external shocks (Bracamonte, 2001). Therefore, an analysis of greater effectivity should stem from the study of rural localities and, more specifically, from the family units, households3.
Considering households as study units enables building databases and models, depending on the very aims of the research, or else, according to the characteristics specific to the rural economic structure: diversity in the sources of income, production destined to auto-consumption, and presence of family work, among others. This type of analysis is known as "new household economics" and a powerful perspective regarding the decision-making process, for it allows designing strategies for economic promotion that are more appropriate to the reality of the rural environment4.
Economic modelling applied to rural localities constitutes a whole line of analysis and research within the social sciences. It approaches the particularities of the economy from the adaptation of analytical instruments such as Social Accountability Matrices (SAMs) and the Multisectoral Models (MMs). These tools link the approach of incomes and public policy contexts (strategies for support/promotion); they make use of both economic and social data, which are gathered from first and second hand, that is, from the application of socioeconomic surveys. Next, the particularities of these instruments are detailed, and their application for the study of five rural localities in the state of Sonora is shown in later sections.
Social Accounting Matrix (SAM): Databases
The Social Accountability Matrix (SAM) is the specific representation of the economy of a country, region, province or town, during a specific period. It involves an expanded Input-Product Matrix (IPM), which, in addition to the structure of the production, includes data about the interrelations of the production sectors, payment to factors, distribution of income, and demand structure of the local institutions, as well as their connections to the exterior5.
The SAM is an accounting structure, made up of double-entry accounts, which record the transactions that the economic sectors and agents carry out in a specific lapse of time, generally one year. On the rows the incomes are recorded and on the columns the expenses. Both in its national version and for towns, the different input flows are synthesized, as well as the production and income that take place between the different economic sectors, the income flows between productive activities and households, the distribution of family (household) income in consumption and investment, and the exchange of goods and factors between the economy and the rest of the world (Table 1).
Table 1. Structure of the SAM for a town.
| Actividades | Factores | Instituciones | Capital (S/I) |
Resto del mundo |
Total | |
|---|---|---|---|---|---|---|
| Actividades | Consumo intermedio (MIP) |
Consumo privado y público |
Inversión | Exportación | Ventas totales | |
| Factores | Valor agregado de la prod. local |
Valor agregado | ||||
| Instituciones | Impuesto | Ingreso factorial de las familias |
Transferencias | Remesas | Ingreso de los hogares |
|
| Capital (S/I) | Ahorro de las familias y el gobierno |
Ahorro externo | Ahorro total | |||
| Resto del mundo | Importación | Importación | ||||
| Total | Gasto totales (PIB) | Gasto total de los factores |
Gastos total de las instituciones |
Inversión total |
Exportación y remesas |
Ingresos y gastos totales |
Source: taken Méndez (2011).
One of the advantages of the SAM is the fact that it can be designed for any class of economy: its flexibility allows addressing both the global and the community class and its accounts can be adapted to the characteristics of the economy that is analyzed. However, there are some limitations; for example, it requires a large amount and variety of information, which on occasion is difficult to locate, or else, it does not exist, forcing it to establish assumptions to complete the matrix, which diminish the credibility of the study (Méndez, 2004).
Multisectoral Models (MMs): policy scenarios
The Multisectoral Models (MMs) are fed with information provided by the SAMs and they are tools that allow studying the connections between local economic agents, as well as between the economies of the towns where they reside and their environment. According to Yúnez and Taylor (1999), the analysis of multipliers (accounting) applied to SAMs is used to evaluate the impact of various exogenous changes on the components (activities, factors and institutions) of a locality, such as the reforms in agricultural and environmental policy. Some of the most important effects to be studied are those that are present in the income and its distribution, in the investment, and in the structure of expenditures of the institutions (households basically)6.
There are several types of MMs that use the data obtained from the SAM7; however, in this case, Multiplier Analysis (MAs) is used to analyze some policy scenarios and their implications for the rural economy of the state of Sonora, whose characteristics and results are presented in the third section.
Application of SAMs for Sonora localities: basic characteristics
Methodological aspects and study area
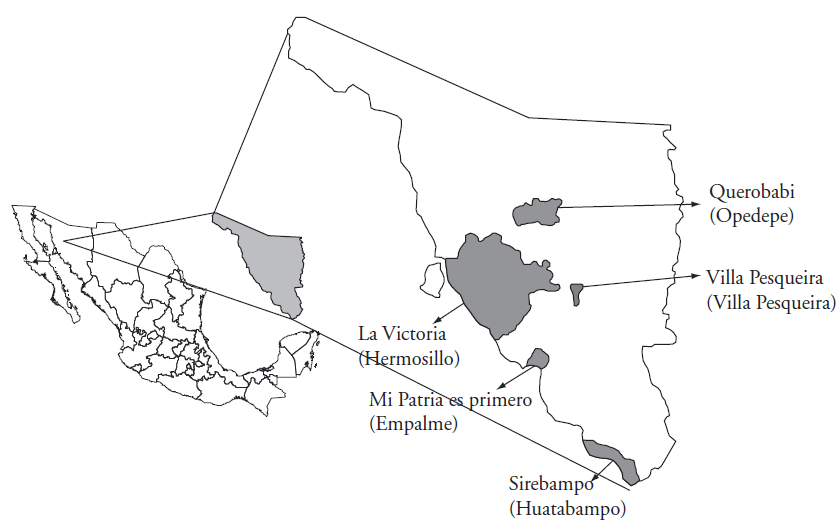
A group of rural localities in Sonora were selected as empirical reference. These localities are the following: Mi Patria es primero, in the municipality of Empalme; La Victoria, locality of Hermosillo; Querobabi, in Opodepe; Sirebampo, in the municipality of Huatabampo; and Villa Pesqueira, in the Sierra zone and township of the municipality by the same name. The selection stemmed from the demographic criterion proposed by INEGI (2005) for México, which points to the localities of less than 2 thousand 500 inhabitants to be considered. Likewise, the localities correspond to five regionalization zones established by the Sonora Planning and Development Commission (Comisión de Planeación y Desarrollo de Sonora, COPLADES): Hermosillo, Ures-Río Sonora and San Miguel, Yaqui-Mayo (Southern Coast), Guaymas-Empalme, Central Region (Méndez, 2011) (Figure 1).
The compilation of field information was carried out through two pathways: 1) through the observation and in-depth knowledge of the locality; and 2) through a socioeconomic survey of "panel type" of a sample of households from different localities in the study8. Both -visits and surveys in households- were performed during the months of January-March in 2003 and 2008, respectively9.
Given that the aim is to describe the socioeconomic structure of a locality during a specific period, the survey emphasized the productive activities, as well as the flows/sources of income and expenditures that took place during the years before its application, that is, 2002 and 200710. The socioeconomic questionnaire applied in this study is adapted to the conditions of the localities of study. The information obtained in the questionnaire was enriched with information from secondary sources, as well as with interviews with the authorities and other residents11.
One of the first contributions of the survey applied was the definition of the households and activities. The structure of households that was made for each one of the five localities stemmed from the household's main source of income. Seven different sources of income were identified, which were integrated into three groups: 1) Income from productive activities, where the activities are found that they perform on their own, such as agricultural/livestock and natural resources, and also the production of goods and services; 2) Income from paid work, where work as day laborers (agricultural/livestock), industry and construction, and commerce and services are placed; and, 3) Other sources of income, such as remittances and transferences and public resources (productive and social). From this, seven types of households were defined for each locality (Table 2).
Table 2. Classification of households: main source of income.
| Clasificación | Fuente de ingreso |
Sector/Actividad eco./Rubro |
|---|---|---|
| HAyRN | Act. productivas |
Agropecuarios y Recursos Naturales |
| HByS | (Cuenta propia) |
Bienes y Servicios |
| HAJ | Primario (Jornaleros) | |
| HAIyC | Asalariados | Industria y Construcción |
| HACyS | Comercio y Servicios | |
| HRyT | Otros ingresos | Remesas y Transferencias |
| HRP | Recursos Públicos |
Source: authors’ elaboration according to the information gathered in the survey.
This classification of households was used for the two years of analysis (2002 and 2007). It was not possible to find in all the localities all the types of households, and there were even localities that experienced changes in the composition from one period to another. For example, the proportion of some households, such as HB&S and HJ, decreased, and the one that corresponds to HAI&C, HAC&S and HRP increased. Only that of HA&RN and HR&T remained the same (Figure 2).
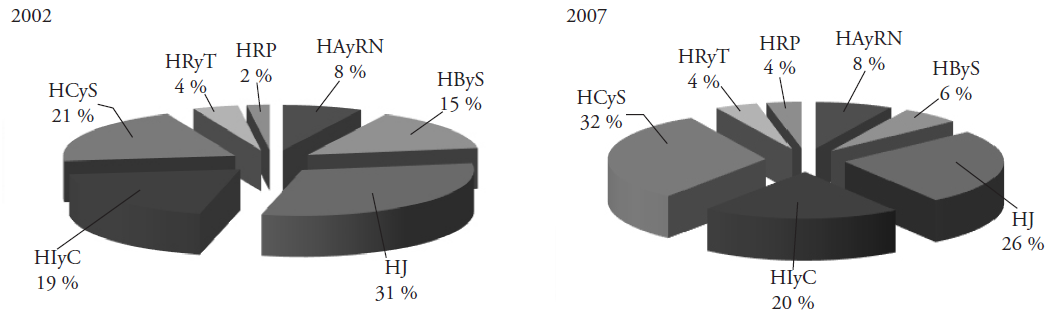
Source: authors’ elaboration from the surveys applied in the localities of study in 2003 and 2008.
Figure 2 Distribution of households 2002 and 2007.
Concerning the productive structure, three types of activities were defined: a) Agricultural/livestock, where agriculture and livestock production are considered12; b) Other Productive Activities (OPA), which consist of the elaboration of bread and tortillas, and other backyard activities; and c) Trade and services, where all the commercial or services (business) activities found in the locality were recorded13. In addition to the households and activities, the SAM is composed of other sections: production factors, capital accounts and external accounts14.
Although initially the construction of the SAMs for each of the periods of analysis (2002 and 2007) was done for the five localities individually, the presentation of the results, both of the economic structure and of the simulation exercises, will be carried out as a whole for the five localities. For this purpose, all of the SAMs will be integrated into what we call Integrated Social Accountability Matrices (SAMra), which include the information for the five localities in each one of these for the two years15 (Table 3 and 4).
Table 3. Aggregate Social Accountability Matrix (SAMra), 2002* Thousands of real pesos (2007=100).
| Factores productivos | Instituciones | |||||||||||||||
|---|---|---|---|---|---|---|---|---|---|---|---|---|---|---|---|---|
| Trabajo | Tierra | Capital | Hogares | Gobierno | ||||||||||||
| Cuenta propia | Asalariado | Otros ingresos | ||||||||||||||
| Asalariado | Familiar | Agrop. y rec. nat |
Bienes y serv. |
Jornaleros | Ind. y const. |
Com. y serv. |
Remesas y transf. |
Rec. Públicos |
||||||||
| 1 | 2 | 3 | 4 | 5 | 6 | 7 | 8 | 9 | 10 | 11 | 12 | |||||
| Trabajo | Asalariado | 1 | 0.0 | 0.0 | 0.0 | 0.0 | 0.0 | 0.0 | 0.0 | 0.0 | 0.0 | 0.0 | 0.0 | 5033.8 | ||
| Factores productivos | Familiar | 2 | 0.0 | 0.0 | 0.0 | 0.0 | 0.0 | 0.0 | 0.0 | 0.0 | 0.0 | 0.0 | 0.0 | 0.0 | ||
| Tierra | 3 | 0.0 | 0.0 | 0.0 | 0.0 | 0.0 | 0.0 | 0.0 | 0.0 | 0.0 | 0.0 | 0.0 | 0.0 | |||
| Capital | 4 | 0.0 | 0.0 | 0.0 | 0.0 | 0.0 | 0.0 | 0.0 | 0.0 | 0.0 | 0.0 | 0.0 | 0.0 | |||
| Cuenta propia | Agrop. y rec. Nat | 5 | 2867.5 | 827.7 | 13.3 | 12.0 | 238.3 | 80.2 | 680.8 | 242.7 | 400.8 | 80.2 | 40.6 | 0.0 | ||
| Bienes y serv. | 6 | 55.6 | 765.6 | 13.3 | 8.0 | 6.4 | 6.4 | 12.8 | 6.4 | 108.7 | 0.0 | 6.4 | 0.0 | |||
| Jornaleros | 7 | 12 220.4 | 3406.1 | 26.6 | 40.6 | 75.7 | 25.8 | 138.9 | 25.8 | 288.8 | 12.5 | 3.3 | 0.0 | |||
| Instituciones | Hogares | Asalariado | Ind. y const. | 8 | 18 796.0 | 3522.7 | 13.3 | 36.3 | 148.8 | 32.5 | 288.1 | 45.1 | 161.6 | 32.3 | 3.3 | 0.0 |
| Com. y serv. | 9 | 38 129.5 | 3985.4 | 226.4 | 35.5 | 0.0 | 0.0 | 0.0 | 0.0 | 0.0 | 0.0 | 0.0 | 0.0 | |||
| Otros ingresos | Remesas y transf. | 10 | 1342.0 | 675.9 | 0.0 | 7.7 | 0.0 | 0.0 | 0.0 | 0.0 | 0.0 | 0.0 | 0.0 | 0.0 | ||
| Rec. Públicos | 11 | 36.6 | 451.4 | 13.3 | 4.0 | 0.0 | 0.0 | 0.0 | 0.0 | 0.0 | 0.0 | 0.0 | 0.0 | |||
| Gobierno | 12 | 0.0 | 0.0 | 0.0 | 0.0 | 313.3 | 256.2 | 1253.5 | 985.2 | 1605.6 | 197.0 | 52.6 | 0.0 | |||
| Capital | Ahorro Físico | 13 | 0.0 | 0.0 | 0.0 | 0.0 | 1704.2 | 100.1 | 545.0 | 1,031.9 | 1956.0 | 146.3 | 0.0 | 0.0 | ||
| Ahorro Humano | 14 | 0.0 | 0.0 | 0.0 | 0.0 | 135.4 | 566.0 | 725.3 | 816.3 | 1640.4 | 241.3 | 6.1 | 0.0 | |||
| Agricultura y ganadería | 15 | 0.0 | 0.0 | 0.0 | 0.0 | 2,257.0 | 1674.5 | 6098.8 | 3845.2 | 20 005.7 | 668.1 | 1359.8 | 0.0 | |||
| Actividades productivas | Otras Act. Productivas (OAP) | 16 | 0.0 | 0.0 | 0.0 | 0.0 | 35.8 | 33.8 | 23.4 | 182.0 | 85.7 | 33.6 | 0.3 | 0.0 | ||
| Comercio y servicios | 17 | 0.0 | 0.0 | 0.0 | 0.0 | 3434.4 | 3656.4 | 7794.8 | 11 305.1 | 20 384.7 | 3013.9 | 995.2 | 1088.4 | |||
| Resto de la región | 18 | 0.0 | 0.0 | 0.0 | 0.0 | 1610.1 | 3414.7 | 4775.9 | 5289.2 | 13 078.5 | 1060.2 | 677.1 | 855.3 | |||
| Cuentas externas | Resto de México | 19 | 0.0 | 0.0 | 0.0 | 0.0 | 2169.3 | 864.3 | 2824.2 | 3085.5 | 8574.7 | 2832.3 | 111.4 | 164.2 | ||
| Resto del mundo | 20 | 0.0 | 0.0 | 0.0 | 0.0 | 98.1 | 200.5 | 1058.7 | 1052.6 | 2547.6 | 207.7 | 55.7 | 0.0 | |||
| Total | 21 | 73 447.6 | 13 634.8 | 306.3 | 143.9 | 12 226.9 | 10 911.2 | 26 220.2 | 27 912.9 | 70 838.8 | 8525.3 | 3321.9 | 7141.6 | |||
| Diferencia | 0.0 | 0.0 | 0.0 | 0.0 | 0.0 | 0.0 | 0.0 | 0.0 | 0.0 | 0.0 | 0.0 | 0.0 | ||||
*Thousands of real pesos (2007=100). *Adjusted Matrix; OAP: Other productive activities.
Source: authors’ elaboration from the surveys applied in 2003 and 2008, respectively.
Table 3. Continuation
| Capital/Ahorro | Actividades productivas | Cuentas externas | Total | ||||||||||
|---|---|---|---|---|---|---|---|---|---|---|---|---|---|
| Físico | Humano | Agricultura y ganadería |
Otras Actividades Productivas (OAP) |
Comercio y servicios |
Resto región |
Resto México |
Resto mundo |
||||||
| 13 | 14 | 15 | 16 | 17 | 18 | 19 | 20 | 21 | |||||
| Trabajo | Asalariado | 1 | 0.0 | 0.0 | 15 625.4 | 8623.2 | 32 048.8 | 12 116.4 | 0.0 | 0.0 | 73 447.6 | ||
| Factores productivos | Familiar | 2 | 0.0 | 0.0 | 7826.6 | 1612.4 | 4195.8 | 0.0 | 0.0 | 0.0 | 1634.8 | ||
| Tierra | 3 | 0.0 | 0.0 | 306.3 | 0.0 | 0.0 | 0.0 | 0.0 | 0.0 | 306.3 | |||
| Capital | 4 | 0.0 | 0.0 | 115.8 | 0.0 | 28.1 | 0.0 | 0.0 | 0.0 | 143.9 | |||
| Cuenta propia | Agrop. y rec. nat | 5 | 0.0 | 0.0 | 0.0 | 0.0 | 0.0 | 4911.3 | 1171.1 | 660.4 | 12 226.9 | ||
| Bienes y serv. | 6 | 0.0 | 0.0 | 0.0 | 0.0 | 0.0 | 5922.2 | 3999.5 | 0.0 | 10 911.2 | |||
| Jornaleros | 7 | 0.0 | 0.0 | 0.0 | 0.0 | 0.0 | 1930.4 | 6434.0 | 1581.3 | 26 220.2 | |||
| Instituciones | Hogares | Asalariado | Ind. y const. | 8 | 0.0 | 0.0 | 0.0 | 0.0 | 0.0 | 2519.7 | 2179.6 | 133.6 | 27 912.9 |
| Com. y serv. | 9 | 0.0 | 0.0 | 0.0 | 0.0 | 0.0 | 16 761.6 | 11 700.4 | 0.0 | 70 838.8 | |||
| Otros ingresos | Remesas y transf. | 10 | 0.0 | 0.0 | 0.0 | 0.0 | 0.0 | 60.6 | 1272.4 | 5166.8 | 8525.3 | ||
| Rec. Públicos | 11 | 0.0 | 0.0 | 0.0 | 0.0 | 0.0 | 508.6 | 2307.9 | 0.0 | 3321.9 | |||
| Gobierno | 12 | 0.0 | 0.0 | 0.0 | 0.0 | 0.0 | 830.6 | 1647.7 | 0.0 | 7141.6 | |||
| Capital | Ahorro Físico | 13 | 0.0 | 0.0 | 0.0 | 0.0 | 0.0 | 0.0 | 0.0 | 0.0 | 5483.5 | ||
| Ahorro Humano | 14 | 0.0 | 0.0 | 0.0 | 0.0 | 0.0 | 0.0 | 0.0 | 0.0 | 4130.8 | |||
| Agricultura y ganadería | 15 | 3395.2 | 0.0 | 783.1 | 0.0 | 0.0 | 13 216.6 | 3076.7 | 672.0 | 57 052.7 | |||
| Actividades productivas | Otras Act. Productivas (OAP) | 16 | 0.0 | 0.0 | 0.0 | 1583.1 | 0.0 | 8026.7 | 2276.0 | 0.0 | 12 280.4 | ||
| Comercio y servicios | 17 | 836.7 | 1628.7 | 10 976.1 | 442.3 | 211.9 | 3332.5 | 1110.8 | 0.0 | 70 212.0 | |||
| Resto de la región | 18 | 1251.5 | 2502.1 | 16 406.5 | 13.6 | 23 978.2 | 0.0 | 0.0 | 0.0 | 74 912.9 | |||
| Cuentas externas | Resto de México | 19 | 0.0 | 0.0 | 5012.9 | 3.9 | 6499.5 | 4775.6 | 0.0 | 4259.4 | 41 177.1 | ||
| Resto del mundo | 20 | 0.0 | 0.0 | 0.0 | 1.9 | 3249.7 | 0.0 | 4001.1 | 0.0 | 12 473.5 | |||
| Total | 21 | 5483.5 | 4130.8 | 57 052.7 | 12 280.4 | 70 212.0 | 74 912.9 | 41 177.1 | 12 473.5 | 532 354.3 | |||
| Diferencia | 0.0 | 0.0 | 0.0 | 0.0 | 0.0 | 0.0 | 0.0 | 0.0 | |||||
*Thousands of real pesos (2007=100). *Adjusted Matrix; OAP: Other productive activities.
Source: authors’ elaboration from the surveys applied in 2003 and 2008, respectively.
Table 4. Aggregate Social Accountability Matrix (SAMra), 2007*
| Factores productivos | Instituciones | |||||||||||||||
|---|---|---|---|---|---|---|---|---|---|---|---|---|---|---|---|---|
| Trabajo | Tierra | Capital | Hogares | Gobierno | ||||||||||||
| Cuenta propia | Asalariado | Otros ingresos | ||||||||||||||
| Asalariado | Familiar | Agrop. y rec. naturales |
Bienes y serv. | Jornaleros | Ind. y const. | Com. y serv. |
Remesas y transf. |
Rec. Públicos |
||||||||
| 1 | 2 | 3 | 4 | 5 | 6 | 7 | 8 | 9 | 10 | 11 | 12 | |||||
| Trabajo | Asalariado | 1 | 0.0 | 0.0 | 0.0 | 0.0 | 0.0 | 0.0 | 0.0 | 0.0 | 0.0 | 0.0 | 0.0 | 0.0 | ||
| Factores productivos | Familiar | 2 | 0.0 | 0.0 | 0.0 | 0.0 | 0.0 | 0.0 | 0.0 | 0.0 | 0.0 | 0.0 | 0.0 | 0.0 | ||
| Tierra | 3 | 0.0 | 0.0 | 0.0 | 0.0 | 0.0 | 0.0 | 0.0 | 0.0 | 0.0 | 0.0 | 0.0 | 0.0 | |||
| Capital | 4 | 0.0 | 0.0 | 0.0 | 0.0 | 0.0 | 0.0 | 0.0 | 0.0 | 0.0 | 0.0 | 0.0 | 0.0 | |||
| Cuenta propia | Agrop. y rec. Nat | 5 | 160.2 | 3652.9 | 0.0 | 54.4 | 0.0 | 0.0 | 0.0 | 0.0 | 0.0 | 0.0 | 0.0 | 0.0 | ||
| Bienes y serv. | 6 | 4411.7 | 3551.0 | 141.7 | 78.6 | 9.8 | 32.5 | 59.4 | 52.6 | 28.6 | 14.2 | 3.9 | 0.0 | |||
| Jornaleros | 7 | 33 912.0 | 10 379.4 | 1017.6 | 182.2 | 40.4 | 162.3 | 311.4 | 261.1 | 146.2 | 80.0 | 16.2 | 0.0 | |||
| Instituciones | Hogares | Asalariado | Ind. y const. | 8 | 30 136.9 | 3040.8 | 262.2 | 101.6 | 0.0 | 65.8 | 48.4 | 118.3 | 132.8 | 17.5 | 0.0 | 0.0 |
| Com. y serv. | 9 | 41 981.5 | 6634.1 | 0.0 | 89.2 | 0.0 | 0.0 | 0.0 | 0.0 | 0.0 | 0.0 | 0.0 | 0.0 | |||
| Otros ingresos | Remesas y transf. | 10 | 696.7 | 526.1 | 0.0 | 22.4 | 0.0 | 0.0 | 0.0 | 0.0 | 0.0 | 0.0 | 0.0 | 0.0 | ||
| Rec. Públicos | 11 | 35.4 | 1423.1 | 0.0 | 21.8 | 0.0 | 0.0 | 0.0 | 0.0 | 0.0 | 0.0 | 0.0 | 0.0 | |||
| Gobierno | 12 | 0.0 | 0.0 | 0.0 | 0.0 | 118.8 | 943.2 | 1059.4 | 934.5 | 1835.7 | 192.7 | 92.8 | 0.0 | |||
| Capital | Ahorro Físico | 13 | 0.0 | 0.0 | 0.0 | 0.0 | 71.5 | 986.9 | 1292.8 | 699.7 | 668.7 | 269.3 | 4.9 | 0.0 | ||
| Ahorro Humano | 14 | 0.0 | 0.0 | 0.0 | 0.0 | 226.3 | 397.7 | 1032.7 | 1303.5 | 2987.8 | 310.3 | 297.9 | 0.0 | |||
| 15 | 0.0 | 0.0 | 0.0 | 0.0 | 1785.5 | 1205.7 | 4302.8 | 847.2 | 1126.3 | 120.5 | 710.4 | 0.0 | ||||
| Actividades productivas | Otras Act. Productivas (OAP) | 16 | 0.0 | 0.0 | 0.0 | 0.0 | 4.8 | 315.6 | 223.3 | 623.9 | 308.3 | 104.4 | 0.0 | 0.0 | ||
| 17 | 0.0 | 0.0 | 0.0 | 0.0 | 2643.0 | 10 346.0 | 24 358.9 | 22 968.6 | 28 678.6 | 2922.2 | 2159.7 | 1367.3 | ||||
| Resto de la región | 18 | 0.0 | 0.0 | 0.0 | 0.0 | 732.9 | 7465.6 | 7723.4 | 9875.5 | 8896.8 | 1321.3 | 306.2 | 2971.2 | |||
| Cuentas externas | Resto de México | 19 | 0.0 | 0.0 | 0.0 | 0.0 | 491.2 | 2853.0 | 8406.2 | 1916.1 | 6333.0 | 210.4 | 97.1 | 838.5 | ||
| 20 | 0.0 | 0.0 | 0.0 | 0.0 | 42.4 | 691.5 | 408.3 | 448.7 | 486.7 | 85.5 | 1.5 | 0.0 | ||||
| Total | 21 | 111 334.3 | 29 207.3 | 1421.5 | 550.2 | 6166.7 | 25 465.9 | 49 226.8 | 40 049.6 | 51 629.4 | 5648.2 | 3690.6 | 5177.0 | |||
| Diferencia | 0.0 | 0.0 | 0.0 | 0.0 | 0.0 | 0.0 | 0.0 | 0.0 | 0.0 | 0.0 | 0.0 | 0.0 | ||||
*Aggregate Matrix 2007 (thousands of pesos).
*Adjusted Matrix; OAP: Other productive activities.
Source: authors’ elaboration from the surveys applied in 2003 and 2008, respectively.
Table 4. Continuation
| Capital/Ahorro | Actividades productivas | Cuentas externas | Total | ||||||||||
|---|---|---|---|---|---|---|---|---|---|---|---|---|---|
| Físico | Humano | Agricultura y ganadería |
Otras Actividades Productivas (OAP) |
Comercio y servicios |
Resto región |
Resto México |
Resto mundo |
||||||
| 13 | 14 | 15 | 16 | 17 | 18 | 19 | 20 | 21 | |||||
| Trabajo | Asalariado | 1 | 0.0 | 0.0 | 13 300.8 | 28 437.6 | 47 071.0 | 22 524.8 | 0.0 | 0.0 | 111 334.3 | ||
| Factores productivos | Familiar | 2 | 0.0 | 0.0 | 13 403.3 | 1207.4 | 14 596.6 | 0.0 | 0.0 | 0.0 | 29 207.3 | ||
| Tierra | 3 | 0.0 | 0.0 | 1421.5 | 0.0 | 0.0 | 0.0 | 0.0 | 0.0 | 1421.5 | |||
| Capital | 4 | 0.0 | 0.0 | 217.6 | 0.0 | 332.6 | 0.0 | 0.0 | 0.0 | 550.2 | |||
| Cuenta propia | Agrop. y rec. nat | 5 | 0.0 | 0.0 | 0.0 | 0.0 | 0.0 | 481.5 | 1777.6 | 40.2 | 6166.7 | ||
| Bienes y serv. | 6 | 0.0 | 0.0 | 0.0 | 0.0 | 0.0 | 8495.8 | 4985.4 | 3600.6 | 25 465.9 | |||
| Jornaleros | 7 | 0.0 | 0.0 | 0.0 | 0.0 | 0.0 | 414.2 | 1746.2 | 557.6 | 49 226.8 | |||
| Instituciones | Hogares | Asalariado | Ind. y const. | 8 | 0.0 | 0.0 | 0.0 | 0.0 | 0.0 | 3880.4 | 2200.4 | 44.6 | 40 049.6 |
| Com. y serv. | 9 | 0.0 | 0.0 | 0.0 | 0.0 | 0.0 | 1112.5 | 1605.9 | 206.3 | 51 629.4 | |||
| Otros ingresos | Remesas y transf. | 10 | 0.0 | 0.0 | 0.0 | 0.0 | 0.0 | 0.0 | 2027.0 | 2376.1 | 5648.2 | ||
| Rec. Públicos | 11 | 0.0 | 0.0 | 0.0 | 0.0 | 0.0 | 522.2 | 1,688.2 | 0.0 | 3690.6 | |||
| Gobierno | 12 | 0.0 | 0.0 | 0.0 | 0.0 | 0.0 | 0.0 | 0.0 | 0.0 | 5177.0 | |||
| Capital | Ahorro Físico | 13 | 0.0 | 0.0 | 0.0 | 0.0 | 0.0 | 0.0 | 0.0 | 0.0 | 3993.8 | ||
| Ahorro Humano | 14 | 0.0 | 0.0 | 0.0 | 0.0 | 0.0 | 0.0 | 0.0 | 0.0 | 6556.1 | |||
| Agricultura y ganadería | 15 | 2345.5 | 0.0 | 7143.0 | 0.0 | 0.0 | 21 522.3 | 5904.9 | 2551.4 | 49 565.4 | |||
| Actividades productivas | Otras Act. Productivas (OAP) | 16 | 0.0 | 0.0 | 0.0 | 4197.2 | 0.0 | 20 375.7 | 6036.1 | 2267.5 | 34 456.7 | ||
| Comercio y servicios | 17 | 898.7 | 2536.8 | 12 798.4 | 557.2 | 2962.8 | 3740.3 | 1068.6 | 534.3 | 120 541.5 | |||
| Resto de la región | 18 | 749.6 | 4019.4 | 1280.7 | 56.5 | 38 758.0 | 0.0 | 4204.6 | 0.0 | 88 361.6 | |||
| Cuentas externas | Resto de México | 19 | 0.0 | 0.0 | 0.0 | 0.5 | 11 551.1 | 5291.9 | 0.0 | 1783.1 | 39 772.1 | ||
| Resto del mundo | 20 | 0.0 | 0.0 | 0.0 | 0.3 | 5269.4 | 0.0 | 6527.2 | 0.0 | 13 961.6 | |||
| Total | 21 | 3993.8 | 6556.1 | 49 565.4 | 34 456.7 | 120 541.5 | 88 361.6 | 39 772.1 | 13 961.6 | 686 776.5 | |||
| Diferencia | 0.0 | 0.0 | 0.0 | 0.0 | 0.0 | 0.0 | 0.0 | 0.0 | |||||
*Aggregate Matrix 2007 (thousands of pesos).
*Adjusted Matrix; OAP: Other productive activities.
Source: authors’ elaboration from the surveys applied in 2003 and 2008, respectively.
These SAMra allowed analyzing the characteristics of the economic structure of each one of the localities, as well as a general view of the behavior of the rural economy in Sonora and some of the changes registered in the period analyzed (2002-2007).
Rural economic structure in Sonora defined from SAMs: indicators
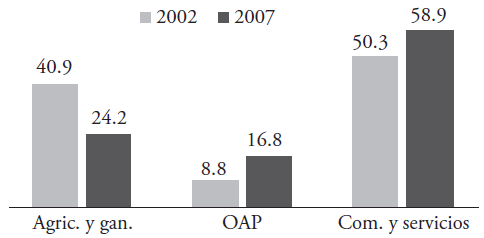
As was mentioned previously, three productive sectors were detected within the economy: 1) Agriculture and livestock production; 2) Other productive activities (OPA); and, 3) Trade and services. At first glance, the predominance of the trade and services sector has been observed above the rest of the activities, since both in 2002 and in 2007 this sector contributes more than 50 % of the income. The agricultural/livestock activities, that is agriculture and livestock production, participate with 40 and 24 %, respectively, for each period, and the other productive activities (OPA), where the manufacture of certain products is included, as well as those of construction, contribute 8 to 16 % of the production total (Figure 3).
The predominance of the tertiary sector within the rural economy can be justified by the scarce or null presence from the rest of the activities, for agriculture and livestock production are minimal in the localities: they are limited practically to livestock breeding for auto-consumption with little connection to the agricultural activity, since when there is cultivation it is exclusively for food for animals16. The rest of the activities (OPA) are much scarcer and they generate income: they are limited to occasional and complementary activities to paid employment (local and regional) in many of the cases.
In another idea, when observing the composition of the PLB from the Sources of income, we see that from the total of productive factors, paid work is the one that contributes in greater proportion to the added value (AV): between 70 and 80 % in both periods. Family work (FW) increased their contribution, for while in the first period (2002) it contributed around the 19 % of the AV, by 2007 it reaches more than 24 %. This contribution of FW represents between 10 and 14 % of the total PLB value.
Finally, the factors Capital and Land are those of lowest contribution to the local production in both periods. Their participation, both in FW and in PLB is nearly insignificant, of less than 1 % for 2002 and slightly over 1 % in 2007, only for the case of the land factor. This situation makes evident the scarce presence of the activities of primary and industrial production in the local productive structure. In addition, the low contribution of these last factors allows deducing that the inhabitants prefer employment than carrying out an activity of their own account.
Other components of the local domestic product are the Inputs. As in the work factor, the imported inputs, whether from the region or the rest of México, are of greater importance in the whole of the localities of study. This evidences the dependency between localities and their external environment, in this case as principal supply market. Another element that can be rescued is the differential between the contribution of the imported inputs and the local ones, which, although it decreases for 2007, is still close to double.
Another variable of interest that is derived from the SAMra is the Composition of the households' income. A clear differentiation in the sources of income is perceived, with paid work and remittances being the segments of greatest income generation for the households (Table 5).
Table 5. Composition of the income per source and type of household, 2007. Percentage participation in the total (%).
| Participación porcentual en el total (%) |
HAyRN | HByS | HJ | HIyC | HCyS | HRyT | HRP | Total |
|---|---|---|---|---|---|---|---|---|
| Tierra | - | 0.56 | 2.11 | 0.66 | - | - | - | 0.79 |
| Capital | 0.88 | 0.31 | 0.38 | 0.26 | 0.17 | 0.40 | 0.59 | 0.31 |
| Trabajo asalariado | 2.60 | 17.46 | 7.34 | 75.97 | 81.31 | 12.34 | 0.96 | 61.76 |
| Trabajo famiiiar | 59.24 | 14.06 | 21.53 | 7.67 | 12.85 | 9.31 | 38.56 | 16.20 |
| Resto de la región | 7.81 | 33.63 | 0.86 | 9.78 | 2.15 | 0.00 | 14.15 | 8.27 |
| Resto de México | 28.83 | 19.73 | 3.62 | 5.55 | 3.11 | 35.89 | 45.74 | 8.89 |
| Resto del mundo | 0.65 | 14.25 | 1.16 | 0.11 | 0.40 | 42.07 | - | 3.79 |
Source: authors’ elaboration from the Aggregate SAM, 2007.
The factor paid work contributes with the greatest part of the income, 61.8 % of the total. The households that depend mostly on this factor are the paid workers themselves: HJ, HI&C and HC&S. For these, the contribution of the work factor is higher than 70 % of the total income, and even, up to around 81 %. The rest of the factors, such as land and capital, contribute with a minimal part to the total income of the households (under 1 % in most of the households). The factor family work is only important for the HA&RN, where national remittances also stand out, with close to 30 % of their income.
A key indicator is the Per capita income. In the aggregated calculation of the household percentage, in the total, it is observed that there was an improvement in the average per capita income, increasing from around 26 thousand pesos to slightly over 29 thousand pesos annually; this represents 14 % of growth between 2002 and 2007. The households with highest per capita income in the period observed are those whose principal source of income is paid work in trade and services (HC&S), with slightly over 40 thousand pesos annually in average. Those with income from the production of diverse goods and services (HB&S) follow; these experience an increase in their income between 2002 and 2007 from slightly over 11 thousand pesos to more than 60 thousand pesos annually (Table 6)17.
Table 6. Income distribution per household, 2002-2007.
| Tipo de hogar | Ingreos total (Pesos) | Ingreso per capita (Pesos) | ||
|---|---|---|---|---|
| 2002 | 2007 | 2002 | 2007 | |
| HAyRN | 12 226 867.0 | 6 166 684.1 | 26 448 | 12 717.6 |
| HByS | 10 911 188.6 | 25 465 862.1 | 11 801 | 67 523.6 |
| HJ | 26 220 213.2 | 49 226 798.3 | 13 690 | 30 456.2 |
| HIyC | 27 912 922.9 | 40 049 614.8 | 23 480 | 32 319.6 |
| HCyS | 70 838 752.9 | 51 629 449.9 | 56 453 | 26 618.9 |
| HRyT | 8 525 324.2 | 5 648 237.6 | 32 272 | 20 967.1 |
| HRP | 3 321 860.0 | 3 690 618.3 | 25 149 | 17 125.1 |
| Total/Prom. | 159 957 128.7 | 181 877 265.0 | 26 043 | 29 612.1 |
Source: authors’ elaboration from the Aggregate SAMs for 2002 and 2007.
In the contrary case, the HA&RN see their per capita income reduced between the two years when losing more than 13 thousand pesos, staying with an annual perception of slightly over 12 thousand pesos annually18. The households that capture income from indirect sources, such as remittances and public resources (HR&T and HRP), reduced their per capita income in 2007, for they went from 20 967 to 17 125 pesos per household annually19.
In their part, remittances constitute an important source of income for the households. These are present in two different modalities: as payment or remuneration for the work performed by some members of the locality, or else, as money envoys from family members or friends that reside outside of it. At the level of locality the remittances of greatest importance are the regional and the national ones, with more than 40 % of the total for each period20.
Remittances captured by different types of households vary from one period to another. For 2002, the HC&S absorb slightly more than 30o% of the resources; the rest are distributed more or less homogenously in the rest between the other households. However, in 2007 there is a readjustment, with HC&S and HB&S being the ones that concentrate close to 70 % of the total. The HA&RN, HRP and HR&T are the ones that experience greatest decreases between both years (Figure 4).

Source: authors’ elaboration from the Aggregate SAMs for 2002 and 2007.
Figura 4 Distribution of remittances per type of household. 2002 and 2007.
Finally, with regards to the Composition of expenditure per segment and per type of household, it is observed that during the first period, 2002, there seems to be balance between consumption of goods and services from the outside, and in the local market. For 2007, the expenditure in local trade is increased, although the consumption in other activities (agricultural/livestock) is also reduced; for this last year there are also modifications in the patterns of human and physical savings (Figure 5).
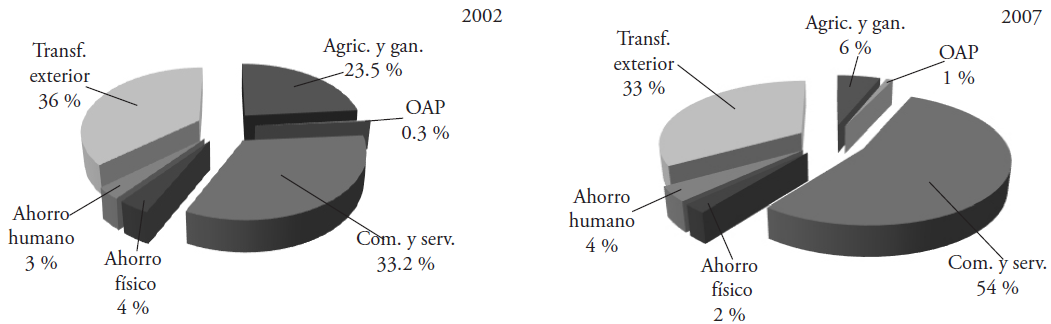
Source: authors’ elaboration from the Aggregate SAMs for 2002 and 2007.
Figura 5 Average expenditure per segment and per type of household. 2002 and 2007.
The sectors or segments where families spend more are, without a doubt, trade and services, with around 54 % of the total; in others (OPA and agricultural/livestock activities), it is small or non-existent. Transferences to the exterior are next, that is, the expenditures that households make outside the locality, with close to 34 % in average for all of the households. The households that seem to acquire more products from the outside are HB&S, perhaps due to the need for inputs, which could be scarce in the local commerce, or else, have higher prices.
Policy impacts on the rural economy: economic scenarios
The policy in matters of rural development in México rests on a complex network of support programs. Its origins date back to old subsidy programs to the agricultural sector, as well as to the purpose of assisting the vulnerable population that resides in the rural environment. Unfortunately the large majority of these programs were formulated to address problems that are characteristic of the circumstances, so that currently there is some disconnection between them; they do not have self-regulation mechanisms and, in fact, it is possible to detect duplicities21. Some evaluations and studies point out that these actions lack planning and a long-term strategy and which, more than concrete solutions, constitute an inadmissible wastefulness of public resources22.
With the idea of evaluating the response capacity of the rural economic structure for the state of Sonora, a Multiplier Analysis (MM) applied to SAMra was developed. The suggestion and determination of accounting multipliers required manipulation of the SAM, such as the separation of accounts and other elements23. Because of space, the procedure is not explained in detail, but it can be revised more deeply in Méndez (2011).
Once the procedure of the accounting multipliers applied to the SAMra was established, six simulation exercises are suggested, grouped into three themes: 1) Economic impulse; 2) Social and human welfare; and 3) Exogenous events (Table 7). They all imply injection of resources (money), for the idea is to observe the response capacity of the different types of accounts, as well as the impact itself. The selection was made taking the following criteria: 1) that the programs/strategies were susceptible of being applied in the rural environment; 2) that the modality of support is the direct delivery of resources to those interested (people individually, groups or families); and 3) that they were programs inscribed within the Special Concurring Program (Programa Especial Concurrente, PEC), because this is the general scheme of the federal rural policy24.
Table 7. Simulation exercises performed: summary.
| Número | Ejercicio | Descripción | Modalidad |
|---|---|---|---|
| 1 | Apoyo para infraestructura y modernización agropecuaria |
Inversión en infraestructura para riego y producción para los HAyRN. Monto de apoyo en 10 % valor de la producción agrop. |
Impulso económico |
| 2 | Apoyo a procesos de producción o comercialización (Diversificación) |
Recursos para fortalecimiento de comercialización de productos agropecuarios (AyG). Inyección de 10% del valor de producción. |
Impulso económico |
| 3 | Recursos para promoción y salvaguarda de las actividades productivas |
Recursos para los tres sectores (AyG, OAP y CyS) para adquisión de materiales, gastos de operación y otros. La inyección es de 10 % del valor de producción para cada sector. |
Impulso económico |
| 4 | Transferencias públicas vía OPORTUNIDADES (apoyos para educación) |
Apoyos para educación a la población estudiantil de bachillerato del medio rural (beca anual).** Inyección en 10 % de los ingresos anuales (total de hogares) |
Bienestar social y humano |
| 5 | Transferencias públicas vía PET (limpieza y mantenimiento a escuelas y espacios públicos)* |
Recursos para los hogares asalariados (HJ, HAIyC y HACyS) por un monto correspondiente a un incremento en 10 % de sus ingresos anuales. ** |
Bienestar social y humano |
| 6 | Transferencias del exterior vía remesas (regionales o nacionales) |
Remesas a los HRyT por un monto similar al 10% de las remesas captadas por los hogares** |
Eventos exógenos |
*Programa de Empleo Temporal, which serves the people affected by the low work offer or by natural phenomena, with temporary economic supports for their participation in projects for family or community benefit (SEDESOL).
** The amount of the injection is distributed in function of the representativeness of the household in the total.
The multiplier analysis performed proved that a part of the rural economy of the state does not respond with the same intensity to the changes of income resulting from the support programs or those of external shocks, but rather that each one of the sectors presents different connections and relationships. This is the case of productive and household activities, which respond differently to the effects of exogenous injections. Likewise, the propagation of effects towards the sectors or institutions depends on the type and the magnitude of simulated impacts. This heterogeneity is typical of this type of structures, from this the importance of its constant monitoring (Table 8).
Table 8. Simulation exercises applied to the SAMra: concentrate of results by order of importance.
| E1 | E2 | E3 | E4 | E5 | E6 | |||||||
|---|---|---|---|---|---|---|---|---|---|---|---|---|
| Absoluto | % | Absoluto | % | Absoluto | % | Absoluto | % | Absoluto | % | Absoluto | % | |
| TAsal | 1 476 546.07 | 1.33 | 3 363 782.39 | 3.02 | 14 364 361.70 | 12.90þ | 5 344 295.96 | 4.80 | 4 852 693.52 | 4.36þ | 2 055 467.43 | 1.85 |
| TFam | 704 932.30 | 2.41§ | 2 175 239.72 | 7.45¶ | 4 812 116.48 | 16.48¶ | 1 970 384.43 | 6.75þ | 1 636 335.36 | 5.60þ | 702 241.48 | 2.40 |
| Tierra | 38 487.18 | 2.71¶ | 174 746.12 | 12.29† | 192 151.83 | 13.52§ | 52 853.76 | 3.72 | 25 391.11 | 1.79 | 12 712.94 | 0.89 |
| Capital | 13 669.84 | 2.48§ | 38 736.23 | 7.04¶ | 94 540.07 | 17.18† | 41 519.11 | 7.55§ | 35 596.00 | 6.47§ | 15 151.43 | 2.75 |
| HAyRn | 5 048 179.42 | 81.86 | 280 719.59 | 4.55þ | 631 849.46 | 10.25 | 2 440 750.73 | 39.58 | 215 152.22 | 3.49 | 202 848.12 | 3.29 |
| HByS | 155 582.58 | 0.61 | 414 594.37 | 1.63 | 1 166 681.09 | 4.58 | 3 385 037.20 | 13.29 | 407 076.02 | 1.60 | 3 039 845.24 | 11.94† |
| HJ | 753 245.08 | 1.53þ | 1 904 739.18 | 3.87 | 6 151 952.21 | 12.50þ | 8 986 916.70 | 18.26 | 7 099 422.81 | 14.42 | 1 715 149.80 | 3.48 |
| HAIyC | 478 298.63 | 1.19 | 1 165 182.47 | 2.91 | 4 402 485.51 | 10.99 | 2 409 227.14 | 6.02 | 5 267 162.03 | 13.15 | 1 313 221.57 | 3.28 |
| HACyS | 719 102.67 | 1.39 | 1 768 759.97 | 3.43 | 6 524 792.64 | 12.64þ | 6 834 538.67 | 13.24 | 9 336 497.48 | 18.08 | 3 007 120.01 | 5.82 |
| HRyT | 22 494.23 | 0.40 | 61 808.76 | 1.09 | 180 418.08 | 3.19 | 70 626.11 | 1.25 | 61 291.51 | 1.09 | 512 390.13 | 9.07¶ |
| HRP | 35 357.29 | 0.96 | 108 588.33 | 2.94 | 242 771.34 | 6.58 | 1 554 364.33 | 42.12 | 82 679.37 | 2.24 | 317 130.62 | 8.59§ |
| AyG | 1 341 983.87 | 2.71¶ | 6 093 106.40 | 12.29 | 6 700 014.49 | 13.52 | 1 842 922.64 | 3.72 | 885 345.89 | 1.79 | 443 278.99 | 0.89 |
| OAP | 18 848.47 | 0.05 | 38 510.93 | 0.11 | 4 058 607.05 | 11.78 | 144 261.14 | 0.42 | 154 870.43 | 0.45 | 82 103.55 | 0.24 |
| CyS | 2 819 155.87 | 2.34§ | 4 345 543.61 | 3.61 | 23 602 759.00 | 19.58 | 12 114 554.20 | 10.05¶ | 11 491 261.43 | 9.53¶ | 4 785 583.65 | 3.97 |
| PLB | 9 136 528.15 | 4.47† | 10 477 160.93 | 5.12§ | 34 361 380.54 | 16.80¶ | 32 289 464.48 | 15.78† | 28 378 907.14 | 13.87 | 12 587 982.72 | 6.15þ |
†Primary.
¶Secondary.
§Rebound.
ÞPassive.
The positive impact towards the productive activities (simulation exercises 2 and 3) generates a more homogenous demand of the production factors, providing in turn income to the households. The reactivation of accounts of activities through supports from the productive policy allows elevating the income levels, primarily if these were carried out in a joint manner. Therefore, an exogenous injection directed at the households do not have the same effect than the one observed in the activities. Impacting positively the households affects at a first moment the activities and then the factors; in that sense, the impact is diluted and doesn't manage to return to the same households. Thus, for the effect of the impact to be complete, there is a need to inject the greater part or else the totality of the households (exercise 4).
However, the differences in the multipliers of each type of household must be considered. When those with preponderance of income from salary or daily wage are impacted (HJ, HAI&C and HC&S), a similar effect to that recorded in the case of the productive activities is confirmed (exercises 5 and 3). This situation is not repeated in the case of an injection towards the households, whose income depends on the work on their own account (exercise 1): given their connection, although the primary effect is in the activities, at the end the effect does not have the sufficient strength to return the impact to the rest of the accounts (the rest of the households, for example). In turn, the injection of resources via remittances (exercise 6) maintains a lower effect, although greater than the one obtained when impacting the primary activities or the households that depend on these (HA&RN).
The direct impact on the local production (PLB) is diverse. When the impact is given via the local productive impulse (activities), a recurring cycle of supports is provoked that finally translates into a considerable growth of the PLB (exercise 3). The direct impact on the population with resources via support programs (scholarships and others) also shows a positive effect on the growth of the local population; this is more significant when the paid households are benefitted (exercise 5). However, seen individually, this type of injections are less effective, for, as was said before, the power of dispersion of the incomes have lesser strength than in the case of the activities. This implies that when impacting independent accounts, that is, a single household or activity, the effect on the production is minimal (exercises 1 and 2), and it is greater when directed at a population group as a whole, or else, at several activities.
This proves the density of the rural economy and its interconnections, as well as its productive heterogeneity.
Conclusions
Once the main characteristics of the rural structure of a group of localities in the state of Sonora were identified from SAMs and the evaluation of "economic scenarios", from the multiplier analysis (MMs), it is possible to derive some conclusions and reflections in this regard.
The evaluation of the changes caused in the five localities of study, considering them together as a reference of the situation in the rural environment in the state of Sonora, shows that a large part of the modifications respond to the behavior both of the national rural economy and the international one. In general, there is a reduction in the role of agricultural and livestock activities, both in the generation of the local production (PLB) and in the contribution of income and employment to the rural households. In fact, rather than a reduction, a "recomposition of the rural productive structure" is observed, where the commercial and services activities are strengthened in face of a decline in the importance of the primary. In addition to testing the general hypothesis of "outsourcing of the economy", in our case this result finally evidences an economic structure with reduced opportunities, where increasingly more productive agents tend to become integrated into labor markets, rather than into product markets. The dilemma now is whether the preeminence of paid income as a source of income will benefit or damage these localities in the medium and long term.
A possible explanation of the modification of the rural economic structure could be that the agricultural and livestock activities, particularly agriculture, are performed increasingly more outside rural localities, under "industrial" schemes, while those of this type that remain within these localities are basically for auto-consumption. This situation is visible for Sonora. However, it is not possible to generalize it for the totality of the rural environment.
A reflection with regard to the rural economic structure and its changes, which is linked to the impossibility of generalizing conclusions, is the latent heterogeneity in rural localities. On the one hand, we see localities that invariably modify their structure, corresponding to global changes; localities that maintain the same structure, but even so experience reductions in the primary sectors, and localities that conserve a preponderantly rural structure and even strengthen it. A possible classification would point to the first as "restructured" localities, while the latter would correspond to one of "productive reinforcement". The challenge would be how to classify those that do not experience drastic changes.
The results of the impact scenarios carried out in this research provide timely information about possible opportunity niches that ought to be considered at the time of proposing actions for rural economic promotion. In the same manner, this type of evaluations shows weaknesses, or else, elements without impact, which are valuable if it is considered that the range of the current political strategy of supports to the rural environment in México have not reached the expected effects.
More than the particular data, a general reflection concerning this type of analytical exercises are, first, the availability of punctual information about the rural economy; second, the opportunity for the weighting/valuation of proposals for economic promotion that the analysis applied (simulation exercises) provides to the rural localities.
The design of intervention strategies without prior knowledge of the particularities of the rural economies, less so, without the evaluation of the response capacity of the different agents and productive sectors, is a close guarantee to the failure of the policy, or else, the delivery of public resources in ill-designed enterprises. In this sense, the main conclusion would be to take advantage of this type of methodological tools such as accompanying the design of promotion policies in the rural environment, both in Sonora and in other regions of México and the world.
REFERENCES
Adelman Irma, and Edward Taylor. 2003. Agricultural Household Models: Genesis, Evolution and Extensions. Review of Economics of the Household 1(1):33-58. [ Links ]
Bracamonte, Álvaro. 2001. Análisis de los efectos de políticas económicas en localidades rurales mediante modelos multisectoriales: El caso de El Júpare, Sonora. Tesis Doctoral, Universidad Autónoma Metropolitana, México. Septiembre. [ Links ]
INEGI (Instituto Nacional de Estadística, Geografía e Informática). 2005. II Conteo de Población y Vivienda 2005. Aguascalientes. [ Links ]
Méndez Barrón, Rosana. 2004. Cambios en la estructura económica de una comunidad rural: acercamiento a través del Análisis de Multiplicadores. El caso del Ejido La Victoria, Sonora. Tesis de Maestría en Ciencias Sociales, El Colegio de Sonora. Hermosillo. [ Links ]
Méndez, Rosana. 2011. Luces y Sombras del Desarrollo Rural. Estructura económica e implicaciones de política en cinco localidades rurales de Sonora. Tesis de Doctorado en Ciencias Sociales. El Colegio de Sonora. Hermosillo. [ Links ]
Rosas Monroy, Saúl Francisco. 2000. Impacto de políticas agropecuarias en regiones rurales con base a la aplicación de Modelos Multisectoriales: el caso de Arizpe, Sonora. Tesis de Economía. Departamento de Economía, UNISON. Hermosillo. [ Links ]
Taylor, J. Edward, Antonio Yúnez Naude, Nancy Jesurun-Clements, Eduardo Baumeister, Ana Lisette Amaya, Ramón Canales, Miguel Alemán, y Guy Delmelle 2006. Los Posibles Efectos de la Liberalización Comercial en los Hogares Rurales Centroamericanos a partir de un Modelo Desagregado para la Economía Rural: Caso de Nicaragua. Informe Final de proyecto. BID-SIDA-IDB Partnership Fund, NI-P1017. [ Links ]
Taylor, J. Edward, and I. Adelman. 1996. Village Economies: The Design, Estimation and Use of Villagewide Economic Models. Cambridge University Press. Cambridge. [ Links ]
World Bank. 2009. Análisis del Gasto Público en el Desarrollo Agrícola y Rural. Informe No. 51902-MX. Unidad de Agricultura y Desarrollo Rural, Departamento de Desarrollo Sostenible, Banco Mundial, Región de América Latina y el Caribe Diciembre. México. [ Links ]
Yúnez Naude, Antonio George Dyer Leal, Hazael Cerón, Paul Winters, y Martin Gurria. 2007. Evaluación del impacto del PROCAMPO y propuesta de reformas al sistema de apoyos agropecuarios. Report to the Inter American Development Bank. [ Links ]
Yúnez Naude, Antonio, y Edward Taylor. 1999. Manual para la elaboración de matrices de contabilidad social con base en encuestas socioeconómicas aplicadas a pequeñas poblaciones rurales. Documento de trabajo. Centro de Estudios Económicos, El Colegio de México. México. [ Links ]
1 Bracamonte (2001) points out that the decline of the agricultural and livestock sector in past decades accentuated the deterioration of these localities, and that the strategies of productive reactivation and development have not had the success expected; on the contrary, the distance between urban and rural inhabitants has increased.
2 Relatively little is known currently about determinants of rural income, for it is still assumed that the rural localities are traditionally agricultural; much less is known about their effects on agricultural production and the economy in general. This heterogeneity in the rural income is a central variable in the analysis of rural development, especially from the economic perspective.
3 In the new approach towards rural development, households play a central role, due to their structural features: a) they are characterized by heterogeneous control of their assets: they possess various sources of income (multisectoral and of different geographical origin), which are complementary in their use; b) they control private and public information, so they are local institutions with influence; c) they apply individual and collective strategies, stemming from the circumstances and the context; and d) in absence of competitive markets, they supply goods and services for their own consumption (auto-consumption).
4 These models allow capturing the rural economy from the agents themselves — producers, agricultural workers, day laborers, and peasants, who are the land-owners —, whether as production units or social organizations. In the search for an explanation, this led to deriving into a model where the decisions of production and consumption are connected, that is, the decision unit — household — is at the same time producer and consumer (Adelman and Taylor; 2003).
5 It was originally developed by Stone (1978) to adapt and reconcile the production accounts and national income when analyzing the Input-Product (Méndez, 2004).
6 Estimating the multipliers stems from the assumption of unused capacity of the productive units; constant yields in scale; fixed prices of factors and products; production functions, of linear and fixed proportions; and average and marginal propensities at equal expenditure. Given this, all the income elasticities are unitary.
7 In addition to the Multiplier Analysis (MM), another example of MMs is the Applied General Equilibrium Model (AGEM). For more information about these other multisectoral models, see Bracamonte (2001), Yunez et al. (2007), Taylor et al. (1996, 2006).
8 The fact that a "Panel type" survey was applied implies that the same households were interviewed in each one of the periods. This strategy allowed inquiring with certainty about the changes in rural income and expenditures.
9 For greater detail about the characteristics of the survey, field collection and other aspects related to the methodology and the information recompilation/integration process, see Méndez (2011).
10 The questionnaire gathers the flows of income received by members of the locality, as well as their expenses and relationships with the exterior. Its effective application allows extracting key and reliable information, which will generate more significant economic indicators.
11 To understand more about questionnaires applied to rural communities, consult Yúnez and Taylor (1999). Examples from surveys with these characteristics applied to localities in Sonora can also be found in Rosas (2000), Bracamonte (2001) and Méndez (2004 and 2011).
12 In most of the localities, these activities are centered primarily in livestock breeding (mostly cattle), as well as the production of their byproducts (milk and cheese, primarily), which are sold in the local businesses or else to the households in the locality (Méndez, 2011).
13 In addition, those commercial activities carried out by the households are considered: selling gifts, clothes, stationary, as well as preparing and selling food.
14 The account of Production Factors refers to those elements that allow the development of the productive activities mentioned before, such as land, work (paid and family), and capital. In their turn, in the Capital Account, the savings flows that different types of households carry out in the locality are included, whether physical (PA) and human (HA). Finally, in the external accounts the transactions performed between the internal and external sectors from the accounts of rest of the region (RDR), rest of México (RDM), and rest of the world (ROW), are contemplated. In these, the sales and purchases of products (exports-imports) are recorded, and the flows of remittances received.
15 It must be mentioned that in terms of comparison of the data, the results were deflacted, using the Consumer Price Indexes (CPI), to work in the end with the prices from a single year (2007).
16 The composition of the PLB seen for the localities individually is similar to the one observed in the aggregate rural SAM (5 localities in total) for 4 of the 5 localities; only one of them shows a predominance of the primary activities. For greater detain about the results per locality, see Méndez (2011).
17 From the rest of the households whose income depends on paid work, HI&C and HJ, the first slightly exceed 23 thousand pesos in 2002 to more than 32 thousand annually in 2007; the second, as in the HB&S, also increase their income per capita, earning 13 690 pesos annually in 2007 (slightly over 13 thousand pesos annually were captured in 2002).
18 A reason for this reduction is the decrease in the presence of agricultural/livestock activities in the economic structure, which constitute the main source of income in these households; in addition, they are the ones that capture the least income in 2007.
19 This could be due to diverse circumstances: low in remittances because of parity movements, crises, or else from delays in the allotment of supports due to changes in the public instances in charge of their allotment.
21 Taylor et al. (2006) point out that within the Special Concurring Program (Programa Especial Concurrente, PEC) — main instrument in the current support policy for the rural environment — there are objectives that are perhaps being duplicated, which could cause coordination problems between the executing entities and the unnecessary waste of resources.
22 Most of the subsidies were created independently ones from others due to the circumstances at the moment, and once introduced have been difficult to eliminate. The resulting system is complex and ill-oriented, because there is not a well-defined long-term strategy or a socioeconomic foundation manifested (World Bank, 2009).
23 Firstly, the groups that constitute the endogenous accounts were determined — influenced by the internal structure of the economy, that is, the productive factors, the institutions (households and companies), and the economic activities — and the exogenous — exterior influence (whether regional, national or international). Making this the classification for the SAMra in Sonora, the endogenous accounts will correspond to the factors of production, land, capital, paid work and family work; to the different types of households, and finally to the diverse productive activities, Agriculture and livestock production, Other productive activities (OPA), and Trade and services. Finally, the government accounts, capital and external, are constituted as exogenous.
24 Only four of the aspects of the PEC were taken into account: competitiveness, social, financial, and labor. Of these, the social one is not contemplated within the classification of the agricultural/livestock economic policy, but rather is included, for obvious reasons, in the section of social and human policy.
Received: July 2014; Accepted: May 2016
 Este es un artículo publicado en acceso abierto bajo una licencia Creative Commons
