Introduction
Lithium-containing ceramics find various technological applications such as tritium breeding materials [1-3], ionic conductors in the fabrication of solid electrolytes, separators and cathode materials for Li-ion batteries [4-7]. Other technological applications are the fabrication of phosphors [8,9], catalysts [10,11] and sorbents for the selective CO2 capture [12,13]. Among these ceramics, different polymorphs of lithium monoaluminate (α-, β- and (-LiAlO2) have been the subject of several studies [14-25]. For example, LiAlO2 has been reported as a good candidate as host matrix for neutron scintillators [14,15], as electrolyte matrix in molten carbonate fuel cells [16-19], as well as a candidate for certain luminescent devices [20,21] and heterogeneous catalyst for biodiesel production, [25] among others.
Specifically, (-LiAlO2 has been synthesized by the conventional solid-state reaction method [25-27]. However, the well-known limitations attributed to this technique are evident from the point of view of the low control on the particle sizes, low specific surface area values and the crystallization of secondary phases as impurities, among others. The aforesaid issues are matter of study since the improvement of these powders’ characteristics can be valuable to expand the scope of novel applications of (-LiAlO2.
In this sense, different chemical synthesis pathways have been studied to obtain (-LiAlO2 ultrafine powders exhibiting the desirable textural and morphological features for specific uses. Some of these synthesis routes include hydrothermal [23], sol-gel [20,27], and combustion related techniques [28]. Citrate precursor is a modified sol-gel process, which also involves a combustion stage for the chemical synthesis of fine ceramic oxide powders [29-31]. Briefly, this method is based on the formation of metal complexes by using citric acid as chelating agent. The precursor solution, resulting from metal nitrates and citric acid, gives place to a highly viscous gel formed by solvent evaporation. After gelation and drying, the gel is heated, and the so-called self-ignition process occurs to calcine the organic constituents with the consequently oxide particles formation [29]. The homogeneity and stability of the gel precursor is crucial to avoid segregation and precipitation of undesirable metal-containing species and therefore to guarantee the purity of the final products. Numerous variatns of the citrate method involve the use of alternative chelating agents for the formation of stable metal-chelate species [31]. For example, ethylene-diamine-tetra-acetic acid (EDTA) is a complexing agent with four carboxylate groups that provides to the molecules a higher capability to bind almost any cation in a wider range of pH than that presented by the citric acid [29]. Despite the EDTA-citrate precursor method is a promising pathway to produce LiAlO2 particles at relative low temperatures, there isn’t a detailed discussion about this specific synthesis approach for the preparation of LiAlO2 oxides. Therefore, the aim of this work was to systematically study the preparation of pure and crystalline (-LiAlO2 powders by EDTA-citrate complexing approach, investigating the thermochemical behavior of the metallic EDTA-citrate precursors towards the formation of the (-LiAlO2 powder as well as to establish the effect of the synthesis route on both, the structural and microstructural characteristics of the resultant material.
Experimental
Synthesis of materials
LiAlO2 was synthesized by the combined EDTA-Citrate complexing method. Firstly, stoichiometric amounts of the corresponding metal nitrates, i.e., lithium nitrate anhydrous (LiNO3 99.0%, Alfa-Aesar) and aluminum nitrate nonahydrated (Al(NO3)3∙9H2O 98%, Sigma-Aldrich) were dissolved in deionized water. The solution was heated to 70 °C and stirred during 1 h. Anhydrous citric acid (C6H8O7 99.98%, Sigma-Aldrich) and EDTA (C10H16N2O8 98.5%, Sigma-Aldrich) were separately dissolved in an ammonium hydroxide dissolution (NH4OH 28-30%, Sigma-Aldrich), controlling the pH value at around 9. Then, these two solutions were heated to 70 °C under stirring and subsequently dropped simultaneously to the aqueous metal nitrates-containing solution. The pH of the resultant solution was monitored and keep at around 9 by dropping an excess of aqueous ammonia solution. The molar ratio was 1:1:1.5 for metal cations: citric acid: EDTA. A transparent solution was obtained and subsequently heated to 90 °C, while it was stirred. After water evaporation, a viscous gel was obtained.
The synthesis conditions above mentioned were established with based on the construction and analysis of the chemical equilibrium diagrams by using the Hydra-Medusa software [35].
Then, the gel was heated to 300 °C to remove organic compounds. The gel burns itself on a hot plate because of the exothermic nature of this process. After calcination processes, the as-burnt sample was a dark grey powder, which was separated in four sets and subsequently calcined at 600, 700, 800 and 900 °C for 10 h. Calcination temperatures were established based on the TG-DT analysis.
Materials characterization
Firstly, the gel sample was analyzed by simultaneous thermogravimetric (TG) and differential thermal analyses (DTA). Then, gel and calcined samples were characterized by X-ray diffraction (XRD), scanning (SEM) and transmission (TEM) electron microscopies, as well as N2 adsorption-desorption measurements.
Simultaneous TG-DT analyses were performed to determine the evolution of the chemical reaction during the synthesis of the LiAlO2 powders. Those experiments were made on a simultaneous thermal analyzer instrument model STA 2500 Regulus of Netzsch. For these purposes, the gel samples were dynamically heated from 30 to 700 °C at 5 °C min-1, using a flow rate of 60 mL∙min-1 of dried air.
FT-IR spectra were recorded by using a Bruker Alpha spectrometer equipped with an ATR module. A diffractometer (Bruker, D8 Advance) with Cu-Kα (1.54059 Å) radiation source operating at 34 kV and 30 mA was used to identify the crystalline phases after the different thermal treatments. Samples were measured in a 2-theta range of 20-120 ° with a step size of 0.02°. Crystalline phases were identified using the Joint Committee Powder Diffraction Standards (JCPDS) data base. Moreover, a detailed structural analysis of the synthesized materials was performed by XRD. Crystalline structures were refined with the Rietveld method by using the BGMN program [32] and the graphical interface Profex [33]. Peak profiles were modeled with a Lorentzian function to determine the crystal size anisotropy using the Debye-Scherrer formula [34] and spherical harmonics as base functions to model the reflection width parameters, as a function of the reflection Miller indices.
The powder average particle size and morphology were analyzed using scanning and transmission electron microscopies. SEM analysis was performed on a JEOL JMS-7600F and the TEM images were obtained on a JEOL JEM 1200EX. Electron diffraction analysis was obtained, and the interplanar distances (d) were obtained using dR=λL equation; where, R is the radius of the rings of the diffraction pattern, L the constant of the camera (100 cm) and λ is the wavelength (0.0034 Å-120 V).
Moreover, textural features of the samples, including specific surface area, were estimated by nitrogen adsorption-desorption measurements. The nitrogen adsorption-desorption isotherms of the LiAlO2 powders heat-treated at different temperatures were obtained on a Bel-Japan Minisorp II instrument at 77 K using a multipoint technique (N2 from Praxair, grade 4.8). Prior to this analysis, each sample was degassed at room temperature for 24 h in vacuum. The surface area was determined using the Brunauer-Emmett-Teller (BET) model.
Results and discussion
Chemistry of the gel precursor
As mentioned in the introduction section, the goal of the EDTA-citrate complexing method is to control the oxide phase formation starting from a homogeneous aqueous phase, wherein the chelating agents modify the aqueous hydrolysis chemistry of the involved metal ions (Li+ and Al3+) to form stable metal complexes and subsequently give place to a stable gel precursor. Then, as the first stage of the synthesis is related to the precursor chemistry (from the point of view of the involved metal cations) as well as the complexes formation reactions in terms of pH and chelating agents’ concentration among other variables; the construction and analysis of the chemical equilibrium diagrams is an important source of information. Therefore, the equilibrium diagrams were constructed by using the Hydra-Medusa software [35]. Fig. 1 shows the chemical species in the studied system, considering pH range values from 2 to 14. The concentrations of the Li+, Al3+, citrate (cit3-) and EDTA4- are 100, 100, 200 and 300 mM respectively, where the latest agrees with the correspondent molar ratio of 1:1:1.5 for metal cations: citric acid: EDTA experimentally studied. Fig. 1(A) shows the distribution of ionic lithium containing species. Briefly, at pH values at around 9, the concentration of the different species is as follows: [Li(Cit)2-] > [Li(EDTA)3-] > [Li+]. On the other hand, Fig. 1(B) shows the distribution of aluminum containing ionic species. In this case, complexes are mainly formed with the EDTA, and the concentration of the different species is as follows: [Al(EDTA)OH2-] > [Al(EDTA)(OH)2 3-] > [Al(EDTA)-]. In this case; at the pH of 9, aluminum cations are hydroxylated as Al(OH)3, where it is less prone to form complexes with the citric acid.
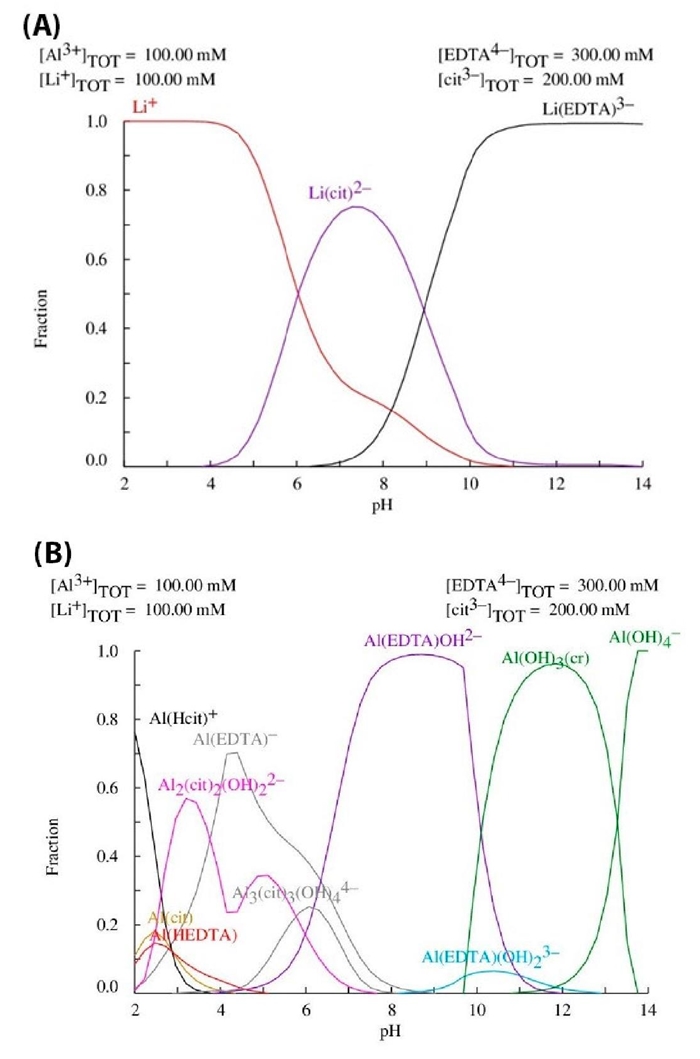
Fig. 1 Distribution diagrams of metal ions containing species among EDTA and citrate complexes as a function of pH: (A) lithium cations and (B) aluminum cations.
Based on the gel precursor chemical composition and considering the basic complexation theory of EDTA and citrate [36,37], the possible formation of different species could be taking place as follows (reactions 1-5).
It should be noticed that equilibrium diagrams show that when the pH decreases below 9 the formation of complexes involving lithium is less effective, giving place to the presence of free metal ions (Li+) in the resulting co-ordination solution. On the contrary, if the pH increases beyond ~9.6, aluminum tends to form Al(OH)3 precipitates. Therefore, equilibrium diagrams point out that pH about 9 promotes the formation of a stable and compositional homogeneous gel precursor.
Formation of complexing precursor
The presence of the different species in the gel precursor was characterized by FT-IR spectroscopy. Fig. 2 shows the spectrum of the obtained fresh gel (before self-combustion). As expected, the FT-IR spectrum indicates the presence of hydroxyl groups with vibration bands at 3423 and 3181 cm-1, which can be assigned to the stemming from carboxyl species and water [38-40]. Moreover, the vibration band at 1616 cm-1 and the small vibration band around 1385 cm-1 are due to vending vibrations of the molecular water and the nitrates in the precursor, respectively.
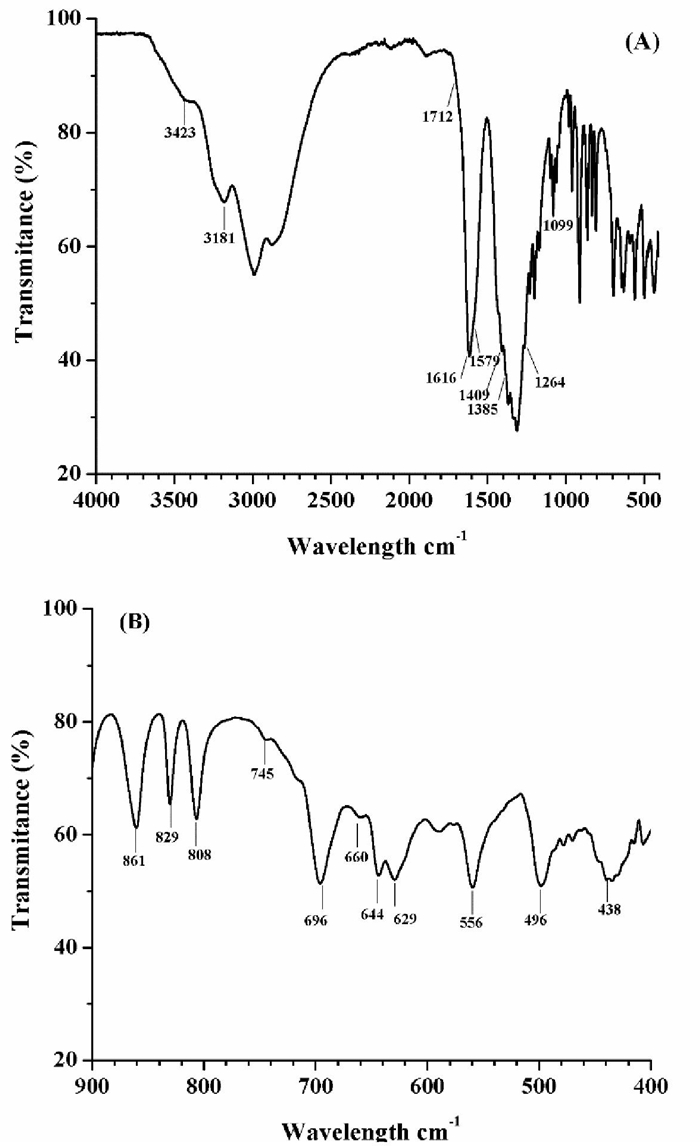
Fig. 2 FT-IR spectrum for the fresh gel precursor (before self-combustion stage): (A) whole spectrum range from 400-4000 cm-1 and (B) spectrum range from 400-900 cm-1.
Different to the vibration bands of the carboxyl groups for both the free citric acid (CA) and the free EDTA, which have been reported to occur in the range from 1650 and 1800 cm-1[41]; this spectrum shows those carboxyl vibration bands situated at 1409 and 1579 cm1 assigned to the vibration of the coordinated carboxyl groups from the complexing agents (CA and EDTA), but after chelating with the metal ions. This behavior has been reported for the case of complexes formed between CA and EDTA with Y3+ and Li+[38, 41]. Actually, according to the reported data different to the free carboxylic group; the metal ions complexing formation results in a difference between the asymmetric νa COO- and symmetric νs COO- stretching vibrations of about 178 cm-1. Here, Δν is 170 cm-1 in agreement with the Kakihana`s criteria [42, 38]. Moreover, the small shoulder observed at 1712 and the vibration band centered at 1264 cm-1 have been reported due to the Li/CA complex formations [42]. Specifically, the latter appears when CA-carboxyl acts as a monodentate ligand with lithium and it is assigned to the νs of the COO- group. Moreover, the vibration bands at 1409 and 1099 cm-1 are due to νs (C-O) and νa (C-N) bonds after Al/EDTA complexing [40].
Considering the stability constants for the complex formation the distinctly higher value for Al3+/EDTA constant (log K =16.1) in comparison with the Al3+/AC system (log K =11.7), make a complexation of this cation with EDTA most likely [36]. In the Li+ cation case; the complex formation has a value of log K=2.79 enabling the complex formation. However, there were not found, in literature, additional information regarding the Li+/AC system. All these results not only support the information displayed in the constructed equilibrium diagrams, wherein it is suggested the initial formation of Li/CA and Li/EDTA species and the preferential formation of Al/EDTA complexes, proving that chelation takes place successfully by the combined EDTA-citrate complexing method. This is particularly important from the point of view that the conversion of the gel precursor to the oxide phase still involves a calcining stage, and therefore the obtaining of an organic matrix wherein the metal complexes are distributed ensuring the chemical homogeneity of the system at atomic scale for obtaining of the pure oxide phase and fine particles [31]. Further, FT-IR analysis reveals several vibration bands in the range from 400-900 cm-1, which may be identified to the Al-O and Li-O vibrations in the structural groups AlO6, LiO6, AlO4 and LiO4 of different lithium aluminate species [43-46]. Specifically, vibration bands at 556, 660 and 808 cm-1 indicate the presence of (-LiAlO2[43-45], while vibration bands at 438, 496, 629 and 696 cm-1 can be assigned to LiAl5O8. Therefore, FT-IR analysis reveals the presence of M-O binding in the precursor. Finally, the vibration band at 745 cm-1 can be attributed to the presence of aluminum hydroxide.
Thermal behavior of complexing precursor
The evolution of the gel sample towards the formation of (-LiAlO2 was analyzed by TG-DTA. Fig. 3 shows the obtained thermograms, exhibiting a thermal multi-stage decomposition (TG) behavior of the incipient dried gel with the corresponding endo and exothermic (DT) processes. Thermogravimetric results reveal a small mass loss of about 3.5 wt% between 40 and 140 °C. Due to the temperature range, this fact was attributed to lost of moisture in the sample. Then, a second mass loss of about 34 wt% occurs between 140 and 305 ºC. This weight loss is accompanied by an endothermic peak at 192 °C (DTA curve) caused by the removal of the compositional water and other solvents (such as NH4OH) trapped in the gel. Subsequently, a third mass loss of 8.5 wt% takes place from 305 to 412 °C suggesting the beginning of the organic precursor decomposition; as well as remained nitrates; this third mass loss correspond to a small exothermic peak at 360 ºC (DTA curve). The thermogram profile is certainly complex and shows that stable intermediates are not formed. Finally, there is also another abrupt weight loss of about 23 wt% in the temperature range of 412-560 ºC; simultaneously, an exothermic peak (DTA curve) appears at 503 °C, which must correspond to the decomposition of the residual organic compounds by combustion. There are no additional weight changes nor heat flow events beyond 560 °C. Therefore, at this temperature, the residual sample is the oxide material.
Formation and characterization of lithium aluminate powders
After the thermal analysis, XRD was conducted to elucidate the effect of calcination temperature during LiAlO2 formation. Actually, lithium monoaluminate has different polymorphic phases and the pathway of crystallization may show differences regarding the synthesis route and precursors [47,48]. Fig. 4 shows the XRD patterns of all the heat-treated samples from 600 to 900 °C, where the initial temperature was based on the thermal analysis. The XRD pattern of the as-burnt sample was included for comparison purposes.
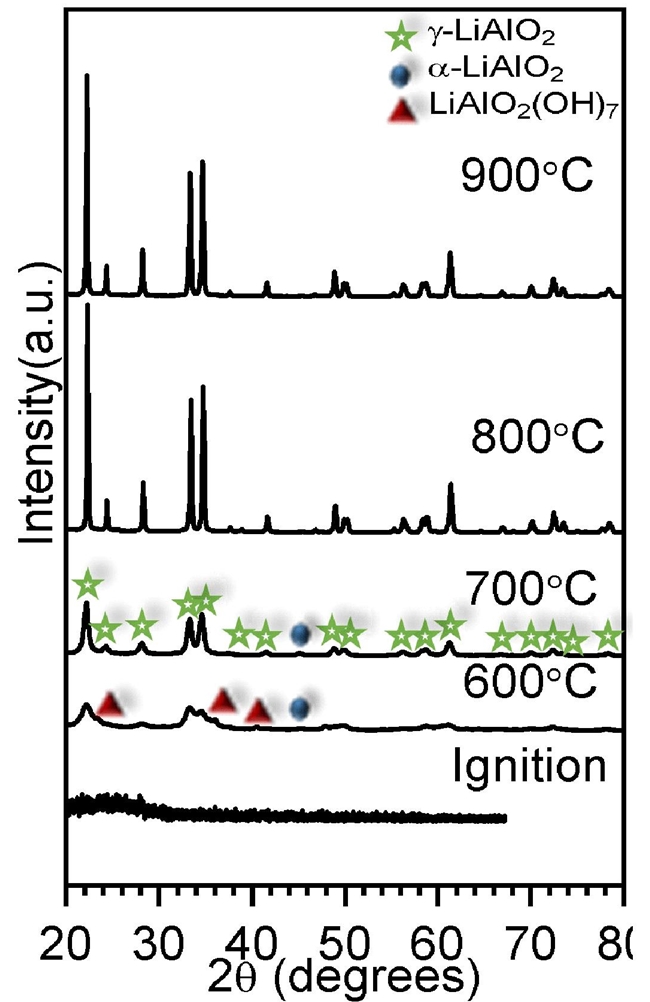
Fig. 4 XRD patterns of calcined materials between 600 and 900 °C. The as-burnt sample was included for comparison purposes (ignition).
In Fig. 4, XRD analysis of the as-burnt sample shows an amorphous phase; and according with TG-DTA results, the presence of the well crystallized oxide phases free of organics was evidenced only in the samples heat treated at high temperatures. However, it is important to have in mind that FT-IR analyses evidenced the obtaining of species containing M-O binding, even before calcining. Moreover, at 600 and 700 °C the XRD patterns evidenced the formation of (-LiAlO2 (JCPDS # 38-1464) with lithium aluminum hydroxide hydrated (LiAl2(OH)7(H2O) and α-LiAlO2, as minority secondary phases. These observed secondary phases were identified with the JCPDS 40-0710 and 74-2232 files respectively. Of course, the presence of LiAl2(OH)7(H2O must have been produced by a hydroxylation process produced during the environmental sample exposition. The pure (-LiAlO2 phase is obtained at temperatures above 700 ºC. Hence, it is clear that there is change on the XRD patterns profile as a function of temperature (peak broadening decreased as temperature increased), where the (-LiAlO2 crystal size increases. Therefore, to further analyze these samples by XRD, heat-treated samples were refined by the Rietveld method. Fig. 5 shows the Rietveld refinement results obtained for the four heat-treated samples, where (-LiAlO2 or mixtures of α -LiAlO2, (-LiAlO2 and LiAl2(OH)7 were modeled. All the initial crystallographic data was available in previous reports [49-51]. In all cases, Rietveld analyses fitted very well with the corresponding sample.
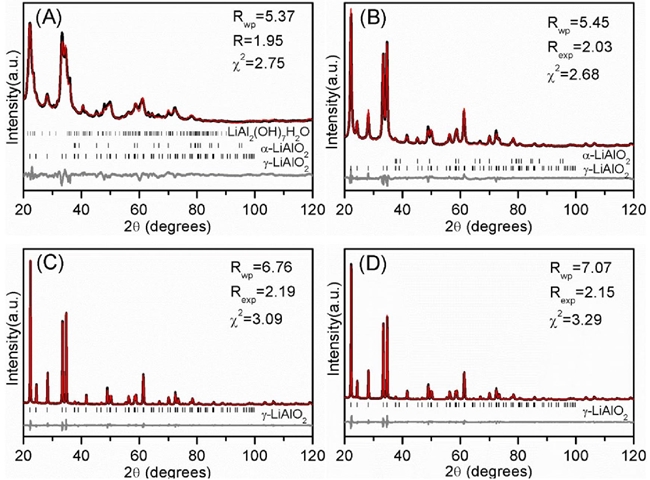
Fig. 5 XRD Rietveld analysis of samples calcined at different temperatures (A)600, (B) 700, (C) 800 and (D) 900 °C. The continuous black lines are experimental data and red superposed lines are calculated patterns. At the bottom of each diagram, the difference between experimental and calculated points is shown (gray). Vertical marks are the Bragg positions for different crystalline phases.
Table 1 shows the final (-LiAlO2 lattice parameters obtained as a function of temperature, where Li and Al positions were refined on x, due to their crystallographic symmetry. As it can be seen, at 700 °C and higher temperatures, none of the lattice parameters presented significant variations, demonstrating the high (-LiAlO2 structural stability as a function of temperature, which is an important feature on the nanoparticles synthesis.
Table 1 (-LiAlO2 lattice parameters and atom coordinates Alx, Lix, Ox,y,z as a function of sample annealing temperature.
T(°C) |
a (nm) |
c (nm) |
Alx (fracc.) |
Lix (fracc.) |
Ox (fracc.) |
Oy (fracc.) |
Oz (fracc.) |
600 |
0.5177(3) |
0.6273(4) |
0.1677(7) |
-0.227(3) |
0.206(1) |
-0.179(1) |
0.0316(7) |
700 |
0.5190(2) |
0.6301(2) |
0.1726(2) |
-0.173(1) |
0.2122(4) |
-0.1694(4) |
0.0201(3) |
800 |
0.51790(6) |
0.62910(7) |
0.1755(1) |
-0.1843(7) |
0.2108(2) |
-0.1639(3) |
0.0224(2) |
900 |
0.51810(6) |
0.62997(8) |
0.1756(2) |
-0.1861(8) |
0.2102(2) |
-0.1635(6) |
0.0223(2) |
As a part of the Rietveld analysis, phase concentration percentages and crystal sizes were determined as a function of the annealing temperature. In the first case, the phase concentration analysis confirmed that γ-LiAlO2 was obtained pure at temperatures equal or higher than 700 °C, and at lower temperatures α-LiAlO2 and lithium aluminum hydroxide were presented as secondary phases (Table 2). In the other case, (-LiAlO2 crystal size was determined using different crystallographic planes, where all of them showed homogeneous crystal growths, in other words, it was obtained equiaxial crystals (Table 3). While (-LiAlO2 obtained at 600 and 700 °C presented crystal sizes between 6.6 and 16.6 nm, the pure (-LiAlO2, obtained at 800 and 900 °C, presented crystal sizes of around 110 nm. Moreover, the crystal size did not really evidence an important growth when (-LiAlO2 was calcined at 800 or 900 °C.
Table 2 Phase concentration (wt%) as a function of sample annealing temperature.
T (°C) |
ϒ -LiAlO2 |
α-LiAlO2 |
LiAl2(OH)7●H2O |
600 |
78.8(5) |
5.4(2) |
15.8(5) |
700 |
96.62(9) |
3.38(9) |
0 |
800 |
100 |
0 |
0 |
900 |
100 |
0 |
0 |
Table 3 (-LiAlO2 average crystal size in different crystallographic directions, as a function of sample annealing temperature.
T(°C) |
Crystal size (nm) |
||
(200) |
(012) |
(111) |
|
600 |
6.6(2) |
8.1(2) |
7.0(1) |
700 |
16.6(1) |
16.6(1) |
16.61(8) |
800 |
110(3) |
115(4) |
111(7) |
900 |
107(3) |
113(5) |
110(2) |
In addition to the structural characterization, the four samples were microstructurally analyzed by N2 adsorption-desorption and SEM techniques. The N2 adsorption-desorption isotherms of all (-LiAlO2 samples presented isotherms type II, corresponding to non-porous materials [52], where the whole N2 volume adsorptions decreased as a function of temperature (Fig. 6). Moreover, isotherms obtained from samples treated at 600 and 700 °C presented a very narrow H3 hysteresis loops. In these cases, hysteresis must be associated to particle agglomeration, instead of porous formation. Based on previous results, specific surface area was determined by the BET model, obtaining values of 72.5, 38.7, 5.4 and 3.1 m2 g-1 for the samples heat treated at 600, 700, 800 and 900 °C, respectively.
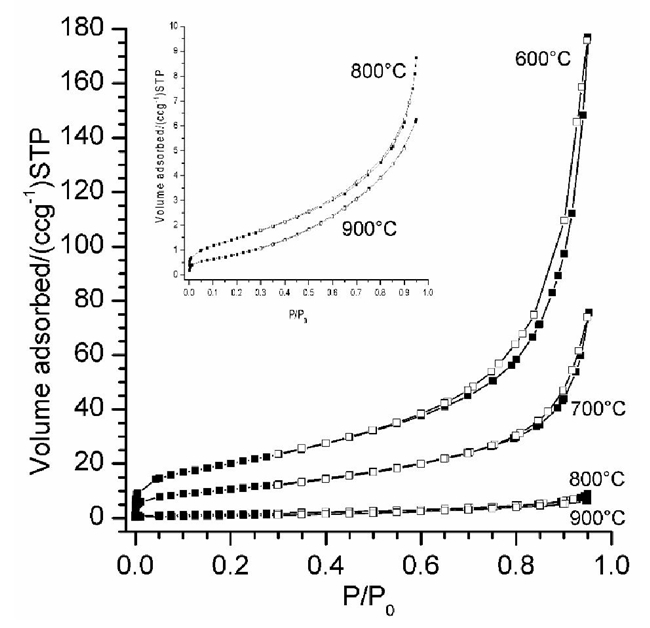
Fig. 6 N2 adsorption-desorption isotherms of (-LiAlO2 powders calcined at different temperatures. All N2 adsorption-desorption curves presented isotherms type II, corresponding to non-porous materials. The square inset shows an amplification of the N2 adsorption-desorption isotherms obtained for the samples calcined at 800 and 900 °C.
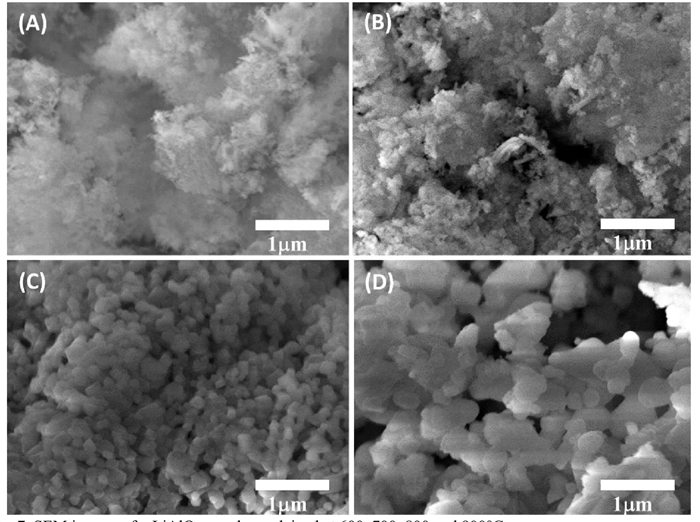
Fig. 7 shows the secondary electron images of (-LiAlO2 samples thermally treated at different temperatures, where it can be seen an important morphological evolution. In the (-LiAlO2 samples treated at 600 and 700 °C (Figures 7(A) and (B), respectively) it can be observed the presence of large agglomerates formed by nanometric particles, where their ultimate particle sizes cannot be resolute. In these cases, only non-homogeneous surfaces can be described; although (-LiAlO2 sample treated at 700 °C (Fig. 7(B)) seemed to present a denser particle arrangement. On the contrary, secondary electron images of (-LiAlO2 samples treated at 800 and 900 °C (Figures 7(C) and (D)) clearly defined their morphological characteristics. (-LiAlO2 sample treated at 800 °C (Fig. 7(C)) presented polygonal particles of 160 nm in average, while sample treated at 900 °C (Fig.7(D)) presented larger particles (250 nm). From these images, it is evident that (-LiAlO2 sample morphology remarkably changed as a function of temperature, as the particle sizes growth from a few nanometers at 600 °C to 250 nm at 900 °C. Hence, microstructural analyses (specific surface area and particle size) varied as a function of temperature, as it could be expected. All these results are in good agreement, indirectly, to crystal size growth determined by Rietveld.
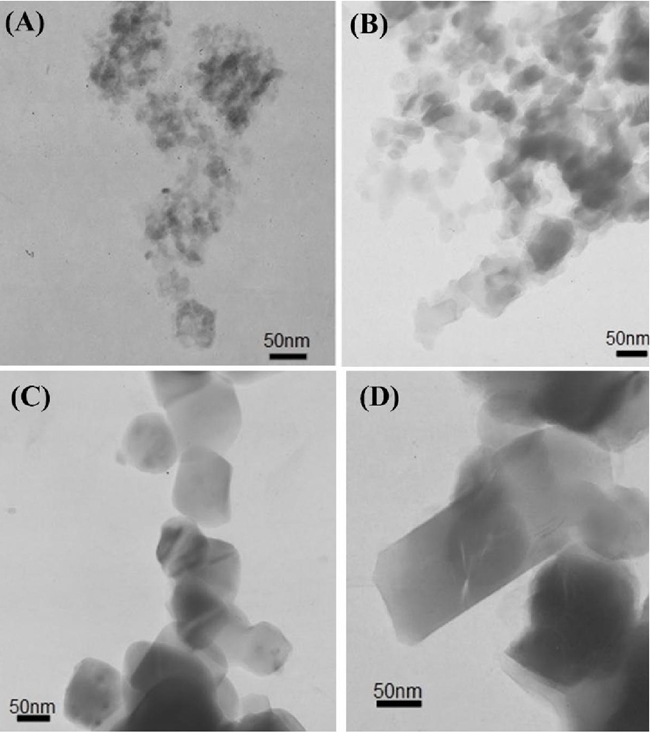
In order to deeply analyze the (-LiAlO2 characterization, a transmission electron microscopy analysis was performed on all of these samples. Fig. 8 shows bright-field images of (-LiAlO2 samples, where samples presented an important evolution as a function of temperature, as in the scanning electron microscopy analysis. (-LiAlO2 sample treated at 600 °C (Fig. 8(A)) shows very tiny particles of around 5 nm. In fact, particle size growth as a function of the (-LiAlO2 annealing process, from around 25 nm to 120-150 nm at 700 and 900 °C, respectively. This systematic growth is in very good agreement with crystal size evolution determined by Rietveld analysis (see Table 3). Moreover, this result suggests that the observed ultimate nanoparticles are single crystals.
Finally, TEM and XRD results were correlated by the electron diffraction pattern of (-LiAlO2 sample heat-treated at 900 °C. Fig. 9 and Table 4 show the interplanar distances measured from the electron diffraction ([ 1 11] zone of (-LiAlO2) and XRD Rietveld analysis, where both analyses show an excellent agreement. All these results demonstrate that (-LiAlO2 synthesis by the EDTA-citrate complexing method can produce pure and crystalline nanoparticles, which would be of interest in different applications that demand phase purity and particle size control.
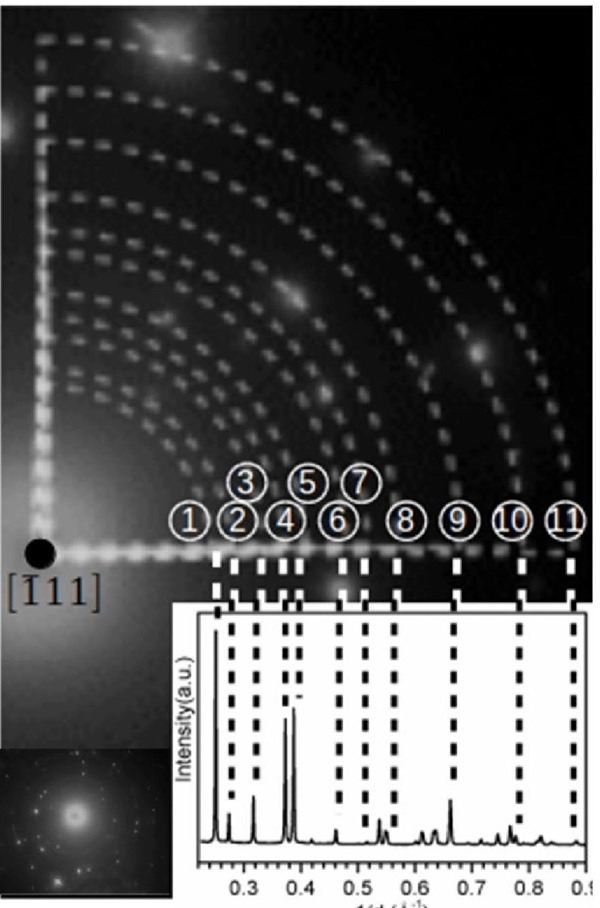
Fig. 9 Correlation between electron diffraction pattern, obtained by TEM, and XRD pattern of the pure □-LiAlO2 sample heat-treated at 900 °C.
Table 4 Interplanar distances obtained from XRD-Rietveld and TEM analyses for (-LiAlO2 heat-treated at 900 °C.
Peak labeled at Fig. 9 |
d obtained by XRD-Rietveld, (Å) |
d obtained by TEM, (Å) |
(hkl) |
1 |
4.002 |
4.002 |
101 |
2 |
3.663 |
3.602 |
110 |
3 |
3.167 |
3.005 |
111 |
4 |
2.691 |
2.701 |
012 |
5 |
2.590 |
2.513 |
200 |
6 |
2.175 |
2.161 |
211 |
7 |
1.946 |
1.965 |
103 |
8 |
1.759 |
1.757 |
221 |
9 |
1.507 |
1.501 |
104 |
10 |
1.292 |
1.294 |
313 |
11 |
1.139 |
1.137 |
332 |
Conclusion
Gamma lithium aluminate ((-LiAlO2) nanoparticles was successfully synthesized at low temperature by the combined EDTA-citrate complexing method. Using a gel precursor analysis performed by chemical speciation, the synthesis conditions were established. The purity of the (-LiAlO2 phase was determined as 97 % at 700 °C and 100 % over this temperature. By calcination at 700 °C, pure lithium aluminate powders exhibit small crystal size of about 16.6 nm, as well as high specific surface area (38.7 m2g-1). Then, at 800 and 900 °C the average crystal size was around 100 nm. Moreover, analyzing by Rietveld method the XRD patterns of samples heat treated at different temperatures, it was observed that none of the (-LiAlO2 lattice parameters presented important variations, or new phase formation, demonstrating a high (-LiAlO2 structural stability as a function of temperature, which is an important feature on the nanoparticles synthesis. Additionally, (-LiAlO2 can present certain microstructural changes as a function of calcination temperature. SEM analysis showed an increase of particle size in agreement, directly to the crystal size growth determined by Rietveld and TEM. Also, electron diffraction patterns showed an excellent agreement between the XRD and Rietveld results.
Generally speaking, results showed that (-LiAlO2 synthesis by the EDTA-citrate complexing method can produce pure and crystalline nanoparticles of the oxide, wherein the combination of the chelating agents EDTA-citrate helps to the formation of an initial complexing precursor that promotes the further formation of the pure (-LiAlO2 phase without impurities at 700 °C or higher temperatures.


 nueva página del texto (beta)


