


 nueva página del texto (beta)
 Inglés (pdf)
 Artículo en XML
 Referencias del artículo
 Enviar artículo por email
 Citado por SciELO
  Similares en
SciELO
Similares en
SciELO 
 Permalink
Introduction
Kefir grains are a symbiotic group of lactic acid bacteria, acetic acid bacteria, and yeast microorganisms embedded in an exopolysaccharide matrix. Traditionally, these microbial diversities use lactose from milk mainly as a source of carbon. However, external carbon sources to the medium for kefir manufacturing may represent a key role in increasing kefir grain biomass and obtaining biologically active compounds (Gradova et al., 2015; Maeda et al., 2004). For example, selected kefir cultures can synthesize different amounts of exopolysaccharide depending on the carbon source (Gradova et al., 2015). Also, it has been reported that sucrose is the main carbohydrate used by kefir grains to grow in soy milk (Gamba et al., 2020). On the other hand, the recognition of milk as an excellent substrate is due to the high quality and quantity of nutrients. There are reports on the chemical composition differences between cow and goat milk. In the last years, goat milk has gained attention because it has easier digestibility, softer curd formation, a higher proportion of small milk fat globules, and less allergenic properties than cow milk (Clark and Mora García, 2017). Recently, cow milk kefir has demonstrated health benefits such as improving cognitive deficits in Alzheimer’s disease, anticancer, angiotensin-converting enzyme inhibition, and bactericidal and antioxidant activities (Fatahi et al., 2021; Ton et al., 2020). However, traditional kefir production amount is limited by the quantity of kefir grains inoculated. So, using different substrates may be one of the most important strategies to increase kefir grains biomass (Guzel-Seydim et al., 2011). Therefore, this research aimed to study the effect of substrates on the kefir biomass parameters and antioxidant activity of kefir beverages during traditional manufacturing procedures.
Materials and methods
Kefir culture, media, and chemicals
Propagation of Kefir grains, collected from the Central part of Mexico, was done at the laboratory of Food Engineering, Department of Chemical Engineering and Metallurgy, University of Sonora. Purchase of Brown sugar and ultra-high temperature (UHT) skimmed cow milk (containing 3 % protein, 1% fat, 4.7 % carbohydrates, and 0.12 % calcium) was at a local supermarket (Super del Norte, Hermosillo, Mexico), while Nonfat goat milk powder (containing 16 % protein, 0 % fat, and 4 % carbohydrates) was from U.S.A. Analytical grade reagents and chemicals were all from Sigma (St. Louis MO, U.S.A.).
Kefir grains activation
The inactivated kefir grains (432 g) were inoculated into UHT skimmed cow’s milk (750 mL) and incubated at 25 ± 3 °C for 24 h without stirring. The grains were retrieved by sieving and rinsed with distilled water (Kilic et al., 2016). This procedure was repeated for 5 weeks to activate the grains (Demirhan et al., 2013).
Fermentation
To obtain fermented milk by kefir grains, we followed traditional conditions. The activated grains (9.0 ± 0.7 g/L) were inoculated into reconstituted (10 %, p/v) pasteurized goat milk (GM), GM + brown sugar solution (GMBS), UHT skimmed cow milk (CM) and CM + brown sugar solution (CMBS) media. Commercial brown sugar was dissolved in distilled water (50 %, w/v), sterilized, and added at 3 % (v/v). Fermentation was under ambient atmospheric conditions at 25 ± 3 °C using an incubator (G-25, New Brunswick Scientific, NJ, U.S.A.) with constant rotary agitation (100 rpm). Samples were isolated at 0, 4, and 8 h incubation time once they have reached pH 4.6 (Satir and Guzel-Seydim, 2015a).
Biomass production
Kefir grains biomass were separated using a plastic sieve. The filtrated corresponded to the kefir beverage. Kefir beverage samples were frozen at - 80 °C for further analysis (Dermihan et al., 2011). Kefir grains biomass was washed with distilled water and centrifuged (Allegra X-22R, Beckman Culter, Germany) at 2,716 x g for 15 min at 25 °C. The biomass increment (g/L) was quantified gravimetrically by convective thermal drying at 38 °C until constant weight (Papapostolou et al., 2008), and results expressed as g/L. Kefir grains biomass productivity was obtained considering each fermentation time. Specific growth rate (µ) and doubled time parameters were calculated from the following Gompertz equation (TramŠek and GorŠek, 2008):
Where X and X0 are the concentration of kefir grain biomass (g/L) at the beginning of the experiment and at the experimental time (h), respectively. µmax is the maximum specific rate of the culture (h-1), b is a dimensionless parameter, c is a model parameter (h-1) and t is time (h).
Physico-chemical analyses
Total solids (Official Methods of Analysis. Method 925.23.A.O.A.C. International., 2012) and protein (Bradford, 1976) physicochemical analyses were done through kefir fermentation time.
Mathematical modeling of pH
Values of pH (Tarango-Hernández et al., 2015) kefir beverages were monitored during fermentation time through a 5 mL aliquot (Star 3 Orion, Thermo Scientific, Singapore). Experimental pH data was analyzed using a Logistic mathematical model represented by the following equation (Kaptan et al., 2015):
Where pHt is the pH at the experimental time, pHinf is the pH after infinite time, pH0 is the pH at time = 0, k is the lumped specific rate of the reaction (h-1), and t is time (h).
Kefir samples preparation
Kefir beverage samples were centrifuged twice at 15,000 x g for 30 min at 4 °C, (Biofuge Stratos, Sorvall, Germany) to remove fat, and then freeze-dried (Freezone 4.5, U.S.A.) for further analyses, once milled in a mortar and resuspended in distilled water (0.1 %, w/v).
Antioxidant capacity (AC)
Kefir AC was assessed by the 2, 2´-azino-bis (3- ethylbenzothiazoline)-6-sulfonic acid (ABTS) radical (Sigma-Aldrich, St. Louis, MO, U.S.A.) scavenging assay (Re et al., 1999). Water extracts were prepared by centrifuging kefir samples at 9,561 x g for 10 min at 4 °C. ABTS stock solution (7.0 mM) oxidation was in water added with potassium persulfate (2.45 mM; Sigma-Aldrich, St. Louis, MO, U.S.A.) buffer. ABTS•+ was prepared to keep the mixture for 12-16 h at room temperature in the dark, diluted in ethanol (99.9 %) to yield 0.7 ± 0.02 absorbance at 734 nm using a Fluostar spectrophotometer (B.M.G. Labtech, Germany). A 20 µL water extract aliquot was added to 280 µL ABTS•+ solution. After 15 min of the reaction in the dark, we measured kefir antioxidant compounds´ scavenging capacity by decreasing absorbance at the same wavelength. The absorbance of the ethanol ABTS•+ solution without sample was the control; meanwhile, the solvent was the blank. The kefir AC expression was as the percentage of ABTS•+ scavenging according to the following equation:
Statistical analysis
All experiments were repeated three independent times, samples analyzed in triplicate, and all results expressed as the mean value ± standard deviation (SD). Generalized lineal model (GLM) analysis of variance (ANOVA) was used to find differences between means at α = 0.01 significant level. Significant differences between means were determined by the Tuckey-Kramer test (p < 0.01). All statistical analysis was performed using the NCSS 2012 statistical program (NCSS Inc., Kaysville, UT, U.S.A.).
Results and discussion
Antioxidant capacity of kefir beverages
The kefir beverages AC was determined as percentage free ABTS radical scavenging. All beverages´ substrates inoculated by kefir grains presented AC during fermentation time (Figure 1). Goat milk substrates kefirs had the highest AC values; Goat milk brown sugar (GMBSK) and goat milk (GMK) had 44.8 ± 1.4 % and 37.6 ± 3.6 % AC, respectively. In contrast, cow milk brown sugar kefir (CMBSK) had 35.3 ± 1.4 % AC; meanwhile, cow milk substrate kefir (CMK) had 32.1 ± 0.5 % A.C. Both kefir AC values were significantly lower (p < 0.01) than GMBSK at 8 h of fermentation time. Other study found that goat milk inoculated by Limosilactobacillus fermentum presented 17.6 ± 1.3 % AC after 12 h fermentation time (Panchal, Hati, and Sakure, 2019). Yilmaz-Ersan et al. (2016), reported 13.03 ± 0.04 % AC in goat milk inoculated with 5 % (v/w) kefir grains and incubated for 8 h without agitation. Moreover, Satir and Guzel-Seydim (2015) also found significantly higher (p < 0.05) AC values in kefir using goat milk as substrate (6.38 µM Trolox-Equivalent Antioxidant Capacity [TEAC]) than cow milk (5.46 µM TEAC). In fact, they found 14 % higher AC in GMK than in CMK; meanwhile, in this study GMBSK had 13 % higher AC than CMK. They reported that goat milk kefir AC was related to the highest (p < 0.05) fat (5.56 ± 0.13 g/100 g) and protein (4.79 ± 0.38 g/100 g) concentrations. However, in this study goat milk was nonfat; the highest (p < 0.01) protein content (3.19 ± 0.01 g/100 g) at 8 h fermentation time was also found in GMBSK (Table 1). Furthermore, GMBSK data analyses suggested a direct association between protein content reduction and AC percentage increase (correlation coefficient = - 0.96) during fermentation time. Previous reports have suggested that the chemical composition of milk, such as fat, protein (Zulueta et al., 2009), and phenolic compounds (Satir and Guzel-Seydim, 2015), play a key role in the kefir AC. Few differences have been reported between cow and goat milk chemical compositions. Goat milk has a higher proportion of short-medium fatty acids, lack of β-carotene, higher levels of β-casein (CN), and lower levels of αs1-CN, compared with cow milk (Park et al., 2007). Indeed, goat milk casein differs significantly from cow milk casein in peptide chain length and amino acid sequences (Ceballos et al., 2009). However, a significant total phenolic content has been reported to decrease during fermentation and storage (Yilmaz-Ersan et al., 2016).
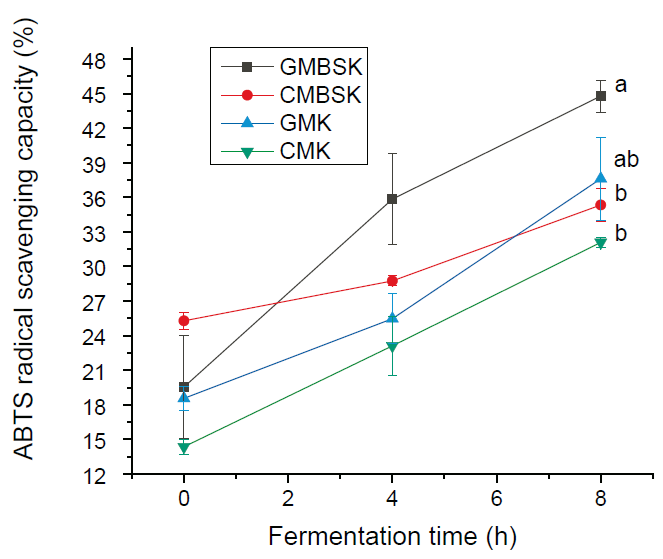
a, b Different superscript letters indicate significant differences (p < 0.01). Data represent the mean values ± SD (n = 3). GMBSK= Goat milk brown sugar kefir; CMBSK= Cow milk brown sugar kefir; GMK= Goat milk kefir; CMK= Cow milk kefir.
Figure 1 Effect of substrates on the antioxidant capacity of kefir beverages.
Figura 1. Efecto de los sustratos en la capacidad
antioxidante del kéfir.
Table 1 Changes in total solids and protein content of kefir beverages during fermentation time.
Tabla 1. Cambios en los contenidos de sólidos totales y
proteína en el kéfir durante el tiempo de fermentación.
| Kefir treatments | |||||
| Fermentation time (h) | GMBSK | CMBSK | GMK | CMK | |
| Protein (g/100g) | 0 | 3.71 ± 0.02b | 3.58 ± 0.01b | 3.96 ± 0.01a | 3.95 ± 0.08a |
| 4 | 3.44 ± 0.02b | 3.31 ± 0.01c | 3.43 ± 0.01b | 3.72 ± 0.00a | |
| 8 | 3.19 ± 0.01a | 2.95 ± 0.01b | 2.97 ± 0.01b | 2.97 ± 0.02b | |
| Total solids (g/100g) | 0 | 6.17 ± 0.70a | 5.95 ± 0.07a | 6.03 ± 0.42a | 5.64 ± 0.37a |
| 4 | 6.64 ± 0.65a | 5.60 ± 0.67a | 5.24 ± 0.13a | 5.91 ± 0.23a | |
| 8 | 6.01 ± 0.43b | 5.70 ± 0.03b | 5.82 ± 0.25b | 7.43 ± 0.27a | |
a, b, c Different superscript letters within a row indicate significant differences (p < 0.01).
Data represent the mean values ± SD (n = 3). GMBSK= Goat milk brown sugar kefir; CMBSK= Cow milk brown sugar kefir; GMK= Goat milk kefir; CMK= Cow milk kefir.
Milk fermentation by kefir microorganisms increased the AC due to their metabolic activity (Liu et al., 2005). Indeed, in this study the maximum AC increase was 130 ± 2.5 %, which was observed in the GMBSK beverage. Studies have demonstrated the ability of these microorganisms to produce secondary metabolites as bioactive compounds (Kaptan, Kayısoglu, and Oksuz, 2015). Previously, the proteomic analysis identified 2,328 peptides belonging to 32 protein entities in goat milk kefir (Izquierdo-González et al., 2019), while more than 1500 peptides were derived from 27 proteins were found in cow milk kefir (Dallas et al., 2016). The highest amount of peptides was released from goat milk β-casein fraction, with 846 peptides (Izquierdo-González et al., 2019). Therefore, kefir microorganisms´ proteolytic activity releases peptides sequences with potential bioactivity such as antioxidant activity (Yilmaz-Ersan et al., 2016).
The addition of brown sugar to milk kefir culture media and its effect on the AC has been scarcely evaluated. Results suggested that brown sugar increased the AC in all treatments. However, the increments were not significantly different (p > 0.01) between substrates with the same type of milk. According to Hsieh et al. (2012), the modification of kefir fermentation media has been associated with remarkable changes in microbial ecological profiles, mainly in lactic acid bacteria and their metabolites.
Kefir grains biomass increase
All substrates increased kefir grains biomass during fermentation time (Figure 2). After 8 h of incubation time, GMK and GMBSK had the highest biomass increments, 147 ± 23 % and 136 ± 7 %, respectively. On the other side, CMK and CMBSK increased 104 ± 3 % and 65 ± 1 %, respectively. Therefore, goat milk substrates kefir also influenced kefir biomass production positively. GMK and CMK had the highest protein content (p < 0.01) at the beginning of the fermentation, 3.96 ± 0.01 g/100 g and 3.95 ± 0.08 g/100 g, respectively (Table 1). A previous study reported that substrates with higher protein content presented the highest biomass increment after 28 days of fermentation (Guzel-Seydim et al., 2011). However, not only the protein content may be related to kefir biomass increment. Indeed, changes in the chemical composition of fermentation media, such as vitamins, minerals, and carbohydrates, may affect the kefir grains metabolism (Demirhan et al., 2013). For example, data suggested that the addition of brown sugar to the medium reduced biomass generation at the end of the fermentation time. Remarkable changes have been reported in microbial ecological profiles of lactic acid bacteria in sugary kefir grains and their filtrates, when brown sugar and goat or cow milk are used as substrates (Hsieh et al., 2012). According to Seydim et al. (2011), nonfat cow milk inoculated with kefir grains (2 %, w/v) and incubated at 25°C for 30 days had a 98.5% biomass increment (Guzel-Seydim et al., 2011). Schoevers & Britz (2003) inoculated milk (20 g/L fat) with kefir grains (2 %, w/v) and fermented at 25°C for 24 h, resulting in a biomass increase of 145 % (Schoevers and Britz, 2003). Kefir grains biomass increase data collected during experimental fermentation time in mathematical modeling. Gompertz model has been demonstrated to accurately describe the classical growth curve and predict an optimal curve of kefir grains (Goršek and Tramšek, 2008). Results from fitting the predictive Gompertz growth model to the experimental data of kefir grains biomass increase in different substrates, are shown in Table 2. The highest maximum growth rate (µmax) and the lowest doubled time values were presented by GMK, 0.101 ± 0.014 h-1, and 6.80 ± 0.9 h, respectively. In contrast, CMBSK had the lowest µmax and the highest doubled time values (p < 0.01) 0.046 ± 0.005 h-1, and 14.90 ± 0.40 h. Therefore, kefir grains biomass growth rate may be affected by cow milk and brown sugar substrates. Goršek and Tramšek (2008) reported µmax = 0.022 ± 0.003 h-1 with full fat cow milk added with glucose (20 g/L), inoculated with kefir grains (75 g/L) and incubated at 24°C for 36 h. Besides, the specific growth rate of lactobacilli species linearly decreased with the increment in sugars in liquid growth media. This effect was associated with the osmotic stress exerted by the sugars on the bacteria (Narendranath and Power, 2005). Several studies have reported the dominance of lactobacilli strains in kefir grains microorganisms (Izquierdo-González et al., 2019; Yilmaz-Ersan et al., 2016). On the other hand, it has been reported that full fat cow milk inoculated (42 g/L) with kefir grains and fermented at 21°C for 89 h presented µmax = 0.042 ± 0.003 h-1 (Zajsek and Gorsefe, 2009). Kefir beverage is traditionally prepared inoculating kefir grains in milk; hence its productivity was also evaluated. Results showed that all substrates presented kefir grains biomass productivity at the end of the fermentation time (Figure 3). GMK had the highest (p < 0.01) kefir grains biomass productivity, 2.49 ± 0.24 g/(L-h), meanwhile CMBSK presented the lowest values (p < 0.01), 1.32 ± 0.02 g/(L-h). Results suggested that the kind of milk and the media chemical composition, such as the addition of brown sugar, may play a key role in the kefir biomass productivity.
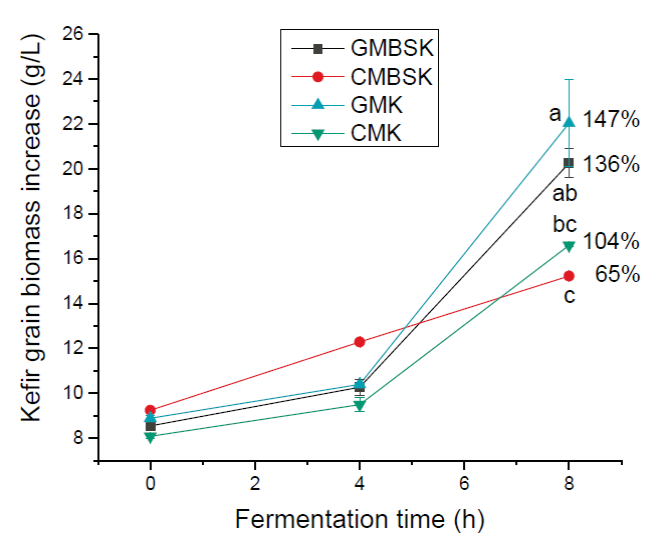
a, b, c Different superscript letters indicate significant differences (p < 0.01). Data represent the mean values ± SD of (n = 3). GMBSK= Goat milk brown sugar kefir; CMBSK= Cow milk brown sugar kefir; GMK= Goat milk kefir; CMK= Cow milk kefir.
Figure 2 Effect of substrate on kefir grain biomass increase.
Figura 2. Efecto de los sustratos en el incremento de
la biomasa de los granos de kéfir.
Table 2 Results from fitting experimental data of kefir grains inoculated in different
substrates to the predictive Gompertz growth model.
Tabla 2. Resultados de la aplicación del modelo
matemático de Gompertz a los datos experimentales derivados de la
inoculación de los granos de kéfir en diferentes sustratos.
| Treatment | Maximum growth rate (µmax, h-1) | Doubled time (h) | R2 |
| GMBSK | 0.082 ± 0.005b | 8.48 ± 0.5a | 0.99 |
| CMBSK | 0.046 ± 0.001c | 14.90 ± 0.4b | 0.99 |
| GMK | 0.101 ± 0.014ab | 6.80 ± 0.9a | 0.99 |
| CMK | 0.095 ± 0.006a | 7.30 ± 0.7a | 0.99 |
a, b, c Different superscript letters within a column indicate significant differences (p < 0.01).
Data represent the mean values ± SD (n = 3). GMBSK= Goat milk brown sugar kefir; CMBSK= Cow milk brown sugar kefir; GMK= Goat milk kefir; CMK= Cow milk kefir.
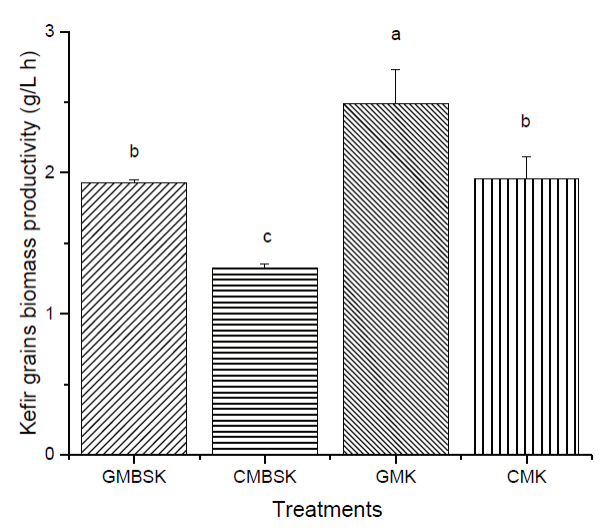
a, b, c Different letters indicate significant differences (p < 0.01). Data represent the mean values ± SD (n = 3). GMBSK= Goat milk brown sugar kefir; CMBSK= Cow milk brown sugar kefir; GMK= Goat milk kefir; CMK= Cow milk kefir.
Figure 3 Effect of substrate on kefir grain biomass productivity.
Figura 3. Efecto del sustrato en la productividad de la
biomasa de los granos de kéfir.
Effect of substrates on pH decrease
Changes in kefir beverages pH associated with substrates were evaluated during fermentation time. Initially, goat and cow milk´s pH values were 6.3 ± 0.1 and 6.6 ± 0.2, respectively. According to the manufacturer’s information, kefir beverage fermentation stops at pH 4.7 (Savastano et al., 2020). This pH value was reached by most of the kefir beverages at 8 h of fermentation time (Figure 4). GMK presented significant lower (p < 0.01) pH values (4.74 ± 0.08) than CMBSK (4.96 ± 0.02). Whole cow milk inoculated with 5 % (w/v) kefir grains from different places, in static conditions, presented a 4.57- 5.27 pH values range after 24 h of fermentation time (Korsak et al., 2015). Kefir grains are constituted by a consortium of symbiotic microorganisms, mainly bacteria such as lactic acid, acetic acid, bifidobacteria, and yeasts with different nutritional requirements (Wawrzyniak et al., 2019). Yeasts’ production of pyruvate, carbon dioxide, propionate, succinate, vitamins, and amino acids stimulates lactic acid bacteria metabolic activity, decreasing pH by generating organic acids (Álvarez-Martín et al., 2008). The pH kinetic values of kefir beverages were mathematically modeled using the Logistic equation (Table 3). There were no statistical differences (p > 0.01) between the lumped specific pH rates. However, GMBSK had the lowest lumped specific pH rate value, 0.033 ± 0.005 h-1, while CMBSK had the highest value, 0.050 ± 0.000 h-1. A previous study reported that skimmed cow milk kefir fermented during 10 h had 0.048 h-1 specific pH rate value. Therefore, kefir beverage´s pH decrease was not clearly affected by kefir substrates.
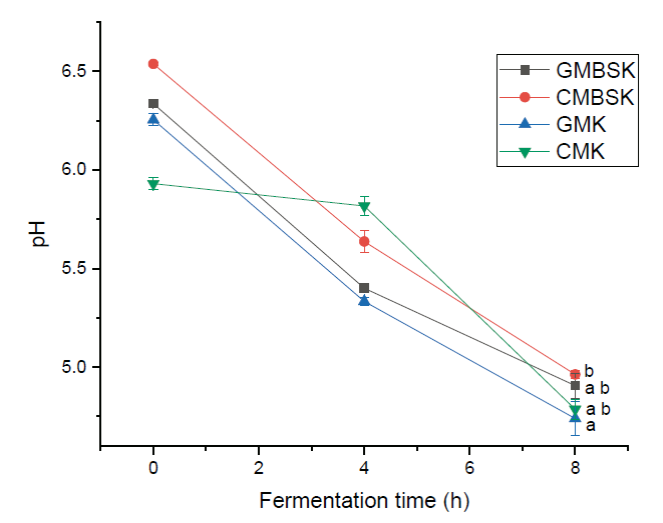
a, b, c Different letters indicate significant differences (p < 0.01). Data represent the mean values ± SD (n = 3). GMBSK= Goat milk brown sugar kefir; CMBSK= Cow milk brown sugar kefir; GMK= Goat milk kefir; CMK= Cow milk kefir.
Figure 4 Effect of substrate on kefir beverages pH.
Figura 4. Efecto del sustrato en el pH del
kéfir.
Table 3 Results from fitting experimental pH data of kefir grains inoculated in different
substrates using Logistic mathematical model.
Tabla 3. Resultados de la aplicación del modelo
matemático Logístico a los datos experimentales de pH derivados de
la inoculación de los granos de kéfir en diferentes
sustratos.
| Treatment | Lumped specific rate of reaction (h-1) | R2 |
| GMBSK | 0.033 ± 0.005a | 0.95 |
| CMBSK | 0.048 ± 0.011a | 0.95 |
| GMK | 0.046 ± 0.018a | 0.94 |
| CMK | 0.050 ± 0.000a | 0.98 |
a, b, c Different superscript letters within a column indicate significant differences (p < 0.01).
Data represent the mean values ± SD (n = 3).
GMBSK= Goat milk brown sugar kefir; CMBSK= Cow milk brown sugar kefir; GMK= Goat milk kefir; CMK= Cow milk kefir.
Conclusions
This study suggests that kefir beverage substrates play a key role in antioxidant activity, pH decrease, and kefir grain biomass increase. Goat milk was the substrate associated with the highest kefir beverage antioxidant activity, and kefir grain biomass productivity. On the other hand, brown sugar substrate significantly reduced the parameters of kefir grains biomass increase. The Gompertz and Logistic models adequately modeled the variation of kefir biomass production and pH kefir beverages variation. Therefore, kefir substrates selection and modeling may be a relevant strategy to increase grains biomass and bioactivity of these beverages and develop a cost-effective bioprocess. Nevertheless, in vivo studies and metabolomic analyses are needed to determine the molecular mechanisms of action of all active substances present in kefir beverages recognized as health promoters.

