


Servicios Personalizados
Revista
Articulo
 Inglés (pdf)
 Artículo en XML
 Referencias del artículo
 Enviar artículo por email
Indicadores
-
 Citado por SciELO
 -
 Accesos
Links relacionados
-
 Similares en
SciELO
Similares en
SciELO
Compartir

 Permalink
Revista mexicana de ingeniería biomédica
versión On-line ISSN 2395-9126versión impresa ISSN 0188-9532
Rev. mex. ing. bioméd vol.32 no.2 México dic. 2011
Artículo de investigación original
A simple alternative for modulating and recording the PQRST complex
Cano ME*, Jaso RA*, Tavares ME*, Estrada JC*, Mena EA*, Reynoso O*, González-Vega A**, Córdova-Fraga T**
* Centro Universitario de la Ciénega de la Universidad de Guadalajara, Ocotlán, Jalisco. México.
** Departamento de Ciencias e Ingeniería, Universidad de Guanajuato, León Gto. México.
Correspondence:
Mario Eduardo Cano.
Centro Universitario de la Ciénega de la Universidad
de Guadalajara, 47820, Ocotlán,
Jalisco. México.
Tel: 52(392) 92 5 94 01
E-mail: eduardo.cano@cuci.udg.mx
Received article: 17/mayo/2011.
Accepted article: 09/noviembre/2011.
ABSTRACT
This work presents the instrumentation steps towards the development of a low cost personal device for conditioning, modulating in amplitude and recording the electrical activity generated by bipolar leads of the heart. Also, a method of remote monitoring using an audio transmitter-receiver in modulated frequency adapted to a PC sound card is considered. To determine the modulation effects on the PQRST complex, simultaneous measurements on several volunteers are carried out. The signal is measured twice, initially before the first modulation and again after the final demodulation. For comparison, the same signals are simultaneously passed through a commercial electrocardiograph. Because of the modulation effect, measurements between both methods show differences up to 13% in some intervals of the PQRST complex. The PR segment and the QRS wave are the most affected. In general, there is a good agreement between the recordings obtained with our device and the trademark electrocardiograph.
Key words: Wireless, cardiac, audio, modulation.
RESUMEN
En este trabajo se presentan los pasos realizados para el desarrollo de un dispositivo personal de bajo costo para el acondicionamiento, modulación en amplitud y grabación de la actividad eléctrica generada por derivaciones bipolares del corazón. Asimismo se propone un método de monitoreo remoto utilizando un transmisor-receptor en frecuencia modulada adaptado a la entrada de la tarjeta de audio de una computadora personal. Se desarrollan mediciones simultáneas del complejo PQRST en distintos voluntarios usando el equipo propuesto y un electrocardiógrafo comercial con el fin de determinar los efectos de modulación y transmisión del sistema propuesto. Las diferencias obtenidas en el análisis de las señales muestran una diferencia máxima del 13% en distintos intervalos del complejo PQRST originados por el efecto de la modulación, siendo el segmento PR y la onda QRS los más afectados. En general se observa una buena correspondencia entre las señales obtenidas con el dispositivo propuesto al ser comparadas con las obtenidas con un electrocardiógrafo comercial.
Palabras clave: Comunicación inalámbrica, señal cardiaca, audio, modulación.
INTRODUCTION
Classically the ECG tracing has five deflections called PQRS and T waves, represented by small amplitude wavy lines describing the potential differences between two of several electrodes positioned around the body. Each of these segments reveals some vital information about the physiology of the heart. Put together this information gives a good image of the overall heart behavior.
In cardiac medicine, as part of the standard routine examination procedure, the 12-lead ECG of a patient at rest has proved its value as a diagnostic tool for detecting heart diseases such as ischemic heart disease by coronary artery stenosis, valvular disease, cardiac arrhythmia and has helped in the evaluation of heart muscle remodelling in hypertensive or hypertrophy cardiomyopathy and congenital heart disease1-3. ECG analysis is widely used to diagnose many cardiac diseases, the main cause of mortality in developed countries4. Early diagnosis and treatment improves the prognosis of most cardiopathies5. Sudden cardiac arrest prematurely claims the lives of more than 7 million worldwide6,7 and is frequently preceded by the onset of tachyarrhythmias such as ventricular tachycardia and ventricular fibrillation. These abnormalities can be detected promptly with electrocardiography analysis, and enables the doctor to modify the natural development of the disease.
Nowadays much work has been performed to design wireless devices using transmitters based on some communication protocol like Bluetooth and Zigbee2,8-12, capable of recording cardiac signals in PC or mobiles. While many of them are indeed very small since they are built using surface mount technology and microcontrollers, and have also very low power consumption, in general there are no quantitative comparisons reported between the signals obtained by such devices and those obtained by neither standard devices nor a loss information analysis. Nevertheless the wireless recording of the ECG signals are a good alternative because this modality facilitates outdoorspatientmonitoring.
The device proposed in this paper has proven to be of practical use in hospitals with poor or null data wiring facilities and high requirement of continuous patient monitoring. Furthermore, the use of this device is a lot cheaper than adapting hospital facilities for the use of commercial monitoring devices.
Although it is known that extremely low (0.02Hz) and extremely high (as high as 500 Hz) ECG signal frequencies have disturbances in power due to sleep apnea and slowed conduction velocity resulting from ischemia or deposition of collagens after an acute myocardial infarction respectively13,14, the bandpass filter recommended by the American Heart Association for adolescent and adult diagnosis is 0.05-150 Hz15. Those values should be changed if ST analysis is sought, to do so the low cutoff frequency is to be decreased in order to allow signals lower than 0.02 Hz or if dealing with infant diagnosis where the high cutoff frequency must be increased to 250 Hz13,15.
This article summarizes the steps involved in building a low cost device, for cardiac signals wireless registration. This method is based on coupling an amplitude modulated signal to an audio FM transmitter, and then the signal is recollected through the audio input of a computer to be digitally demodulated and interpreted. While the idea behind this work is fairly simple, to our knowledge this is the first report of a ECG signal been converted into an «audible ECG signal» by an AM modulation procedure, enabling the use of a standard audio PC card for data acquisition; it has to be underlined that the true worthiness of this work are the cost and the space benefits. Also the comparative study between the traditional data acquisition method and the device proposed has been incorporated in the results section of the paper; in order to do so we analyze several volunteers and determine the consistency between the signals before modulation and after being demodulated, and compare the results with a commercial Fukuda Denshi: Cardimax mod. FX-1201 electrocardiograph.
MATERIALS AND METHODS
A personal device for recording the PQRST complex was developed using disposables electrodes, amplifiers, both passive and active filters, shielded RCA cables, four batteries (1.5 V) as power supply and a notebook computer. Clearly no expensive components were included in this prototype.
In particular, because of their high input and lowoutput impedance, operational amplifiers were used for amplification and filtering, this is standard procedure to determine biopotentials. The schematic diagram of the signal-conditioning unit implemented in this work is shown in Figure 1.
Seven steps were considered for conditioning the signal:
1) Isolation and patient protection (Figure 1(A)) against electrical shock using a multiple propose operational amplifier TL071. The task of isolation is mainly performed by the capacitor of 0.01 µf; it decouples the grounded right leg from the power supply.
2) Instrumentation amplifier AD620AZ (Figure 1(B)) with a fixed gain G1 = 10. The gain adjustment in this kind of operational amplifiers can be programmed just by setting a resistance RG between the terminals 1 and 8 according to the Eq. (1).
In this work the selected resistor has RG = 5.5 k Ω.
3) Passive band-pass filter (Figure 1(C)), only allows the passage of frequencies in the range of 0.05 Hz to 150 Hz according to15 and attenuates frequencies outside that range including DC signal. In this type of RC filter the lower and higher frequencies satisfies the Eq. (2).
With the components displayed in Figure 1(C) the calculated frequencies are 0.12 Hz and 132 Hz respectively. Nevertheless an attenuation of approximately -3dB on the initial amplitude (Figure 2), due at the smoothness fall of this filter and a 5% tolerance of the components is observed.
4) In order to increase the ECG signal and cut off the offset level intrinsic at the amplification stage, a non-inverting amplifier with a gain G2 = 11 a high pass RC filter identical to the passive filter are used (Figure 1(D)). This configuration is built using a multiple purpose operational amplifier TL081 and the gain is adjusted according to Eq. (3); considering R1 = 1 kΩ and R2 = 10 kΩ.
5) To suppress the domestic tension line frequency a Notch filter of 60 Hz with gain G3 = 1 (Figure 1(E)), setting the capacitor of 1 nf and the resistance of 2.7 MΩ, is selected. At this stage, an attenuation of -26 dB on the 60 Hz interference and -3 dB on the frequencies higher than 150 Hz is confirmed, nevertheless a small attenuation of -6 dB is found on the frequency of 40 Hz, this frequency provides an important contribution at the ECG spectrum. The gain calculated in a similar fashion to the non-inverter configuration is in agreement with other authors such as Ying-Wen16.
6) Active filtering using a 4th order low-pass Butter-worth filter with a 150 Hz cut off frequency using two operational amplifiers TL082 (Figure 1(F)). This is a very narrow roll-off filter and we have choose a gain G4 = 1.
7) Non inverting amplifier with a gain G4 = 2 and a potentiometer in the offset null inputs to have control of the offset level of the signal (Figure 1(G)) to be modulated later.


This topology makes possible to obtain a common rejection mode around 110 dB, input impedance bigger than 1 GΩ, base line restoration less than 1 second and offset control. All the values of gains and band-pass filtering are in accordance to the literature reports 13-15, 17-20. The measured frequency response for both, the proposed device and the commercial Fukuda electrocardiograph, are displayed in Figure 2.
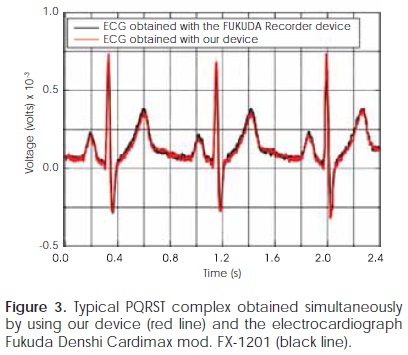
Figure 3 shows the typical cardiac tracing (second lead) from a volunteer with no history of heart disease. A two channels TEKTRONIX mod. TDS2012B oscilloscope is used to obtain simultaneously the signals from our device and an electrocardiograph Fukuda Denshi: Cardimax mod. FX-1201, a very good agreement between the signals registered by both devices is observed. The signal to noise ratio (S/N) (Eq. 4) obtained with this electronic configuration is around 40 ± 0.1 dB.

where vs and vn are the average amplitude of the signal and the noise respectively.
Electrocardiographic signals can be acquired before digitalizing stage using some peripheral port of a PC19. It is known that the audio input is a peripheral designed to record signals in the human audible frequency range, roughly 20 Hz-20 kHz. While the frequency of a human cardiac signal is partially outside of the audible range, the frequency spectrum of a normal ECG of a patient at rest starts at 0.01 Hz13,15, it should be noted that cardiac signals between 0.01to20 Hz would be attenuated if injected directly to the audio input. This drawback is taken care of by the introduction of an AM modulation stage to shift the power spectrum to the audio PC card proper range.
Moreover PC audio inputs are usually an analogical interface with a threshold voltage range ± 1V, and have an ADC with an 8 or 16 bits resolution and a maximum acquisition rate of 192 kS/s. In order to pass segments of cardiac records through sound input channels it is necessary to modulate the obtained signal in amplitude (AM), the carrier signal selected to perform the modulation is in the human audible range (1.91 kHz). An operational amplifier in double integrator configuration (Figure 4A) and an arrangement of transistors are used to perform the convolution of both signals (Figure 4B).
Due to the fact that signal is modulated in AM and its carrier is in the audible range it can be transmitted using a transceiver for wireless audio, preferably in a FM band to avoid amplitude degradation in the reception stage16,19. For this purpose we use a commercial low price (around US$ 14) Transmitter-Receiver (STEREN MIC-219). This model possesses a frequency response range of 80 Hz to 12.5 kHz, sensibility -42dB, input impedance 2.1 kΩ and a maximum distance range of 30 m (90.9 ft). It is important to emphasize that the signal introduced into the FM transmitter is the AM modulation of the ECG signal and the central frequency of its spectrum is in 1.91 kHz, a safe value within the frequency response. The output signal of the Transmitter-Receiver device has the AM modulated cardiac signal which is introduced into the audio input of the PC. In Figure 5A, is shown the cardiac modulated signal with a modulation factor m given in the Eq. (5).

where APQRST and ACarrier are the amplitude of the PQRST complex and the signal carrier respectively. In general m depends inversely on the source-receiver separation, so that a coherent demodulation of the signals is required.
Once the AM modulated cardiac signal is introduced into the audio input, data acquisition and demodulation can be done by the PC hardware and software, these tasks are performed in real time. In the specific case of the selected portable computer, the frequency response of the audio card is in the range of 14 Hz to 9 kHz with an acquisition rate of 48 kS/s. These parameters ensure 25 samples in a full carrier cycle, exceeding by far the lower bound imposed by the Nyquist-Shannon sampling theorem so that aliases in the demodulated signal are prevented.
To perform the digital demodulation the National Instruments (NI) using the NI demodulation toolkit is the software of choice. This tool enables to write subroutines for coherent demodulation, real time signal display and data storing in files for future offline analysis.
For the modulation in amplitude, the original signal m(t) (enveloper) is converted into the signal given by Eq. (6),

where C is a constant that depends on the carrier signal amplitude. Multiplying Eq. (6) by cos(wt) and using the trigonometric identity cos2(θ) = V + cos(2θ)/2 we obtain Eq. (7)

To recover the original signal m(t), the signal y(t) of Eq. (7) has to be filtered through a band pass filter tuned at frequency w in order to remove the DC component and the frequencies bigger than the carrier signal. Once the filtered signal is obtained, it has to be multiplied by 2.
RESULTS
Electrocardiographic records were taken from a group of 20 volunteers without a history of heart disease; each patient was positioned in a lying flat and relaxed state, simulating a bed monitoring situation. It has to be noted that all measurements were obtained with the help of an expert in electrocardiography of the Unidad Médica HGZMF6 of the Instituto Mexicano del Seguro Social in Ocotlán, Jalisco. A total of 3 measurements per volunteer were captured, each measurement lasted 6 seconds, the time interval most frequently utilized in diagnosis ECG because it enables to easily obtain an estimation that uses minutes as time unit21. Figures 5A and 5B show a typical modulated signal transmitted from a distance of 25 m by wireless and the corresponding demodulated signal, respectively. Data files were plotted using Origin 7.0 and the demodulation was performed using Lab VIEW 8.5. After demodulation, S/N (Eq.4) was approximately 30 dB, that is, an increment in the distortion of the modulated signal. The source of this distortion is associated mainly with a nonlinear behavior of the AM modulation stage and also with a possible impedance coupling problem between the FM transmitter-receiver output signal and the audio input of the PC. Total Harmonic Distortion (THD) (Eq. 8) measured is around of 10 ± 3 %.

where Y1 is the RMS amplitude of the fundamental component of 1.91 kHz and Y1 i = 2, 3,...,n is the RMS amplitude value of the ith harmonic.
By digitally filtering the modulated signals through a two order band pass filter with cut off frequencies 1.8 khz and 2.2 kHz, the THD is decreased to less than 1%, which enables a good demodulation quality. Now, the S/N ratio obtained in the PQRST complex is close to 40dB, after the demodulation stage, recovering thus the value reported in the conditioning stage. Figure 6 shows a segment of the PQRST complex of 2 different volunteers; the conditioned signal (in black) was acquired using an oscilloscope with8bitsresolution and 1kS/sofsample rate,while the signal (in red) was processed by the computer with the configuration of the audio card to 16 bits and 48 kS/s. For comparison purposes the two signals were superposed in Figure 6 to enhance the good agreement between them.
Before the analysis of the obtained ECG signals, they were carefully inspected to discard those with artifacts due to involuntary movements. A total of N = 15 EEG segments of 6 seconds were analyzed.
In order to compare the PQRST traces with our device initially and after demodulation, the differences of the mean values of: PR segment, ST segment, PR interval, QRS interval, QT interval, P wave amplitude, QRS wave amplitude and T wave amplitude were calculated in each case. Moreover the mean of the absolute values of the Relative Average Values (RAV) were obtained from Eq. (9). In Table 1 displays the values of RAV with its respective standard deviation. It is mainly observed differences of 12 ± 7% in the ST segment and of 11 ± 10% in the QRS wave, the minimum differences are observed in the QT interval of 3 ± 2%.

A similar procedure was performed with Eq. (9) to determine the RAV between the demodulated signals and those simultaneously obtained with the Fukuda electrocardiograph. The differences most frequently encountered were 13 ± 10 % in the PR segment and 13 ± 15 % in the QRS wave, while the minimum differences observed were in the QT interval with values of 5 ± 7%.
It must be underlined that even though the device weights about 200 g including batteries and it size is 10x10x1 cm, with an electrical consumption under 60 mA, it was never meanttobeaportable electrocardiograph since it needs a computer, but it is very inexpensive instrument that can easily be implemented in medical offices and clinical rooms even those in rural areas.
CONCLUSIONS
This paper describes an inexpensive and easy to construct device to record cardiac signals from bipolar leads. Operational amplifiers and both passive and active filters are the basic building blocks. Analogue AM modulation is achieved using a carrier signal with a frequency in the audible range to be received by the audio input of a notebook computer. The modulated signals are sent to the computer by a wireless FM transmitter, and then software is used to digitally demodulate them.
Furthermore the results obtained with our device, both, before modulation and after demodulation, are in good agreement with the trademark electrocardiograph, in every ECG signals important feature (main segments, intervals and amplitudes). This agreement indicates that the device is ready to start a certification process.
This instrument has the great advantage of solving the external communication problem since the ECG is already digitized and demodulated by the computer. Also, once the signal is demodulated, data storage can be implemented in an easy and inexpensive way using computer's memory and hard disk.
Recapitulating, the conversion of ECG signal into an audio signal allows the use of an excellent digitizing hardware available in any computer. Also, the modular implicit design allows the possibility to change the communication channel from a low range FM transmitter as the one used in this research, to a long range transmitter such as a mobile phone. This apparatus not only can work in a wide variety of ranges but is also friendly with, both, analog and digital audio transmission technology with a very low distortion. The same cannot be said of the equivalent commercial devices where there is a restriction, depending on the model and brand to select Bluetooth, WiFi or ZigBee (recently used to transmit ECG signals2,8-12). Moreover, all commercial technologies have limitations in range and many of them require further accessories to be used with ordinary computers. In addition, the access to the ECG data is made easy because it only entitles the audio input reading, a very simple task in any computer language and communication protocols can be circumvented.
Figure 2 reveals that there is still room for Notch filter behavior improvement. A possible way could be the implementation of software filters such as the one proposed in22. In the future changes in design are being thought in order to enable the use of this electrocardiograph with infants. An interesting filtering strategy maybe the use of digital filters15, not just to enhance the SNR but to try to eliminate the typical artifacts such as muscular movement, breath signals, etc23.
In the future this work has to be extended to handle the basic 12-lead heart signals simultaneously, probably with the use of a multiplexer for twelve different AM modulation signals. Since the carrier is in the audible range, further research may prove useful to apply a modulation method in order to perform telediagnostics using a transmitter, such as a mobile phone, radio transmitter or any other widely available media.
ACKNOWLEDGEMENTS
This work was partially supported by PROMEP grants 103.5/08/4722 and 103.5/10/4684 as well by COE-CYTJAL PS-2009-954. Also the authors want to thank the Unidad Médica HGZMF6 of the Instituto Mexicano del Seguro Social in Ocotlán, Jalisco for all the support and access to their facilities they offered us and Doreen Dignowity for her invaluable help in reviewing this paper.
REFERENCES
1. Guyton CA, Hall EJ. Textbook of medical physiology. Mc Graw-Hill, 11 ed. (Spain), 2001; (9): 103-114. [ Links ]
2. Jia-Ren CC, Cheng-Chi T. "A new wireless-type physiological signal measuring system using a PDA and the bluetooth technology". Instrumentation Science & Technology 2009; 37(5): 503-515. [ Links ]
3. Shlomo S, Samuel S. "The ECG in diabetes mellitus". Circulation 2009; 120(16): 1633-1636. [ Links ]
4. Tavel ME. "Stress testing in cardiac evaluation: current concepts with emphasis on the ECG". Chest, 2001; 119(3): 907-925. [ Links ]
5. Heikki V, Huikuri1 MJ, Pekka R, Moerch-Joergensen R, Juha H, Vesa V, Boland J et al. "Prediction of fatal or near-fatal cardiac arrhythmia events in patients with depressed left ventricular function after an acute myocardial infarction". European Heart Journal 2009; 30(6): 689-698. [ Links ]
6. Rubart M, Zipes DP "Mechanisms of sudden cardiac death". J Clin Invest 2005; 115: 2305-2315. [ Links ]
7. Diana K, Audrius A. Lip-Gregory YH. "Atrial fibrillation following cardiac surgery: clinical features and preventative strategies". European Heart Journal 2009; 30(4): 410-425. [ Links ]
8. Yi-Li T, Yo-Zong S, Fu-Shan J. "Portable, real-time, 12-lead ECG monitoring system". Instrumentation Science & Technology 2010; 38(4): 305-312. [ Links ]
9. Güler NF, Fidan U. "Wireless transmission of ECG signal". Journal of Medical Systems 2006; 30: 231-235. [ Links ]
10. Daskalov IK, Dotsinsky IA, Christov II. "Developments in ECG acquisition, preprocessing, parameter measurements and recording". IEEE Engineering in Medicine and Biology Magazine, 1998; 17: 50-58. [ Links ]
11. Borromeo S, Rodriguez-Sánchez C, Machado F, Hernández-Tamames JA, de la Prieta RA. "Reconfigurable, wearable, wireless ECG system". In Proceedings of the 29th Annual International Conference of the IEEE EMBS, Cité Internationale, Lyon, France August 23-26, 2007. [ Links ]
12. Thaddeus RF, Fulford-Jones, Gu-Yeon W, Welsh M. "A Portable, Low-Power, Wireless two-lead EKG system". In Proceedings of the 26th Annual International Conference of the IEEE EMBS San Francisco, CA, USA September 1-5, 2004. [ Links ]
13. Clifford GD, Azuaje F, McSharry P. Advanced methods and tools for ECG data analysis. Artech House Publishers, 1 ed. (Boston, MA) 2006; (chapter 3): 57. [ Links ]
14. Clifford GD, Azuaje F, McSharry P. Advanced methods and tools for ECG data analysis. Artech House Publishers, 1 ed. (Boston, MA) 2006; (chapter 2): 45. [ Links ]
15. Kligfield P, Gettes LS, Bailey JJ, Childers R, Deal BJ, Hancock EW et al. "Recommendations for the standardization and interpretation of the electrocardiogram: Part I: The electrocardiogram and its technology: A Scientific Statement from the American Heart Association Electrocardiography and Arrhythmias Committee, Council on Clinical Cardiology; the American College of Cardiology Foundation; and the Heart Rhythm Society. Endorsed by the International Society for Computerized Electrocardiology". Heart Rhythm 2007; 4(3): 394-412. [ Links ]
16. Ying-WenB,Chien-YungC, Cheng-Kai L, Chuang-Hsiang H, Yuh-Ting Ch, Ya-Nan L. "Adjustable 60Hz noise reduction and ECG signal amplification of a remote electrocardiogram system". In proceedings of the instrumentation and Measurement Technology Conference Vail, CO, USA, 20-22 May 2003. [ Links ]
17. Drewes AM, Andreasen A, Assentoft JE, Nagel O. "Seven-channel digital telemetry system for monitoring and direct computer capturing of biological data". Journal of Biomedical Engineering, 1993; 15(5): 435-440. [ Links ]
18. Mohseni P, Najafi K, Eliades SJ, Wang X. "Wireless multichannel biopotential recording using an integrated FM telemetry circuit". IEEE Transactions on Neural Systems and Rehabilitation Engineering 2005; 13(3): 263-271. [ Links ]
19. Güler I, Kara S. "A low-cost biotelemetry system for long time monitoring of physiological data". Journal of Medical Systems 1996; 20(3): 151-156. [ Links ]
20. Bobbie PO, Chaudhari H, Arif CZ, Pujari S. "Electrocardiogram (EKG) Data Acquisition and wireless transmission". WSEAS Transactions on Systems 2004; 4(1): 2665-2672. [ Links ]
21. Dubin D. Rapid interpretation of EKG's. Cover Pub Co, 6 ed. (Tampa, FL) 2000: (4): 76. [ Links ]
22. Mali RD, Khadtare MS, Bombale UL. "Removal of 50Hz PLI using discrete wavelet transform for quality diagnosis of biomedical ECG signal". International Journal of Computer Applications, 2011; 23(7): 35-40. [ Links ]
23. Clifford GD, Azuaje F, McSharry P. Advanced methods and tools for ECG data analysis. Artech House Publishers, 1 ed. (Boston, MA) 2006; (chapter 5-6): 135-196. [ Links ]
Nota
Este artículo también puede ser consultado en versión completa en: http://www.medigraphic.com/ingenieriabiomedica/

