


 nueva página del texto (beta)
 Inglés (pdf)
 Artículo en XML
 Referencias del artículo
 Enviar artículo por email
 Citado por SciELO
  Similares en
SciELO
Similares en
SciELO 
 Permalink
1. Introduction
The uncertainty-investment relationship has been a core research topic among economists for several decades now. However, its relevance increased following the 2008 global financial crisis (Denis and Kannan, 2013), when leading economists and monetary authorities from all around the world started to openly express that uncertainty about the global economic outlook was fostering a “wait and see” attitude among economic agents and, therefore, contributing to a decline in spending projects, particularly investment expenditures. The following are some quotes that reflect this situation:
“Uncertainty is largely behind the dramatic collapse in demand. Given the uncertainty, why build a new plant or introduce a new product now? Better to pause until the smoke clears...” (Olivier Blanchard, in Bloom 2013).
“A dark cloud of uncertainty is looming over global growth, particularly around weakening emerging markets and the outcome of the EU referendum, which is chilling some firms plans to invest. At present, the economic signals are mixed we are in an unusually uncertain period...” (Caroline Fairbairn, in CBI Press Team, 2016).
“Given the uncertainty in markets, many of our clients are stepping away from trading. Even in wealth management, the uncertain environment means that a lot of the clients sit on cash and avoid long-term decisions and really are not very active and that’s a very difficult model to be in... It’s a difficult environment still. This year there is huge uncertainty in global markets, major political decisions to be taken in the U.S. (with the presidential election in November) and U.K. (with the referendum on European Union membership), so I think a lot of people are waiting for that dust to settle. So that gives me hope that the second half of the year will see more activity (from clients)but at the moment the indicators are still that the market is difficult” (UBS Chairman Alex Weber, in Ellyatt and Cutmore, 2016).
“FDI recovery continues along a bumpy road. Particularly of concern is the sharp drop-off in manufacturing investment projects, which play such an important role in generating badly needed productivity improvements in developing economies. Looking ahead, economic fundamentals point to a potential increase in FDI flows by around 10% in 2017. However, significant uncertainties about the shape of future economic policy developments could hamper FDI in the short term” (United Nations Conference on Trade and Development, UNCTAD, Secretary-General Mukhisa Kituyi, in UNCTAD, 2017a).
The purpose of this paper is to provide some empirical evidence on the effect of uncertainty on foreign direct investment (FDI) flows into the Mexican manufacturing sector. We use a panel of manufacturing sectors with quarterly data over the period 2007 2015. Our econometric analysis follows Ghosal and Loungani (1996) in the sense that we estimate an econometric specification where FDI is the dependent variable, and its lag -a proxy for uncertainty- and manufacturing cash flow are the main independent variables.1 However, we augment this econometric specification by adding domestic and external factors that we consider may also encourage or hamper FDI flows into Mexico. These additional independent variables are the following: an insecurity index for Mexico, the interest rate of Mexico’s inflation-indexed bonds, the peso/U.S. dollar real exchange rate, Mexico’s export/GDP ratio, the U.S. industrial production index and the U.S. federal funds rate.
The contributions of this paper to the empirical literature on the uncertainty-investment link are three-fold. First, it analyzes the effect of uncertainty on FDI flows into the Mexican manufacturing sector, rather than on fixed investment as most empirical studies on this relationship do (e.g. Episcopos, 1995; Ghosal and Loungani, 1996, 2000; Bloom, Bond, and Van Reenen, 2007). Varella-Mollick, Ramos-Durán, and Silva-Ochoa (2006) and Jordaan (2012) analyze the determinants of FDI flows into Mexico, but they do not focus on the relationship between uncertainty and FDI.2 Varella, Ramos, and Silva (2006) study the impact of market size, infrastructure, agglomeration economies, government expenditure on infrastructure, real wages, and labor unions on FDI flows into Mexican states over the period 1994-2001; while Jordaan (2012) analyzes the effect of regional demand, production costs, agglomeration of manufacturing and services, and regional distance to Mexico City and the United States on FDI flows into Mexico during the period 1994-1999.
Second, in order to investigate the uncertainty-investment relationship we build some uncertainty measures based on the expectations of entrepreneurs and forecasters about individual manufacturing subsectors and/or Mexico’s economic situation, rather than on the volatility of stock market returns as is usually the practice in the empirical literature (i.e. Episcopos, 1995; Leahy and Whited, 1996; Bloom, Bond and Van Reenen, 2007; Valencia-Herrera and Gándara-Martínez, 2009; Sharifi-Renani and Mirfatah, 2012). To our knowledge, this is the first paper on the uncertainty-investment relationship for the case of Mexico that measures uncertainty based on individuals’ expectations. Nonetheless, we also evaluate the importance of uncertainty measures related to the economic and political situation of Mexico and/or of developed countries that we consider may affect all manufacturing subsectors in general.
Third, we perform some simulations in order to evaluate the size of the uncertainty effect on FDI flows into the Mexican manufacturing sector. To our knowledge, Bloom, Bond, and Van Reenen (2007) for the case of the United Kingdom is the only paper that has performed some simulations to track and quantify the investment response to an uncertainty shock.
Our main findings show that an increase in uncertainty discourages FDI flows into the Mexican manufacturing sector. These results are in line with the theoretical and empirical literature on irreversible investment. The findings also reveal that idiosyncratic (sectorial) uncertainty measures are more important in explaining FDI flows into the Mexican manufacturing sector than aggregate uncertainty measures, which affect all subsectors in general. Nonetheless, the aggregate uncertainty measure capturing global risk aversion seems to also have an effect on FDI flows. Our econometric simulations also show that if uncertainty (proxied, for example, by unc1: Firm’s eco. situation in 12 months time) for each and every quarter during the period 2010 2015 had been lowered by 1 percentage point, the Mexican manufacturing sector would have received, on average, an additional 714 million dollars FDI flows (or an additional 4.6 percent of actual average FDI inflows) per year over the period 2010 - 2015. Overall, the results suggest that a stable macroeconomic environment is crucial for attracting FDI flows into a country and therefore for promoting economic growth.
The remainder of the paper is organized as follows: Section two reviews the theoretical and empirical literature on the effect of uncertainty on investment; section three describes the data, the econometric specification, and the estimated results; section four presents some simulations to quantify the effect of uncertainty on FDI flows; while section five concludes.
2. Literature review
Despite the attention the uncertainty-investment relationship has received over the years, no theoretical consensus has yet emerged on whether it is positive or negative.
On one hand, Hartman (1972, 1976) and Abel (1983, 1984, 1985) show that output price uncertainty raises a competitive and risk-neutral firm’s investment if the marginal profitability of capital is convex in prices.3
On the other hand, Pindyck (1988, 1991) and Dixit and Pindyck (1994) show that if an investment is irreversible (i.e.“sunk costs that cannot be recovered should market conditions change adversely” according to Caballero and Pindyck, 1992), uncertainty on future demand reduces a risk-neutral firm’s investment. An irreversible investment implies not only an investment expenditure but also an opportunity cost since the investor gives up the opportunity of waiting for new information about market conditions to arrive and therefore to make a productive investment. Under irreversibility, the Net Present Value rule becomes invalid. Instead, firms invest if the net present value of investment less the opportunity cost of irreversibility is greater or equal to zero. Therefore, if uncertainty increases, the opportunity cost or “option to defer” as is usually called in the literature also increases, and the likelihood of an economic agent making an investment decreases.
This theoretical puzzle on the uncertainty-investment relationship has prompted the emergence of a considerable amount of empirical studies on this topic. Nonetheless, the majority of them have given support to the negative link. This empirical consensus has been reached by using either aggregated (Ferderer, 1993; Episcopos, 1995; Price, 1996) or disaggregated data (Leahy and Whited, 1996; Guiso and Parigi, 1999; Fuss and Vermeulen, 2004; Bloom, Bond, and Van Reenen, 2007), and different approaches for measuring uncertainty.
The empirical literature has emphasized some advantages of using disaggregated data: 1) it permits to use uncertainty measures that are more related to the idiosyncratic factors which affect industries or firms (Leahy and Whited, 1996; Kalckreuth, 2000); and 2) it permits to control for endogeneity problems between uncertainty and investment, as well as for industry/firm heterogeneity, if panel data is available to the researcher (Carruth, Dickerson, and Henley, 2000).
In this paper, we use disaggregated data at a manufacturing sub-sector level, which has enabled us to control for these problems. As regards the uncertainty measures, there are three main approaches used in the empirical literature to proxy uncertainty.4 The most common approach consists on obtaining the volatility of stock prices/returns, output prices, commodity prices and/or exchange rates to proxy uncertainty. For instance, Leahy and Whited (1996) use a panel of 600 U.S. manufacturing firms to show that uncertainty, measured as the variance of firms’ daily stock returns, has a negative effect on investment/capital stock over the period 1982 - 1987. Ghosal and Loungani (1996) study the uncertainty-investment relationship using data on 4-digit U.S. manufacturing industries over the period 1958 1989. They split their sample into highly and low concentrated industries, based on each industry’s four-firm seller concentration ratio, in order to investigate whether differences across industries affect this relationship. For each industry, they estimate price equations to obtain uncertainty proxies, measured as the standard deviation of the residuals from those regressions. Their main results show that uncertainty depresses investment for low concentrated industries. Bloom, Bond and Van Reenen, (2007) focus on traded British manufacturing firms over the period 1972 - 1991 to analyze their investment response to demand shocks under uncertainty. In this case, the volatility of the manufacturing firms’ daily stock returns is used as a proxy for uncertainty and, investment is measured as gross industry investment to the beginning of the period capital stock. The authors give evidence of a non-linear effect of real sales growth on investment, and of a weaker effect of sales growth on investment when firms face higher levels of uncertainty. Sharifi-Renani and Mirfatah (2012) investigate the determinants of FDI flows into Iran over the period 1980-2006, and show that an increase in exchange rate volatility discourages FDI inflows.
A second approach is based on ARCH or GARCH estimates of the conditional variance of prices and/or other type of aggregates (i.e. manufacturing output, exchange rates, wages, among others) to measure uncertainty. Using ARCH estimates of the conditional variances of prices, real interest rates, aggregate personal consumption expenditure, stock prices and a composite index of 11 leading indicators, Episcopos (1995) finds that uncertainty depresses fixed private investment in the United States during the period 1948 - 1993. Lemi and Asefa (2001) study the impact of uncertainty and political instability on FDI flows from all source countries into a sample of host countries in Africa, over the period 1987 1999, and on U.S. FDI flows to that same sample of host countries in Africa, over the period 1989-1998. They use the unconditional standard deviation of the inflation rate and the real exchange rate and/or, as the conditional variance of these two variables, generated from (GARCH) models as a measurement of uncertainty.5 The specification, which is estimated by Tobit random effects and by fixed effects, also controls for the investors’ confidence, labor force availability, domestic market size, export sector size, cost of capital, and debt burden, among others. Their main results show that the effect of uncertainty on FDI flows from all source countries and from the United States as a whole is not significant. Political instability does have an impact on FDI flows from the U.S. manufacturing sector, whereas inflation and real exchange rate uncertainties, political instability and debt burden do have an effect on FDI flows from the U.S. non-manufacturing sector.
A third approach relies on data provided by surveys of individual forecasters’ expectations about the economic climate for investment decisions and of entrepreneurs’ expectations about the future demand for their firms’ product or output price changes. For the case of Ghanaian manufacturing firms over the period 1994 - 1995, Patillo (1998) tests and finds evidence for the following hypotheses: 1) firms only invest when the marginal revenue product of capital reaches a hurdle level; 2) uncertainty, which is proxied based on the “entrepreneur’s subjective probability distribution over future demand for the firm’s products”, increases the level of this hurdle to a greater extent for firms with irreversible investment and; 3) uncertainty depresses investment (measured as investment in plant and equipment in year t/value of plant and equipment in t-1) more severely on firms with irreversible investment. Guiso and Parigi (1999) use the 1993 Italian Survey on Investment in Manufacturing to compute an uncertainty measure based on each entrepreneur’s “subjective probability distribution of future demand for the firm’s product”. They mainly find that uncertainty has a bigger impact on investment (measured as fixed investment in structures, machinery and equipment, and vehicles to capital stock) when firms with more market power and with more irreversible investment are considered. Similarly, Fuss and Vermeulen (2004) study the impact of demand and price uncertainty on investment plans (from 1987 to 2000) and realized investments (from 1987 to 1999) for a sample of Belgian manufacturing firms. They use entrepreneurs’ expectations about the future demand for the firm’s products and output price changes, obtained from the Belgian Business Cycle Survey, to build their uncertainty measures.6 Their main results show that demand uncertainty has a negative and a statistically significant effect on planned and realized investment, while price uncertainty does not. Finally, Bond et al. (2005) explores the uncertainty-investment relationship for a sample of non-financial British firms over the period 1987 - 2000 using uncertainty proxies based either on stock market returns and/or on monthly analysts’ earnings forecasts. Their findings show that uncertainty is negatively associated with investment, and that this relationship is robust to the inclusion of other control variables such as sales growth, Tobin’s Q and cash flow.
Valencia-Herrera and Gándara-Martínez (2009) is the only paper that, to our knowledge, has investigated the uncertainty-investment relationship for the case of Mexico. The authors focus on a group of 104 firms listed in the Mexican Stock Exchange during the period 1997 - 2007. They study the effect of the volatility of daily stock market returns on the ratio of net total assets (or net fixed assets) plus amortizations and depreciation to net heritage (or total asset), which is their measure of investment. The analysis is performed by considering large, medium size, and small firms. Their main findings show a negative relationship between uncertainty and investment for the medium-size and small firms, while showing a positive relationship for the large firms.
Our paper, which also focuses on the Mexican case, distinguishes from the majority of the empirical literature on the uncertainty-investment link in three main ways. First, it analyzes the effect of uncertainty on FDI flows, rather than on fixed investment. As it is well known, FDI plays a significant role in promoting economic growth and in permitting access to production technology, innovative managerial practices, financial resources, etc. Second, this paper relies on INEGI’s Monthly Survey of Business Opinion (INEGI, 2017a) and on Banco de México’s Survey of Professional Forecasters (Banco de México, 2017a) to build uncertainty measures based on entrepreneurs’/forecasters’ expectations about individual manufacturing subsectors’ and about Mexico’s economic situation, rather than on the volatility of stock market returns. The volatility of stock market returns, which is the most common uncertainty measure used in the empirical literature, may capture several sources of risk, but it may also respond to “extraneous information, reflect irrational behavior and the presence of noise traders, or be dominated by speculative bubbles and subsequent crashes rather than by changes in the firms fundamentals” (Guiso and Parigi, 1999).7 In contrast, the uncertainty measures we use in this paper are closely related to the microeconomic behavior of the manufacturing subsectors analyzed, and to the idiosyncratic factors that affect them. Nonetheless, we also evaluate the importance of uncertainty measures that are more related to the economic and political situation of Mexico and of developed countries. Furthermore, by using directly observable entrepreneurs’/forecasters’ expectations, rather than an expectations-formation model to derive them, we are able to avoid measurement problems in our main estimated specification. Third, we perform some simulations in order to quantify the effects of uncertainty on FDI flows. To our knowledge, Bloom, Bond, and Van Reenen (2007) is the only paper that has performed such simulations, in order to track and quantify the response of investment to an uncertainty shock.
3. Empirical analysis
3.1. Foreign direct investment and uncertainty measures
This section describes our two main variables of interest: FDI and uncertainty. From 2007 to 2015, the Mexican manufacturing sector, which on average accounted for 16.6 percent of GDP during this period, attracted an annual average of 46.2 percent of total FDI flows.8 In contrast, the services sector, which on average accounted for 59.7 percent of GDP in this same period, attracted an annual average of 38.7 percent of total FDI flows (Secretaría de Economía, 2017). The United States was responsible for most of the FDI flows into the Mexican manufacturing sector, except for two years: in 2010, the Dutch company Heineken bought the brewery FEMSA (FEMSA, 2017), and in 2013 the Belgian company Anheuser-Busch InBev acquired another brewery, Modelo (Anheuser-Busch InBev, 2017). See Figures 1a and 1b for more details.
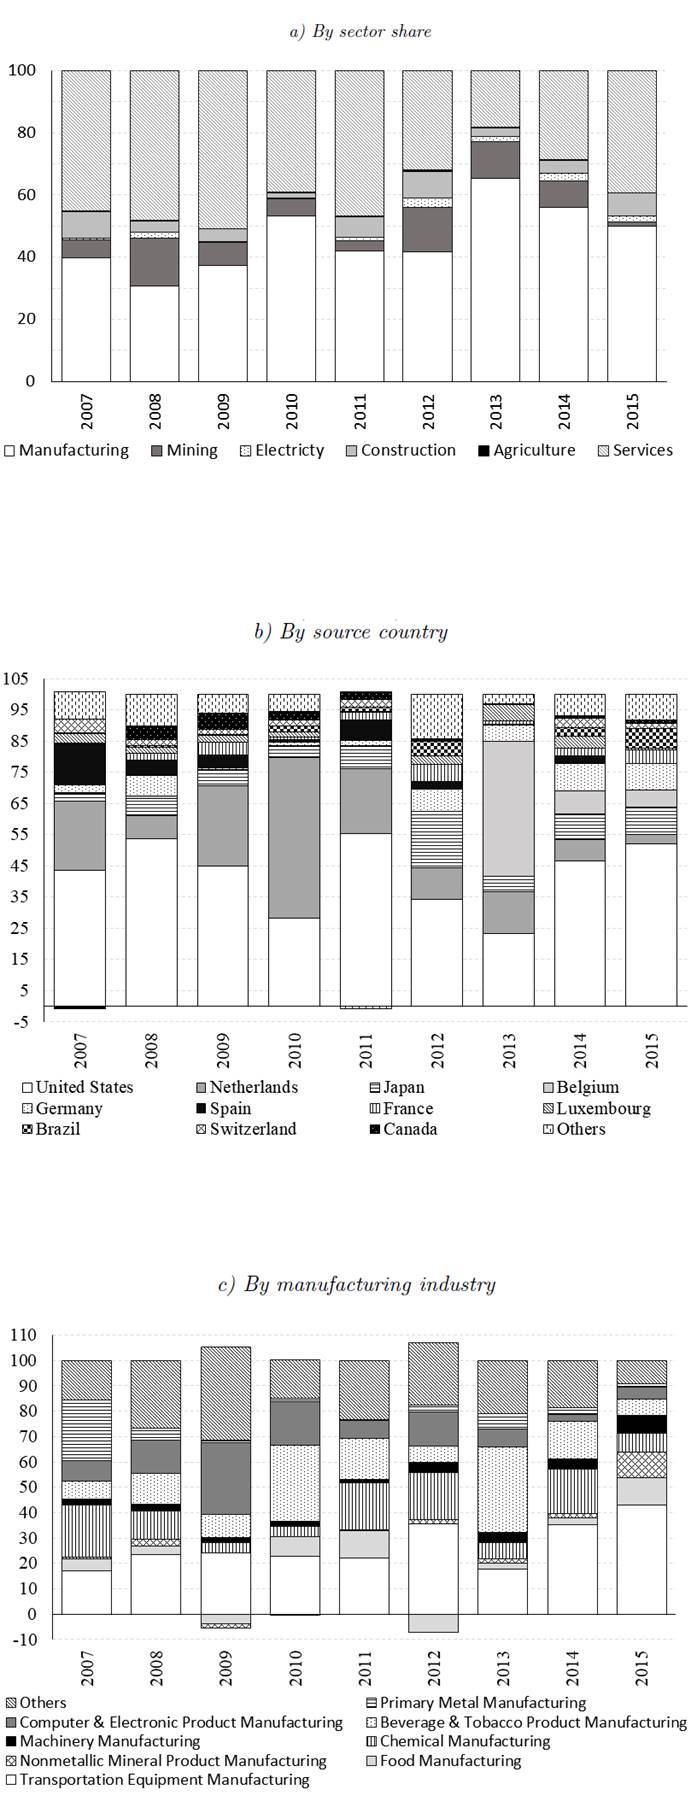
Figure 1 FDI flows into the Mexican manufacturing sector. a) By sector share. b) By source country. c) By manufacturing industry
FDI flows into the Mexican manufacturing sector have been heterogeneous. In 2007, most FDI flows went into the primarymetal manufacturing sector, followed by the chemical manufacturing sector and the transportation-equipment manufacturing sector. In 2010 and 2013, the beverages and tobacco-product manufacturing sector was the biggest recipient of FDI flows, as mentioned above. However, in 2012 and 2015 the transportation-equipment manufacturing sector attracted 35.7 percent and 42.8 percent of the FDI flows, respectively. See Figure 1c.
In this paper, we employ data on net FDI flows at a 3-digit manufacturing sector level. These data come from Banco de México and cover the period from the first quarter of 2007 (I/2007) to the fourth quarter of 2015 (IV/2015). They include new investments, credits given by headquarters to their related firms or branches, and the reinvestment of utilities. These data are quarterly and we expressed them in 2010 million pesos.
We also use two surveys to build three uncertainty measures that we consider closely related to the idiosyncratic factors that affect the manufacturing subsectors in Mexico: INEGI’s Monthly Survey of Business Opinion (INEGI, 2017a) and Banco de México’s Survey of Professional Forecasters (Banco de México, 2017a).
From INEGI’s Survey, we focus on the following questions to build our first two measures of uncertainty:
1) How would you expect the economic situation of your firm to be in 12 months time relative to the current situation?
2) How would you expect the economic situation of your country to be in 12 months time relative to the current situation?
The survey participants answer these questions by choosing only one of the following qualitative options: “much better”,“better”, “the same”, “worse” or “much worse”. Since these data, per survey respondent, is not public, INEGI provided us, for each question and for each manufacturing subsector and quarter analyzed, with the percentage distribution of manufacturing subsectors that answered these qualitative options. Therefore, we calculated our first two measures of uncertainty, which from now on we will call unc 1: Firm’s eco. situation in 12 months time and, unc 2: Country’s eco. situation in 12 months time, as the standard deviation of the percentage distribution of manufacturing subsectors that answered “much better”, “better”, “the same”, “worse” or “much worse” to the first and second question, respectively. These variables are available from I/2008 to IV/2015.
From Banco de México’s Survey, we focus on the following question to derive our third measure of uncertainty:
1) How would you evaluate the current economic climate for firm investment decisions?
The answers to this question can only be “good moment”; “bad moment or “I am not sure”, so the uncertainty measure, which varies across time but not across subsectors, is built with the percentage of forecasters that answered “I am not sure”. This variable is available from I/2007 to IV/2015 and we will refer to it from now on as unc3: Firms’ eco. situation to invest. Figure 2 shows the evolution of these three uncertainty

As can be seen, the three idiosyncratic uncertainty measures we built are correlated amongst themselves for most of the period under analysis and regardless of the survey being employed.
3.2. Econometric specification
Following Ghosal and Loungani (1996), we estimate an econometric specification where FDI is the dependent variable and its lag, a proxy for uncertainty and, manufacturing cash flow are the main independent variables. However, we also include some domestic and external factors in our model, since we consider they might encourage or hamper FDI flows into Mexico.9 These additional independent variables are the following: an insecurity index for Mexico, the interest rate on Mexico’s inflation indexed bonds, the Peso/U.S. dollar real exchange rate, the Mexican exports to GDP ratio, the U.S. industrial production index, and the U.S. federal funds rate. The estimated specification can be written as follows:
Where:
i, t are sub-indexes for manufacturing subsectors and time, respectively.
The lagged dependent variable FDI i,t−1 indicates we are estimating a dynamic model. The data on FDI flows are obtained from Secretaría de Economía (2017).
The variable Uncertaintyi,t stands for the uncertainty measures we built based on INEGI’s (2017a) and/or Banco de México’s (2017a) surveys, in other words:
unc 1: Firm’s eco. situation in 12 months time,
unc 2: Country’s eco. situation in 12 months time; and
unc 3: Firms’ eco. situation to invest
We expect these uncertainty measures to show a negative sign. If this is the case, then the results are evidence supporting the irreversible investment theory mentioned in the literature review.10
Cash Flow i,t−3 is measured as manufacturing sales minus wages, at a 3 digit manufacturing level. The data on this variable are obtained from INEGI (2017b). The reason for introducing cash flow into the specification is the following. Investment expenditure depends on Tobin’s q, the ratio of the market value of an additional unit of capital to its replacement cost. Investment increases if Tobin’s q is greater than 1 and decreases if it is less than 1 (Ferderer, 1993). Since Tobin’s q or marginal q is not observable, researchers approximate it using average q, which is the ratio of the market value of the firm to the replacement cost of its assets. We do not introduce Tobin’s q in the estimated specification for two main reasons: 1) our data is at an industry level so we cannot build this variable, and 2) following Ghosal and Loungani (1996), Tobin’s q does not “out-perform simpler measures such as sales or cash flow”. Hence, we include cash flow as an independent variable in our specification.11 This variable is generally used as a proxy for future demand growth or profitability and we expect it to have a positive effect on FDI flows into Mexico.
We proxy Insecurity t , at a national level, as the sum of robberies, homicides, and kidnappings in Mexico with data from the Secretariado Ejecutivo del Sistema Nacional de Seguridad Pública (2016). Criminal activity is generally perceived as a risk to an individual’s safety, so we expect that higher insecurity levels in Mexico will reduce FDI flows into the manufacturing sector.
The variable Interest Rate t is the interest rate on Mexico’s inflation-indexed bonds, and it is incorporated into the model since we expect that a higher domestic real interest rate will attract more FDI flows into Mexico.12 We also included the Peso/U.S. dollar real exchange rate, in our specification Exchange Rate t , since it is expect that a real exchange rate appreciation will reduce Mexico’s competitiveness and, consequently, its attractiveness to foreign investors.
We use the ratio of exports to GDP, Exports/GDP t as a proxy for trade openness in Mexico since we expect that higher trade openness might induce more FDI flows into Mexico. The data source for the domestic real interest rate and the real exchange rate is Banco de México (2017b and 2017c respectively), , while that for the export to GDP ratio is INEGI (2017c).
We incorporated the “external” factors U.S. Industrial Production t and U.S. Federal Funds Rate t into our specification since we consider that an economic boom and/or a tightening of U.S. monetary policy might deter FDI flows into Mexico.13 These variables were obtained from the Federal Reserve System (2016) and the Federal Reserve Bank of St. Louis (2016), respectively.
µi controls for unobserved time-invariant industry specific effects, and εi,t represents the specification’s error term.
All the variables in the model are expressed in logarithms, except for the uncertainty variables, the interest rate on Mexico’s inflation indexed bonds, the exports to GDP ratio, and the U.S. federal funds rate, which are expressed in percentages.14 Table 1 presents some summary statistics on the variables described above.
Table 1 Summary statistics
| Variable | Mean | StdDev | Min | Max |
|---|---|---|---|---|
| Unc 1: Firm’s eco. situation in 12 months time (percentage points) | 23.5 | 2.2 | 15.3 | 28.4 |
| Unc 2: Country’s eco. situation in 12 months time (percentage points) | 23.0 | 2.9 | 13.7 | 27.5 |
| Unc 3: Firms’ eco. situation to invest (percentage points) | 46.0 | 10.2 | 24.5 | 68.2 |
| FDI (2010 millions of pesos) | 194 | 670 | 0 | 14,213 |
| Cash flow (2010 millions of pesos) | 150 | 201 | 3.5 | 1,090 |
| Insecuritya (number of crimes) | 172,563 | 21,771 | 133,769 | 206,788 |
| Interest rate (%) | 1.9 | 1.0 | 0.5 | 3.8 |
| Exports/GDP (%) | 2.5 | 0.3 | 1.9 | 3.1 |
| Real exchange rate (peso/dollar) | 11.8 | 0.9 | 10.5 | 14.0 |
| U.S. industrial production (index) | 95.6 | 4.9 | 83.9 | 101.4 |
| U.S. federal funds rate (%) | 0.9 | 1.6 | 0.1 | 5.3 |
Note: acalculated as the sum of robberies, homicides and kidnappings in Mexico.
Equation (1) presents two main problems: 1) the lagged dependent variable and the lagged value of cash flow are correlated with the error term due to the presence of unobserved time-invariant industry specific effects, and 2) some regressors might be a function of FDI, rather than a determinant of it. The estimation of Equation (1) by traditional panel data techniques that do not control for these two problems (e.g. ordinary least squares) generates inconsistent and biased estimates of the unknown parameters. Therefore, we estimate Equation (1) by system GMM in order to restore consistency of the parameter estimates and to control for possible cases of endogeneity. In addition, the GMM estimator “turns out to be efficient within the class of instrumental variable estimators” (Nucci and Possolo (2010): 115). Following Arellano and Bover (1995) and Blundell and Bond (1998), Equation (1) is estimated by System GMM using STATA’s xtabond2 command written by Roodman (2006).
The Hansen test for over-identifying restrictions, which is a test for the exogeneity of the set of instruments included; the Arellano-Bond tests for first- and second-order autocorrelation in the first differenced residuals, as well as robust standard errors, to account for general forms of heteroskedasticity and serial correlation in the error term, are computed and registered together with the results in Tables 2 and 3.
Table 2 Estimation results: Idiosyncratic uncertainty variables
| Dependent variable: FDI | 1 | 2 | 3 | 4 | 5 | 6 |
|---|---|---|---|---|---|---|
| Unc 1: Firm’s eco. Situation in 12 months time | -0.0624 | -0.1531* | ||||
| (0.040) | (0.077) | |||||
| Unc 2: Country’s eco. situation in 12 months time | -0.1151** | -0.1616** | ||||
| (0.050) | (0.071) | |||||
| Unc 3: Firms’ eco. Situation to invest | -0.0261*** | -0.0361* | ||||
| (0.009) | (0.020) | |||||
| FDI (lagged) | 0.1070* | 0.0929 | 0.1492*** | 0.1406*** | 0.1004 | 0.1268 |
| (0.058) | (0.062) | (0.037) | (0.045) | (0.065) | (0.088) | |
| Cash flow (lagged) | 0.8074* | 1.0061** | 0.6382 | 0.9415*** | 1.3525* | 1.1359* |
| (0.431) | (0.443) | (0.460) | (0.322) | (0.739) | (0.650) | |
| Insecurity | -5.2535** | -4.8447* | -6.1543*** | -3.1482 | -1.4933 | -4.0114 |
| (2.112) | (2.559) | (2.155) | (2.837) | (5.718) | (3.980) | |
| Interest rate on inflation indexed bonds | -0.6289** | -0.6002** | -0.7393*** | -0.9591*** | -0.6199 | -0.2457 |
| (0.240) | (0.243) | (0.245) | (0.293) | (0.490) | (0.301) | |
| Real exchange rate | 1.5324 | 0.4274 | 0.5536 | 0.1813 | 0.6845 | 5.4890 |
| (1.135) | (1.211) | (1.022) | (2.444) | (2.768) | (3.417) | |
| Exports/GDP | -0.0002 | 0.0001 | 0.0008 | |||
| (0.000) | (0.000) | (0.001) | ||||
| U.S. industrial production | 1.0353 | 0.5528 | 5.0833 | |||
| (3.482) | (4.393) | (4.397) | ||||
| U.S. federal funds rate | 0.3628 | 0.2844 | -0.1997 | |||
| (0.249) | (0.377) | (0.284) | ||||
| Constant | 61.8253** | 57.4904* | 77.1543** | 35.2334 | 8.0808 | 4.6969 |
| (28.596) | (29.594) | (28.113) | (38.720) | (74.415) | (53.505) | |
| Observations | 487 | 487 | 503 | 487 | 487 | 503 |
| Number of industries | 21 | 21 | 21 | 21 | 21 | 21 |
| AR(1) in first differences | -2.735 | -2.802 | -2.824 | -2.823 | -2.834 | -3.016 |
| AR(1) in first differences p-value | 0.00624 | 0.00508 | 0.00474 | 0.00475 | 0.00459 | 0.00256 |
| AR(2) in first differences | -0.524 | -0.385 | -1.144 | -1.450 | -0.478 | -0.284 |
| AR(2) in first differences p-value | 0.600 | 0.700 | 0.253 | 0.147 | 0.632 | 0.776 |
| Hansen test of overid. restrictions | 8.958 | 8.732 | 9.795 | 6.334 | 10.26 | 4.607 |
| Hansen test of overid. restrictions p-value | 0.707 | 0.726 | 0.938 | 0.957 | 0.743 | 0.708 |
Notes: Robust standard errors in parentheses; level of significance: ***p<0.01, **p<0.05, *p<0.1
Table 3 Estimation results: Idiosyncratic and aggregate uncertainty variables
| Dependent variable: FDI | 1 | 2 | 3 | 4 | 5 | 6 | 7 | 8 | 9 |
|---|---|---|---|---|---|---|---|---|---|
| Economic and political uncertainty index for Mexico | |||||||||
| Unc 4:U nc − M ex − ecopol | -18.0238 | -16.2204 | -2.2488 | ||||||
| (19.264) | (14.162) | (12.435) | |||||||
| Unc 1:Firm’s eco. Situation in 12 months time | -0.2871*** | ||||||||
| (0.133) | |||||||||
| Unc 2:Country’s eco. situation in 12 months time | -0.1511* | ||||||||
| (0.085) | |||||||||
| Unc 3:Firms’eco. Situation to invest | -0.0328* | ||||||||
| (0.017) | |||||||||
| Overall policy - related economic uncertainty for the United States | |||||||||
| Unc 5:U nc − U s | -0.3494 | -0.0263 | -0.7048 | ||||||
| (1.019) | (0.646) | (0.698) | |||||||
| Unc 1:Firm’s eco. Situation in 12 months time | -0.3048* | ||||||||
| (0.174) | |||||||||
| Unc 2:Country’s eco. situation in 12 months time | -0.2446* | ||||||||
| (0.138) | |||||||||
| Unc 3:Firms’eco. Situation to invest | -0.0327* | ||||||||
| (0.017) | |||||||||
| Global risk aversion index (developed economies) | |||||||||
| Unc 6:Risk−Aversion | -0.8822** | -0.5366 | -0.7049** | ||||||
| (0.398) | (0.602 | (0.298) | |||||||
| Unc 1:Firm’s eco. Situation in 12 months time | -0.1359 | ||||||||
| (0.215) | |||||||||
| Unc 2:Country’s eco. situation in 12 months time | -0.1053 | ||||||||
| (0.159) | |||||||||
| Unc 3:Firms’eco. Situation to invest | -0.0167 | ||||||||
| (0.018) | |||||||||
| Controls1/ | ✓ | ✓ | ✓ | ✓ | ✓ | ✓ | ✓ | ✓ | ✓ |
| Observations | 487 | 487 | 503 | 487 | 487 | 503 | 487 | 487 | 503 |
| Number of industries | 21 | 21 | 21 | 21 | 21 | 21 | 21 | 21 | 21 |
| AR(1) in first differences - | -2.706 | -2.826 | -2.453 | -2.668 | -2.860 | -2.170 | -2.703 | -2.791 | -2.851 |
| AR(1) in first differences p-value: | 0.0068 | 0.0047 | 0.0142 | 0.0076 | 0.0042 | 0.0300 | 0.0069 | 0.0053 | 0.0044 |
| AR(2) in first differences: | -1.634 | -0.421 | -0.548 | -1.506 | -1.608 | -0.297 | -1.233 | -0.567 | -0.624 |
| AR(2) in first differences p-value: | 0.102 | 0.674 | 0.583 | 0.132 | 0.108 | 0.766 | 0.217 | 0.571 | 0.532 |
| Hansen test of overid. restrictions: | 5.521 | 11.960 | 7.045 | 13.910 | 8.753 | 12.720 | 10.970 | 10.210 | 8.005 |
| Hansen test of overid. restrictions p-value: | 1 | 1 | 1 | 0.998 | 1 | 1 | 1 | 0.994 | 0.999 |
Notes: Robust standard errors in parentheses; level of significance: ***p<0.01, **p<0.05, *p<0.1. 1/Controls include the following variables: FDI (lagged), Cash flow (lagged), Insecurity, Interest rate on Inflation Indexed Bonds, Real Exchange Rate, Exports/GDP, US Industrial Production, and US Federal Funds Rate.
3.3. Estimation results
Columns (1), (2) and (3) of Table 2 show the results from estimating Equation (1) without considering the proxy for trade openness and the U.S. economy related variables, while columns (4), (5) and (6) of the same table presents the findings with these additional variables. We mainly find that the coefficient of the uncertainty variables is negative and statistically significant (except for column (1) where the coefficient is not statistically significant), which suggests that an uncertain economic environment discourages FDI flows into the Mexican manufacturing sector. These results support the existing theoretical and empirical literature on irreversible investment presented in section two. We also find that cash flow has a positive and a statistically significant effect on FDI flows (except for column (3) where the coefficient is not statistically significant), which suggests that foreign investors do consider variables such as future demand growth and/or profitability when deciding whether to invest or not in the Mexican manufacturing sector. The results also show that the Mexican manufacturing sector becomes less attractive to foreign investors if insecurity levels increase. Nonetheless, these findings are not robust since this variable’s coefficient is not statistically significant, as seen in the last three columns of Table 2.
The rest of the domestic and external variables included in the model do not have a statistically significant effect on FDI flows. It seems that cash flow and uncertainty, which are more directly related to the microeconomic behavior of the manufacturing subsectors, are having all the impact on FDI flows.
3.4. Robustness tests
We re-estimate Equation (1) by incorporating additional uncertainty measures which we consider are more related to the economic and political situation of Mexico and/or of developed countries. The purpose of this second exercise is two-fold: 1) we assess which uncertainty proxies are more important in explaining FDI flows into the Mexican manufacturing sector, either the idiosyncratic uncertainty measures used before or, the new uncertainty proxies, which we consider may affect all manufacturing subsectors in general, and 2) we verify for the robustness of our results. In this sense, the new specification takes the form:
Where:
Idiosyncratic Uncertainty i,t stands for the uncertainty measures we used in the previous section and, that we consider may affect individual manufacturing subsectors (i.e. unc 1: Firms eco. situation in 12 months time; unc 2: Country’s eco. situation in 12 months time; and unc3: Firms’ eco. situation to invest). AggregateUncertainty t stands for the new uncertainty proxies, which we consider may affect all manufacturing subsectors in general. These uncertainty measures are the following:
Economic and Political Uncertainty Index for Mexico: This uncertainty proxy is built by Banco de México as the ratio of news found in Bloomberg containing the words “Mexico”, “uncertainty”, “economy” and “politics”, or “México”, “incertidumbre”, “economía” and “política” to the news found in this same source related to other topics.
Overall Policy-Related Economic Uncertainty Index: This index was built by Nicholas Bloom with data from Economic Policy Uncertainty (n.d.) using three components:
1) The news coverage about policy-related economic uncertainty consists on searching for articles in newspapers that contain the terms “uncertainty” or “uncertain”; “economic” and “economy”; “congress”, “legislation”, “white house”, “regulation”, “Federal Reserve” or “deficit”, which belong to the uncertainty, the economy and policy categories.
2) The tax code expiration data reflects “the number of federal tax code provisions set to expire in future years”.
3) The economic forecaster disagreement is based on the Federal Reserve Bank of Philadelphias Survey of Professional Forecasters, particularly on the forecasts of three variables which are directly influenced by the monetary and fiscal policies in the United States: the consumer price index; the purchases of goods and services by state and local governments; and the purchases of goods and services by the federal government. “The dispersion in the forecasts of these variables is treated as proxies for uncertainty about monetary policy and about government purchases of goods and services at the federal level”.
Global Risk Aversion Index: UBS publishes this index, which represents the historic percentile of a risk aversion coefficient γ of an investors utility function, who chooses how much of his/her resources to invest and/or to consume today. This γ is estimated by considering monthly returns on the MSCI Developed Markets Index and changes on the composite Developed Markets Purchasing Managers’ Index to proxy for demand swings.
Figure 3 shows the evolution of these three uncertainty measures, which we call aggregate measures. As we can see, the three series present different patterns, and they behave differently from the three idiosyncratic uncertainty measures presented in Figure 1. Therefore, it seems interesting to know how do the idiosyncratic and aggregate uncertainty measures affect the dependent variable.

The rest of the variables in Equation (2) remain as in Equation (1). Columns (1) to (9) from Table 3 show the results of this second estimation. We find that the coefficients of both the idiosyncratic and the aggregate uncertainty measures in all the specifications presented are negative, as expected. However, in columns (1) to (6) the coefficient of the idiosyncratic uncertainty measures is statistically significant, while that of the aggregate uncertainty measures is not. Columns (7) to (9) show a different story since the coefficient of the global risk aversion index is statistically significant, while that of the idiosyncratic uncertainty measures is not.
Overall, the results suggest that the idiosyncratic uncertainty measures seem to be more important in explaining FDI flows into the Mexican manufacturing sector than aggregate uncertainty measures which affect all manufacturing subsectors in general. Nonetheless, the aggregate uncertainty measure capturing global risk aversion seems to have an effect on FDI flows as well.
4. Quantifying the results
The previous exercises show evidence of how uncertainty may discourage FDI flows into the Mexican manufacturing sector. In order to assess the size of this negative effect, we conduct some simulations using specifications 4, 5 and 6 of Table 2 (one simulation per idiosyncratic uncertainty measure), under the assumption that uncertainty for each and every quarter during the period I/2010 - IV/2015 is equal to its registered level minus 1 percentage point.15
In other words, we build a counterfactual scenario for the FDI flows going into the Mexican manufacturing sector during the period I/2010 - IV/2015 by assuming that uncertainty for each and every quarter during the period I/2010 - IV/2015 is equal to its registered level in that period minus 1 percentage point. We then compare the counterfactual scenario with a base scenario in which the uncertainty variable takes its registered values, and the difference between both scenarios is finally attributed to the change in uncertainty.
Figure 4 plots the response of FDI flows to an increase in uncertainty, while Table 4 presents the simulated average (period 2010 - 2015) FDI flows in millions of dollars and as a percentage of the actual average (period 2010 - 2015) FDI flows. The findings show that if uncertainty (proxied by unc 1: Firm’s eco. situation in 12 months time, for example) for each and every quarter during the period 2010 2015 had been lowered by 1 percentage point, the Mexican manufacturing sector would have received, on average, an additional 714 million dollars (or an additional 4.6 percent of actual average FDI inflows) per year in the period 2010 - 2015. See Table 4. A similar interpretation could be associated to unc 2: Country’s eco. situation in 12 months time or unc3: Firms’ eco. situation to invest.

Table 4 Simulation results
| Scenario | Actual average FDI inflows (2010-2015), million dollars | Simulated average additional FDI inflows (2010-2015), million dollar | Simulated average additional FDI in-flows as a percentage of actual average FDI inflows |
|---|---|---|---|
| Unc 1: Firm’s eco. situation in 12 months time | 15,644 | 714 | 4.6 |
| Unc 2: Country’s eco. situation in 12 months time | 15,644 | 665 | 4.3 |
| Unc 3: Firms’ eco. situation to invest | 15,644 | 70 | 0.4 |
5. Conclusion
In this paper, we investigate the effect of uncertainty on FDI flows into the Mexican manufacturing sector over the period 2007-2015. To perform this analysis, we built uncertainty measures based on entrepreneurs/forecasters’ expectations about individual manufacturing subsectors’ and/or Mexico’s economic situation (which we call idiosyncratic uncertainty measures). Nonetheless, to verify for the robustness of our results, we also use uncertainty measures that affect all manufacturing subsectors in general and that are more related to the economic and political situation of Mexico and/or of developed countries (which we call aggregate uncertainty measures). In addition to these uncertainty measures, our estimated model also includes both domestic and external factors that we consider may encourage or hamper FDI. Our main results show that an increase in uncertainty discourages FDI flows into the Mexican manufacturing sector. These effects are in line with the theoretical and empirical literature on irreversible investment. We also find that the idiosyncratic uncertainty measures are more important in explaining FDI flows into the Mexican manufacturing sector than aggregate uncertainty measures. However, the aggregate uncertainty measure capturing global risk aversion seems to also have an effect on FDI flows.
Finally, in order to assess the size of the negative effect of uncertainty on FDI flows into the Mexican manufacturing sector, we perform some simulations under the assumption that uncertainty for each and every quarter during the period 2010-2015 is equal to its registered level minus 1 percentage point. The results indicate that if uncertainty (proxied, as an example, by unc1: Firm’s eco situation in 12 months time) for each and every quarter during the period 2010-2015 had been lowered by 1 percentage point, then the Mexican manufacturing sector would have received, on average, an additional 714 million dollars FDI flows (or an additional 4.6 percent of actual average FDI inflows) per year over the 2010-2015 period. The findings are relevant for any policymaker since they suggest that a stable macroeconomic environment should be maintained in a country in order to attract FDI flows and, therefore, promote economic growth.

