


 nueva página del texto (beta)
 Inglés (pdf)
 Artículo en XML
 Referencias del artículo
 Enviar artículo por email
 Citado por SciELO
  Similares en
SciELO
Similares en
SciELO 
 Permalink
Introduction
The public bike-sharing system (BSS) concept is a short-term bike rental network spread within an urban area and comprised of three main components: bicycles for rent that may be of different types (e.g. regular or electric); docking stations where bicycles are picked up and dropped off according to the user’s needs; and the information technology (IT) interfaces that provide information about the location of stations and the availability of bicycles (Martinez, Caetano, Eiro & Cruz, 2012). BSS is gaining popularity due to the rapid urbanization of major cities. Urbanization has increased traffic congestion and all of its associated externalities, for example the time wasted in traffic, extra fuel consumption and pollution, thus deteriorating the quality of life (Kumar, Teo & Amedeo, 2012; Rogat, 2009).
Bike sharing has emerged as an innovative and environmentally friendly solution for short-distance commutes (i.e. the first- and last- mile connection), a service usually not granted by other modes of public transportation (European Community Mobility and Transport, September 2016). The potential environmental, social, and transportation benefits associated with BSS include: 1) increased mobility; 2) economic gains associated with cost savings from modal shifts and increased tourism; 3) lower implementation and operational costs with respect to shuttle services; 4) reduced traffic congestion; 5) reduced use of fuel; 6) increased use of public transportation; 7) health benefits; and 8) greater environmental awareness (Shaheen, Cohen & Martin, 2013). However, despite these benefits, the effective and efficient management of BSS is challenging thus resulting in a new stream of research that has been studied from several disciplines’ perspective. In the operational research and business analytics literature, BSS research is intended to support major managerial decisions regarding the implementation and operation of these systems (Fishman, 2013; Shaheen & Lipman, 2007).
Vogel, Greiser and Mattfeld (2011) identify three main issues regarding the administration of a BSS according to the planning horizon: 1) strategic design of the system with decisions regarding the number and location of stations to be opened and the number of bicycles in stock per station; 2) tactical incentives provided to users to increase the number of bike trips and to leave bicycles in pre-specified stations, and 3) operational reposition of bicycles based on usage patterns and convenience. The aim of this work is to apply an optimization approach to the strategic design of a bike sharing system for the city of Leon, one of the largest and fastest growing cities in Mexico, located in the central state of Guanajuato. A mathematical model that determines the number and location of stations and the assignment of bicycles to stations, such that the approved cost of the BSS results in the largest reduction of CO2 emissions, is formulated and solved.
This paper is organized as follows. The next section reviews the literature on BSS strategic design. Section 3 describes the application case, while section 4 describes the bi-criteria optimization model. Section 5 analyzes competitive bike sharing systems that may be feasible to implement if municipal funding is augmented from a combination of state and federal sources. The final section presents conclusions along with academic and managerial implications.
Literature review
The reported experience with bike sharing programs has been used to define practical gui-delines for their design and implementation (Shaheen, Guzman & Zhang 2010; Toole Design Group, 2012). The practical guide of the US Department of Transportation (American Public Transportation Association Alliance for Biking & Walking, 2014; Toole Design Group, 2012, 2014) includes recommendations for the planning, implementation and evaluation stages of these programs. The objectives of the planning stage are to determine the optimal design of the system, estimate its operational costs and identify funding sources. Important issues at this stage include: a feasibility study that guarantees appropriate levels of usage (number of users and trips), coverage of the BSS (extension of the bike sharing network) and service quality (availability of bikes and slots at open station), and an assessment of how the BSS may be integrated into the public transportation network to improve the convenience of performing multi-modal trips (ITDP, 2011; ITDP 2018).
The design of the BSS involves critical decisions including the determination of the number and location of bicycle stations, the definition of the bicycle fleet size and the allocation of bicycles to stations. These decisions are subject to several restrictions and dependencies such as the predicted demand, the integration of the BSS to the public transportation network and the budget assigned to the project. Moreover, defining the number of stations and its distribution on a zone in terms of distance and positioning, the number of bikes per station, features of bikes and usage rules requires an ex-ante analysis. An extensive network of bicycle stations (i.e. a BSS with high coverage) may be the ultimate goal but given the high investment required, a secure, scalable and well-connected BSS with stations close to key locations is recommendable.
Angelopoulos, Gavalas, Konstantopoulos, Kypriadis, and Pantziou (2016) state that the strategic design of a BSS is linked to the Facility Location problem (FLP) because it involves the optimal location of bike stations to satisfy a certain objective (usually the cost of the system). However, the design of a BSS is more complex because of the hourly fluctuation of the demand, the dependence on the existing public infrastructure and the variability of the origin-to-destination journeys. The solution to the basic FLP, which corresponds to a mixed-linear programming problem (MIP), must provide the number and location of bike stations from a set of candidate sites given budget and demand constraints. Several extensions to the basic problem have been proposed and evaluated under specific contexts where data is available. For example, Lin and Yang (2011) consider the interest of investors and users, i.e. BSS costs and attention to origin-destination paths, to determine the number and location of bike stations, their capacity and the lanes required to properly connect the bike network in the city of Taiwan. While Nair and Miller-Hooks (2014) formulate the strategic design of BSS as a bi-level MIP, where the best locations of stations are selected first followed by the second best and so forth, the number of bicycles per station is defined given a set of economic restrictions.
Considering the size and complexity of the MIP problem of designing a BSS of convenient size, several authors have focused on the development of efficient algorithms to solve it (Gavalas, Konstantopoulos & Pantziou, 2016). Meanwhile, others authors have combined different quantitative methodologies like optimization techniques to determine the location of stations and then discrete simulation techniques to determine the total number of bicycles and parking lots per station (García-Gutiérrez, Romero-Torres & Gaytán-Iniestra, 2014). The location of bike stations has been improved by using Geographical Information Systems (GIS) and information about the potential demand given the situation of the bike stations (García-Palomares, Gutiérrez & Latorre, 2012). It has also been enhanced by incorporating empirical data regarding the usage patterns of existing BSS complemented by demographic information (Nair, Miller, Hampshire & Bušić, 2013).
Optimization techniques have been also applied to maximize the profitability of the BSS through the selection of the size of the bike fleet (Sayarshad, Tavassoli & Zhao, 2012). These methodologies have also been used to optimize the level of service and quality of the BSS through the best redistribution of bikes to stations (Alvarez-Valdes et al., 2016). Additionally, optimization has been employed to search candidate routes and stop points where vehicles must load or unload bikes to minimize the deviations from target fill levels per station and the total tour duration (Rainer-Harbach, Papazed, Hu & Raidl, 2013). The cost of running a BSS with almost empty or full stations may be considerable, but the availability of records of trips per station enables the analysis of activity patterns of bike usage. This can be used to improve the allocation of bicycles to correct the demand asymmetry among bike stations initially open (Lu, 2016). Martinez et al. (2012) show the importance of considering not only the cost of opening the stations and acquiring the bicycles, but also the cost of relocating bikes to the docking stations. The mathematical formulation proposed by these authors uses a heuristic to solve the resulting MIP problem where the relocation operations are considered as additional costs of the system but not explicitly included as decision variables.
Given the complexity of optimally designing a BSS, most of the previous work consider a single economic objective (maximize profits, minimize investment or operational costs), with only few works including multiple non-monetary objectives. Among those, there is the work of Lin and Liao (2016), who determine the spatial layout of a bikeway network by maximizing bikeway and station service coverage, maximizing bikeway suitability and minimizing cyclist risk. Objectives related to the environmental sustainability of urban transportation have received even less attention, despite the large contribution of transportation to global CO2 emissions (Wang, Sanchez-Rodrigues and Evans, 2015). Among the authors who have applied multi-objective optimization methods to address this issue, Harris, Naim, Palmer, Potter, and Mumford (2011) consider logistic cost and CO2 emissions in the strategic modeling of an automotive logistics network.
Our work aims to contribute to the research on environmental sustainability of urban transportation by assuming that, although municipal authorities are particularly concerned about the cost of BSS, they also care for the environment. Therefore, their final decision should focus on two goals. Thus, we formulate the problem of designing the BSS as a Mixed-Integer Linear Program with two objectives: minimize the total cost of the BSS’ implementation and maximize the potential reduction of CO2 emissions once the system is operational. In the formulation of the MIP problem we take advantage of the following two facts: a) potential locations of bike stations are initially defined in terms of the potential demand and its connectivity with the public transportation network, and b) the total capacity of the system (total number of bicycles available) has already been established by the municipal authorities given the available public funds.
In addition to its connectivity with other transportation systems, the BSS under design must satisfy the expected demand which is referred to as the “level of serviceability” of the system. This service level depends on the provision of a pool of bicycles across the network of strategically positioned bike stations (Ricci, 2015). In this work, it is measured as the proportion of pick-up requests that would be met with the available stock of bicycles. Given the budget restrictions, a minimum percentage of satisfied requests needs to be established to determine the number of stations and parking lots per station. A similar strategy has been applied by other authors such as Frade and Ribeiro (2015) and Lin, Yang, and Chang (2013).
The case study
Mexico is a highly urbanized and motorized country. Seventy percent of the population lives in cities and the increase in urbanization has resulted in a higher demand for urban transportation (ITDP, 2018). Motorized vehicles are the main mode of urban transportation. The International Bank for Reconstruction and Development & the World Bank (2009) estimate 24.59% of all journeys in the country are made by car. Meanwhile, the report of the ITDP (2018) establishes that 49.48% of the population in Mexico uses public transportation (mainly buses) and only 25.93% depends on non-motorized transportation for commuting. Bike sharing represents an affordable and environmentally friendly option for public transportation (Toole Design Group, 2012, p. 12). Therefore, some of the largest Mexican cities have implemented BSS, including Mexico City (ECOBICI) and Guadalajara (MIBICI).
The strategic design of a BSS is demonstrated in the city of Leon, the largest city in the state of Guanajuato, and the seventh most populated metropolitan area in Mexico. The focus on this city derives from its urban development and the interest of the local authorities in promoting the use of bicycles as an effective option for urban mobility. Currently, there are about 101 kilometers of bicycle lanes around the city and a recreational bike path around one of the main city parks (Parque Metropolitano), with an approximate length of 7 kilometers. In the early 2000s, the municipal government and the Municipal Institute of Planning of the city of Leon (IMPLAN, 2009a, 2009b) defined several strategies to encourage the use of bicycles in the city, and in 2009, feasibility studies were undertaken. The objectives of these studies were: (1) to create a database describing the conditions (comfort, quality of intersections and sign/bikeway signing, and security) of current bike lanes; (2) to identify the strengths and weaknesses of the current bike network; and (3) to analyze the current and future use of bicycles by residents. Meetings with key groups (industrial, commercial, political and civilian associations) and surveys with individuals connected with these groups were conducted to gather relevant information regarding biking potential demand. This information, along with an analysis of the mobility data indicate that the expected number of bicycle trips is going to increase significantly in the coming years. Based on this information, the IMPLAN proposed a “Bikeway Master Plan” that comprises the building of 303 km of bike lanes and 67 km of linear bike paths1 to encourage biking and support the implementation of a pilot BSS with eight stations and 20 bikes per station.
Methodology
The methodology to design the BSS comprised two main phases. Phase 1 includes the computation of the three key inputs or parameters of the optimization model, namely the potential demand per station disaggregated hourly because of its fluctuation throughout the day; the total cost of implementing and supporting the BSS during the first year; and the expected reduction in the amount of CO2 emissions in the first year of operation of the BSS. The second phase involves the formulation and solution of the bi-objective optimization model. The details of these two phases are described in the following sections.
Phase 1. Estimation of inputs of the optimization model
Computation of the expected demand per each potential station
The expected demand (total number of bicycle daily trips or equivalently total number of pick-up bike requests) was determined by making statistical analysis on primary data collected through a survey of residents in September 2015 (Gámez-Pérez, Arroyo-López and Cherry, 2017). The sampling frame was the geographical division of the city into 23 macro-areas defined in terms of their economic and/or topographic characteristics (IMPLAN, 2009a, 2009b). The potential demand at each area was computed as the total number of residents in the area multiplied by the estimated proportion of residents with a profile prone to using the BSS. This profile was determined as follows: individuals who do not have a bicycle, are currently employed and usually travel by bus with a low percentage of their trips completed by car. The estimated number of daily trips per individual is 2.26 and the duration of their trips ranges from 25 to 55 min (Gámez-Perez et al., 2017).
The criteria considered to select the geographical area of the BSS service (coverage of the system) are: potential demand above the global area average, availability of bike lanes and connectivity to public transportation stations (Tool Design Group, 2012; ITDP, 2011; ITDP, 2018). The last criterion is crucial because the improved coordination of bicycling and public transportation enhances the benefits of both modes and foster bicycling and the use of public transportation (Pucher & Buehler, 2012). Data from a study performed by the Leon Mobility Department (2011) was used to identify the main routes of the integrated transportation system (Optibus) to which the bike stations should be connected so that cyclists can make longer trips and overcome gaps in the public transportation network. Weather conditions and topography were not considered because they are irrelevant given the characteristics of the metropolitan area where the BSS will be operating. Additional areas next to those satisfying the three established criteria were also pre-selected provided they have an above-average percentage of inhabitants who have the cycling proclivity profile. This secondary selection was made to improve the connectivity of the BSS under design (Tool Design Group, 2012). Six macro-areas were preselected based on the expected potential demand and four were finally chosen after considering their connectivity and bike infrastructure.
The formulation of the optimization model considers a timetable of 16-hour periods per day. The hourly demand for bicycles at each station is determined by multiplying the average demand per hour by the corresponding index of pick- up requests. The set of indexes was computed by smoothing the hourly data of bike rentals reported for the bike sharing system of Mexico City (ECOBICI) over a period of 52 weeks, from February 1st, 2010 to February 1st, 2011, when the program was launched (ECOBICI, 2015). The time series exhibits the usual pattern reported for other metropolitan BSS: an increasing trend in the system usage along with hourly and daily seasonality (Ricci, 2015). The periods with the highest demand correspond to weekdays while the peaks of the hourly demand correspond to the school and work entry/exit times (Rogat, 2009). This data is an adequate reference to estimate the hourly demand because the mobility patterns are similar in all large Mexican cities due to the homogeneity of schedules of schools, government offices, and businesses. Because the BSS of Leon is going to be promoted as a transportation mode for non-recreational journeys, only the hourly data of weekdays was statistically filtered by using single moving averages. The resulting hourly indexes are reported in Table 1. Indexes above (below) 100 represent an increase (decrease) of the average hourly demand during that specific period.
Table 1 Hourly indexes of ECOBICI’s usage
| Hourly period | Hourly index | Hourly period | Hourly index |
|---|---|---|---|
| 6-7 | 55.50 | 15-16 | 121.41 |
| 7-8 | 121.37 | 16-17 | 105.18 |
| 8-9 | 127.98 | 17-18 | 127.82 |
| 9-10 | 89.67 | 18-19 | 128.66 |
| 10-11 | 88.34 | 19-20 | 101.75 |
| 11-12 | 93.57 | 20-21 | 74.98 |
| 12-13 | 109.53 | 21-22 | 46.26 |
| 13-14 | 142.75 | 22-23 | 14.07 |
| 14-15 | 151.06 |
Indexes were computed by smoothing the hourly data during weekdays.
Source: Author’s own.
The estimation of the total daily demand per area is detailed in Table 2. For example, in the specific are of San Isidro, 18.37% of the interviewees declared they will use the BSS. By multiplying this proportion by the total number of inhabitants in the area who have the official age to rent a bike, we obtain a potential demand of 8,274 users. However, once the BSS characteristics were explained in detail to the interviewees, only 10% of the initial users confirmed they would use the system. Therefore, a conservative estimate for the number of users in the San Isidro area is 827. Multiplying this number by the average number of trips per user (2.26 per day) yields a total of 1,870 projected cycling trips per day for this zone.
Table 2 Estimation of the daily demand per each geographical area of service of the planned BSS
| Zone | Residents willing to use the BSS | Number of residents above 18 years old | Number of potential users | Predicted number of confirmed users | Expected number of daily trips. |
|---|---|---|---|---|---|
| (100% sure) | |||||
|
|
|
|
|
|
|
Source: Elaborated based on the results of Gámez-Perez et al. (2017).
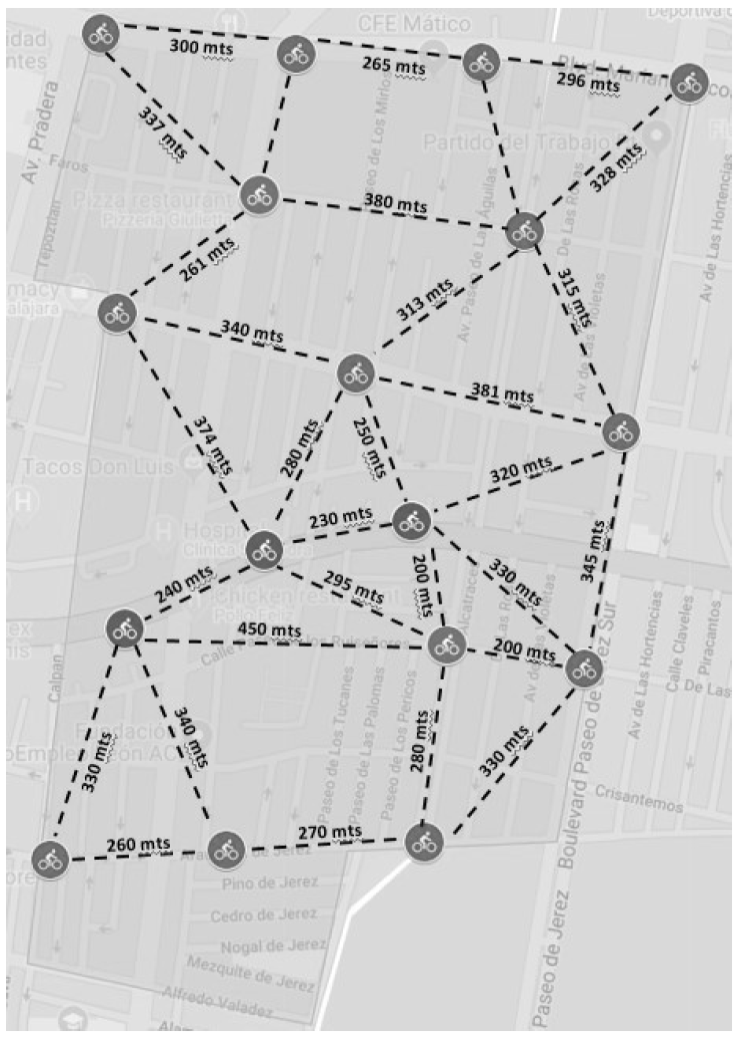
The BSS must be integrated into the public transportation network to provide access to final destinations (Pucher & Buehler, 2012). Thus, the model assumes that a potential user can take a bike at any of the station within the coverage area and move to another station where the bike can be parked, provided there is some space available (a proportion of around 50% bikes and 50% open docks is recommended for an optimum service). At the end of the day, all bikes are returned to their original station. Research indicates most people will walk no more than 0.8 km to commute, with a large drop-off beyond 440 m. But, the National Association of City Transportation Officials (NATCO, 2015, p. 2) states that BSS with high readership such as ECOBICI have stations placed no more than 300 m apart. Thus, the recommended distance between stations should be revised in terms of the users’ specific needs and preferences, as well as physical and financial considerations (Tool Design Group, 2012; American Public Transportation Association Alliance for Biking & Walking, 2014). Based on these recommendations, the potential location of bike stations, separated by no more than 300 m within a polygon of 1 sq. km defined by the location of public transportation posts, were determined with the aid of Google Maps and Google Earth (see Figure 1).
Estimation of costs of the BSS under design.
The total costs of the BSS under design include: the cost of constructing additional bike lanes; the cost of opening bike stations and the bike fleet; the cost of the equipment for maintenance and repair; the cost of the vehicles to use for the redistribution of bicycles; the management costs during the system’s implementation phase; the cost of a social marketing programs to promote bike sharing2 and legal costs. All these costs are computed based on the experience of other BSS implemented worldwide and supplemented with secondary information gathered by the IMPLAN (2009a, 2009b) and the financial analysis performed by Montezuma (2014) and Gerry (2012). The setup costs of enabling a station are shown in Table 3. The total fixed cost to open a station is broken down in Table 4.
Table 3 Set up Costs of enabling a bike station (USD)
| Price of a re-distribution vehicle | 25 000 |
| Price of a re-distribution trailer | 10 000 |
| Maintenance costs of the vehicle | 20 000 |
| Maintenance costs of the trailer | 10 000 |
| Marketing/Promotional expenses | 75 000 |
| Maps of bike dock locations | 5 000 |
| Cost of traffic barriers and other location-related expenses | 10 000 |
| Salary of the BSS general manager - 3 months prior to launch | 5 880 |
| Salary of the operation manager - 3 months prior to launch | 13 650 |
| Cost of creation of a Website | 42 000 |
| Costs of maintenance equipment - 1 month prior to launch | 3 780 |
| Legal costs | 5 000 |
| Total Set up costs | 225 310 |
Source: Montezuma (2014) and Gerry (2012).
Table 4 Fixed Costs of enabling a docking station (USD)
| 15 stations and a total of 375 bicycles | 10 stations and a total of 250 bicycles | 8 stations and a total of 200 bicycles | |
|---|---|---|---|
| Cost of bicycles | 401 250 | 267 500 | 171 200 |
| Cost of setting up stations and docks | 450 000 | 300 000 | 200 000 |
| Shipping costs | $34 000 | 34 000 | 30 000 |
| Cost of the system cards | 1 031 | 688 | 550 |
| Taxes | 141 805 | 96 350 | 62 480 |
| Total cost of the equipment | 1 028 086 | 698 538 | 464 230 |
| Total set-up costs (see details in Table 5) | 225 310 | 225 310 | 225 310 |
| Total Fixed Costs (Fj) | 1 253 396 | $923 848 | $689 540 |
| Fixed Costs per station (Fj) | 83 560 | $61 590 | $86 192 |
Source: Montezuma (2014) and Gerry (2012).
Table 5 Estimated Operational Costs per trip during a year (USD)
| Type of cos | Annual operational cost | Annual operational cost per trip |
|---|---|---|
| Holding costs | 50 317 | 23.50 |
| Variable operational costs | 246 683 | 115.20 |
| Relocation costs at the end of the day | 33 000 | 15.40 |
| Annual operational cost | 330 000 | 154.10 |
Source: Gerry (2012), Martinez et al. (2012) Montezuma (2014).
The total cost of the extra bike lanes required in the planned bike sharing network is computed as the weighted average of the costs of constructing bike paths of three different types (basic, two-way 1.80 wide and path-walker indoors 5 m wide). The weights are defined as the percentage of bike lanes of each type that are usually built according to the recommendations of the National Association of City Transportation Officials (NATCO, 2014) and acknowledged by the IMPLAN. Based on these references, the average cost of enabling a bike lane, used as input in the optimization model, is estimated to be 95.7 USD/m. Additionally, it is important to notice the model does not entail 100% connectivity for every pair origin-destination because it implies an unaffordable cost. The new bike lanes to be built only assure connectivity between all potential bike stations and with the major transportation hubs in the city. Furthermore, the model does not consider any extra cost if there exist bike lanes or there are streets that may be easily modified (e.g. they are wide enough) to enable a bike lane or a walking boulevard to access a transportation hub. Figure 2 depicts the location of the planned bike lanes of the pilot BSS designed by the IMPLAN as part of the “Bikeway Master Plan.” To define the cost of a new bike lane, we perform an analysis of the operating characteristics of the current roads and identify if new bike lanes are required and their length (km), if that is the case, the cost of enabling them is added.
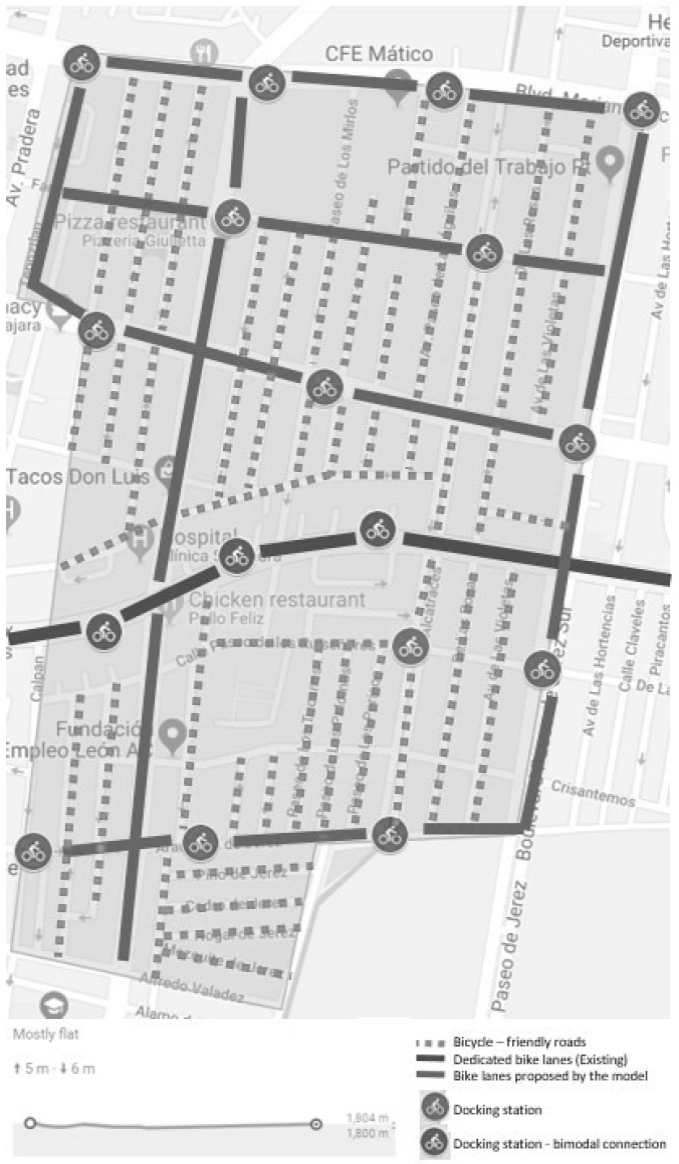
Source: Author’s own.
Figure 2 Current Bike lanes and new bike lanes required to connect potential bike stations
Finally, the operational costs per station during the first year of the BSS implementation are detailed in Table 5. It is important to notice that relocation costs were incorporated into the model as a static operational cost. The formulation of the model implicitly assumes that a target state per station -specified as number of bicycles and available bike lockers equal to at least half of the station capacity at each time period (Rainer-Harbach et al., 2013)- is attainable given the origin-destination arrays and a pricing strategy to incentivize users to return bikes to the least loaded station among the closest ones. Under the assumption of self-balancing of the system, the cost of repositioning bicycles to their original stations to bring the system to its initial state at 6 am only applies at the end of the day. This cost is estimated on the basis of the experience of bike sharing systems already in operation and corresponds to about 30% of the total operational costs (Martinez et al., 2012). A finer optimization of these costs requires the system to be in operation to observe its actual auto-balance patterns and then use simulation-optimization techniques to propose a relocation timetable. In this work, the design phase of the BSS is at the strategic level, that is the objective is to define the number of stations, their location and size (Alvarez-Valdes et al., 2016). The tactical and operational phases of the BSS design, that call for determining the number of bicycles per station and the bike-repositioning policy, are not addressed in this work. All cost sources and the final estimation of the overall cost of the BSS implementation was qualitatively validated against the projected expenditures of the IMPLAN and the experience of Mario Delgado-Padilla, who is the executive director of “MIBICI Guadalajara”, a bike sharing program with a coverage area that includes the county of Zapopan. This county has a sociodemographic and growth profile similar to the metropolitan area of Leon.
Systems of different coverage and capacity (small to medium-sized), that can operate under a nonprofit administration model and within the government’s budget, were analyzed to assess the extent to which they will fulfill the expected demand. After several interviews and discussions with the municipal authorities, we defined three scenarios: a) a pilot BSS that corresponds to the BSS initially projected by the IMPLAN, this system comprises a maximum of 8 stations with 20 bikes per station; b) an acceptable BSS, this system has moderate increase of capacity (maximum 10 stations with 25 bike slots per station) and represents an increment of at most 20% of the original budget; and c) an optimistic BSS (maximum of 15 stations with 25 bikes per station) that represents an increment of no more than 40% of the pilot BSS. The evaluation of these scenarios is the first step of the compensatory process between the cost of the BSS, its social and environmental impact. The tradeoff between the cost and the serviceability of the BSS is assessed through the scenario analysis. Serviceability is a proxy of the social impact of the system because bike sharing becomes a socially equitable and alternative mode of urban mobility only if there are bikes and bike slots available when users need them.
The total capacity of the pilot BSS outlined by the municipal authorities is at most 160 bikes. Our analysis indicates that this pilot system would not satisfy the expected demand, only about 20% would be fulfilled. Moreover, none of the larger systems will fulfill the expected demand. Therefore, an additional cost, associated with the number of unsatisfied pick-up requests, is included in the mathematical model to increase awareness of the authorities about the potential impact of the low service level of the system under design. The penalty cost of the unsatisfied demand is computed as the opportunity cost of not having an available bike when it is required by the user which is equivalent to the cost of a “lost sale”. This cost was estimated by dividing the annual expected revenue of 12,000 USD (Gerry, 2012) by the number of unmet pick-up requests, resulting in a cost of 1.70 USD per lost trip. The revenue lost underestimates the cost of unsatisfied requests but assigning costs to the consequences of bike unavailability is difficult because this cost includes the disutility of walking to another station, the loss of confidence in the reliability of the BSS and the possible disinterest in adopting bike sharing as a transportation mode. Thus, the refinement of the opportunity cost is an issue to be considered at the operational level of BSS design once data is available.
Assessment of the BSS environmental impact
The estimation of the reduction in the total amount of CO2 emissions per year once the BSS is operating defines the second objective function of the optimization model. The expected reduction factors in CO2 emissions (g/pax-km) for different modes of transportation are the basis to estimate the expected reduction in CO2 emissions. These reduction factors are computed as the product of the amount of CO2 emissions produced by different transportation modes by the percentage of replacement of each mode with cycling. The percentages of replacement used to perform the computations are derived from the experience of other BSS city cases (Midgley, 2011; Cherry, Weinert & Xinmiao, 2008) but may be refined once the BSS is launched and actual data becomes available (evaluation stage). To simplify the model formulation, a weighted reduction factor in CO2 emissions is computed using the replacement percentages of each mode of transportation as weights. The use of this weighted reduction factor is valid as long as the mobility of other modes of transportation is not affected, for example by removing public bus lanes to dedicate them to bicycles or expand roads with the consequent increase of traffic flow.
Phase 2. Formulation and solution of the bi-objective optimization model
The mathematical model formulated in this work determines how many stations should be open given the specified upper bound, and where they should be located considering two criteria, the total cost of the BSS and the reduction of CO2 emissions, while assuring a specified level of service and the restriction in the size of the bike fleet. The two objectives are in conflict because a larger BSS involves a higher cost but increases the chances of replacing motorized transportation modes and in consequence results in a larger reduction in CO2 emissions. A network covering San Isidro, the area of with the largest expected demand, was selected to show how the model works:
Subscripts and sets
| i ∈ I denotes the origins, | I = {1,…,n} |
| j ∈ J denotes the destination, | J = {1,….,n} |
| k ∈ K denotes the BSS service hourly periods (from 6 to 23 hrs) | K = {1,…,17} |
1. Input Parameters
a ijk : Daily demand, trips from origin i to destination j at hour k
d ij : Distance in meters from origin i to destination j
F j : Fixed USD cost of locating a bike station j
C ij : Fixed USD cost of constructing a bicycle lane connecting bike station i and j. The cost is equal to 0 if there already exists a bicycle lane between station i and j
E ij : Indicator Matrix equals 1 if a bike lane already exists between i and j or i = j, and 0 otherwise.
capstat j : Number of racks available at each station
h: Bike holding cost per day.
R: Percentage of the demand that is satisfied by each bike station of the BSS depending on the availability of bicycles at the station,
C1: Unit operational cost
C2: Unsatisfied demand cost
C3: Cost of the relocation of bicycles at the end of the day to their original stations
w: Maximum number of stations to be open
φ: Total number of bikes per BSS scenario (375, 250, 160)
β: The minimum percentage of the total expected demand to be satisfied by the BSS depending on its overall capacity,
Decision variables
X j : Equals 1 if bike station j is opened, 0 otherwise
Y ijk : Number of pick-up requests (trips) served from origin i to destination j at hour k.
W ijk : Unsatisfied trips served from origin i to destination j at hour k.
Z ij : Equals 1 if a bicycle lane is required to be connected between bike stations i and j; and 0 otherwise
disp jk : Number of bikes available at the station j at hour k
S ijk : Binary variable ensuring no allocation of demand in a non-open station
nrep j,17 : Number of bicycles to relocate at the end of the day
The mathematical model
Subject to
The first objective function F1 (1a) represents the total cost of launching the BSS and is comprised of six terms. The first term is the total traveling costs computed as the sum over all origin-destinations and times. This cost is a result of the subsidies to the BSS. Users will ride for free in the case of short trips (less than 30 min) and will pay an incremental fee for each additional quarter hour. This pricing strategy does not cover all operational costs but encourages bike sharing for short trips and increases the turnover of bikes, thus increasing the probability that stations will have a sufficient number of bikes to meet demand (Tool Design Group 2012, 2014). The second term in F1 is the sum of the setup costs for the bike stations. The third term is the total cost of building the extra bicycle lanes that integrate the bike network. The fourth term is the sum of the penalty costs of the unsatisfied demand. The fifth term corresponds to bicycle stock costs. Finally, the sixth term is the cost of returning (relocating) the bicycles to their original station at the end of the day. The second objective function F2 (1b) declares the annual reduction in CO2 emissions which is equal to the product of the expected number of annual bike trips by the average distance of a bike trip (computed from the origin-to-destination matrix) multiplied by the reduction factor of CO2 emissions.
The first constraint declared in Equation (2) ensures that bicycle lanes would exist to connecting points i and j. The constraint of Equation (3) is a flow conservation condition that determines the number of bicycles available at each station in each hourly period. Constraint (4) states the total number of bicycles available for the entire system which varies by BSS scenario. Constraint (5) assures that the number of bikes available does not exceed the capacity of the station (number of racks). Constraint (6) indicates the number of bikes that must be relocated to each station by the end of the day. Constraint (7) takes into account the demand of bikes, either it is satisfied (first term of the equation) or it is assigned to a non-satisfied demand variable (second term). Constraints (8) and (9) guarantees trips will not be assigned between stations i and j if they are not open. Constraint (10) assures that the percentage of the demand at station j is satisfied with the available number of bicycles at the station during the kth-hourly period. Constraint (11) guarantees that the total number of stations to be open does not exceed the stated upper bound. Constraint (12) states that there must be a bike lane connecting stations i and j if they are open, while constraint (13) ensures that a bike lane will be built if stations i and j are open and there is no existing bike lane connecting them. Constraint (14) warranties that a minimum percentage of the total expected demand will be satisfied by the BSS under design. Equation (15) is the integer condition imposed on the location and bicycle lanes variables. Finally, Equations (16) (17) and (18) apply to the binary variables.
A nontrivial multi-objective optimization problem has no single solution because the objective functions are in conflict. Thus, the usual aim of multi-objective optimization is to approximate the Pareto front with an efficient set of solutions. These non-dominated, Pareto optimal or non-inferior solutions cannot improve the value of an objective function without worsening the value of other(s) objective function(s). Unless decision-makers declare some preferences or are willing to make trade-offs between the multiple objectives or criteria, all Pareto optimal solutions are equally good. Regarding the bi-objective optimization model proposed in this study, any improvement in the environmental benefit expected from the BSS can only be achieved if municipal authorities identify and secure extra funding. To approximate the Pareto front, the best-known approach is the ε-constraint method (Ehrgott & Gandibleux, 2002). For large problems (e.g. many objectives), this method is integrated with heuristics. However, the relative simplicity of the bi-objective optimization model formulated in this work, allowed to outline the Pareto front with the ε-constraint method using GAMS 22.9 and solver CPLEX (Mavrotas, 2013).
Discussion of results
Table 6 reports the ideal solution to each objective function under the three BSS scenarios previously proposed. In all cases, the number of stations to be open equals the upper bound defined. When analyzing the percentage of the demand that would be satisfied by each BSS, it is evident that the original BSS pilot project must be expanded to provide appropriate levels of coverage and serviceability. Otherwise, there is a potential risk that users feel discouraged to use the system, thus preventing that bike sharing is accepted as an alternative mode of urban mobility. Additionally, the entries of Table 6 evidence that a larger investment is required to achieve a meaningful environmental benefit, namely a larger reduction in CO2 emissions. After these analysis, municipal authorities agreed to make tradeoffs between the cost, serviceability and environmental impact of BSS and resolved to conduct a detailed evaluation of the largest BSS (optimistic scenario) that may be implemented solely with public funds. Participants of the Institute of Ecology of Guanajuato were invited to evaluate the characteristics of alternative BSS to have a wider point of view about its benefits.
Table 6 Summary of the characteristics of alternative bike sharing systems
| Single Objective | BSS Characteristics | BSS Dimensioning | ||
|---|---|---|---|---|
| Optimistic | Acceptable | Pilot system | ||
| Maximize reduction of CO2emissions | Percentage of expected demand that will be satisfied | 60.13% | 32% | 20.5% |
| Expected reduction in CO2 emissions | 3 696 935 | 218 270 | 139,795 | |
| (g/pax-m per year) | ||||
| Minimize total cost of the BSS | Percentage of expected demand that will be satisfied | 50.02% | 28.30% | 18.5 % |
| Total Cost (USD per year) | $7 223 045 | $3 105 480 | $2 181 496 | |
Source: Author’s own.
The Pareto frontier of the optimistic scenario is outlined with the ε-constraint method. The points of the maximum tradeoff between the two objective functions are graphically shown in Figure 3 and numerically disclosed in Table 7. As expected, the BSS with the lowest cost (USD 5 529 154) represents the lowest annual reduction in CO2 emissions (3 176 060 g /pax-m). In contrast, the greatest reduction in CO2 emissions (3 696 935 g / pax-m) is achieved at the highest cost (USD 7 223 045). Only the points that correspond to the most significant changes in the two criteria are shown in the figure.
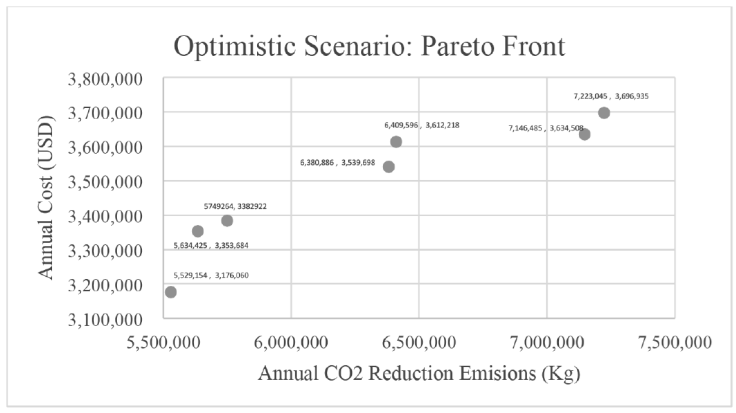
Table 7 Pareto Front Points: Optimistic scenario
| Point | Costs | CO2 Reduction emissions (Kg) | Yijk: Demand served from origin i to destination j at hour k (trips) | Wijk: Non-satisfied demand served from origin i to destination j at hour k (trips) | Percentage of the expected demand satisfied |
|---|---|---|---|---|---|
|
|
|
|
|
|
|
Source: Author’s own.
When analyzing the information of Table 7, the decision-making team recognizes that the predominant costs of the BSS are related to building the infrastructure, which is a one-time investment. Once the optimistic system is operating, adding more bicycles per station would satisfy a greater fraction of the demand within the area of coverage. In contrast, if the pilot BSS is implemented, its expansion would require opening new stations and constructing additional bike lanes. Obtaining the financial resources for such expansion is judged more difficult than adding more bikes to an existing network of well-connected stations (Toole Design Group, 2012). Therefore, the optimistic BSS was ratified as the best option because it satisfies a larger fraction of the forecasted demand, conveys a more significant environmental benefit and may be more easily expanded. However, public funds -the municipal budget already assigned to the project and the state funds that can be obtained- are limited. Considering this economic bound, decision makers agree options 4 and 5 of the Pareto Front are appropriate to present as a joint project of the IMPLAN and the Institute of Ecology.
Conclusions
Urban cities are attractive because of the concentration of jobs and the accessibility to products and services. However, living in large metropolitan areas also involves personal risks to health and wellbeing. According to the principles of sustainability, urban planning should pay greater attention to the design of projects that improve the livability of cities. Among them, the provision of a safe and efficient public transportation system is indispensable. Given that public resources must be distributed among several urban projects, cost is a common criterion used to define the feasibility and scope of a transportation project. However, transportation planning requires the consideration of social, economic, political and environmental issues as well. In the specific case of the design of bike sharing systems, research has been mainly dominated by economic criteria such as minimizing the initial investment and operational cost of the system. In this research, we consider other meaningful criteria by means of the evaluation of scenarios corresponding to three BSS of different capacity and serviceability, and the formulation of a bi-criteria optimization model that explicitly includes cost and reduction of CO2 emissions as objective functions.
The design of the BSS is at the strategic level, the objective is to determine the number of bike stations, their location, and size. Potential locations are defined on the basis of their proximity to public transportation centers, the current road infrastructure of the city of Leon and the cost of enabling additional bicycle lanes. The bound to the number of bike stations and the maximum size of the bicycle fleet were defined in collaboration with the municipal authorities in terms of the available budget assigned to public transportation projects. The evaluation of the service quality of three scenarios corresponding to BSS of different capacity (number of stations and the total number of bikes) drive decision makers to revise their initial plan of the pilot BSS. The assessment of the percentage of the expected demand that will be fulfilled by the pilot BSS and the introduction of a proxy cost of unsatisfied bike requests, led authorities to reconsider the initial project and follow a more sustainable approach to design the BSS. Decision makers recognize the need to make tradeoffs between the cost of the project, its social impact - indirectly measured by the serviceability of the BSS which is strongly correlated to the system becoming a regular mode of transportation- and its environmental benefits -estimated as the reduction in CO2 emissions-.
The analysis of the non-dominated solutions obtained by using the ε-constraint method, programmed with the commercial software GAMS 22.9, allowed the simultaneous evaluation of the cost and environmental benefit of a public bike sharing scheme. The analysis of the Pareto-optimal solutions of the bi-criteria optimization model demonstrates decision makers that a larger reduction in CO2 emissions may be attained at an acceptable cost. Furthermore, the investment in a BSS with more stations, well integrated into the transportation system of the city, may be more attractive to users and expanded more easily in the future because new bike lanes have already been built. The evaluation of tradeoffs related to the design of bike sharing systems involves stakeholders with different perspectives and priorities. Therefore, the use of multi-criteria decision-making methods provides an objective basis for the evaluation and adjustment of the particular objectives of distinct governmental institutions. In this study, only two criteria were considered, being serviceability a subordinate criterion managed via scenarios.
The financial and administrative restrictions defined by the city’s authorities simplified the mathematical modeling and solution of the bi-objective optimization problem proposed. However, the design of a BSS of a larger capacity and the consideration of multiple objectives (economic, social and environmental) opens the opportunity for a new stream of research in terms of the proposal of efficient multi-objective optimization algorithms, such as evolutionary and metaheuristics. Other relevant extensions of this research include: 1) the definition of dynamic relocation policies that consider the relocation costs and the user’s cost of an unsatisfied bike request/return; 2) the integration of the bike network to public transportation systems which are in continuous expansion and 3) the incorporation of decision maker’s preferences into the multi- objective optimization procedure to facilitate the selection of a final alternative, especially in the case where DM’s priorities diverge.
Regarding managerial implications, the design process of the BSS applied in this study shows how the public transportation infrastructure of a large Mexican city, the strategic transportation plans of the municipal government and the priorities of different governmental institutions (IMPLAN and the Institute of Ecology in this case) may be consolidated to design a bike sharing program. The combination scenario analysis and the use of bi-criteria optimization methods may be useful to design a BSS for other major cities in Mexico. Nevertheless, this would only be feasible provided primary data about the potential demand and structure of the public transportation network are available. Also, governmental authorities must be willing to collaborate with academics and open their perspective to consider sustainability criteria in addition to costs.
This research is not without its limitations. Currently, the model only considers a static cost of repositioning the bicycles and sets the number of bikes available per station to at least half of its capacity at each hourly period of service. Also, the cost of unsatisfied demand is simply computed as a profit loss without evaluating the consequences that bike unavailability has on the acceptance of the bike sharing system. Additionally, the number of unsatisfied pick-up requests or serviceability of the system is not explicitly included as optimization criteria but managed through scenario analysis. These limitations may be addressed by formulating and solving more complex multi-objective, bi-level optimization problems. Another limitation of this research is that the hourly usage rates of the system and the potential reduction in CO2 emissions are based on secondary data recorded from bike sharing programs implemented in Mexico City, and Asian or European cities. Once the system is launched and actual information about hourly demand patterns becomes available, for example through GPS-booking data of the BSS, all the inputs of the model may be revised. Nonetheless, this research describes the information that must be recorded to solve the proposed mathematical model and to formulate more complex models that support cities authorities’ decisions regarding the strategic, tactical and operational design of bike sharing systems for large Mexican cities.

