


Servicios Personalizados
Revista
Articulo
 Inglés (pdf)
 Artículo en XML
 Referencias del artículo
 Enviar artículo por email
Indicadores
-
 Citado por SciELO
 -
 Accesos
Links relacionados
-
 Similares en
SciELO
Similares en
SciELO
Compartir

 Permalink
Ciencias marinas
versión impresa ISSN 0185-3880
Cienc. mar vol.39 no.4 Ensenada dic. 2013
Evaluation of nitrogen sources in the Urías lagoon system, Gulf of California, based on stable isotopes in macroalgae
Evaluación de las fuentes de nitrógeno en el sistema lagunar de Urías, golfo de California, mediante el uso de isótopos estables en macroalgas
María Julia Ochoa-Izaguirre1,2, Martín Federico Soto-Jiménez3*
1 Posgrado en Ciencias del Mar y Limnología del Instituto de Ciencias del Mar y Limnología, Universidad Nacional Autónoma de México, Unidad Académica Mazatlán, Apdo. postal 811, Mazatlán 82040, Sinaloa, México.
2 Facultad de Ciencias del Mar, Universidad Autónoma de Sinaloa, Paseo Claussen s/n, Apdo. postal 610, Mazatlán 82000, Sinaloa, México.
3 Instituto de Ciencias del Mar y Limnología, Universidad Nacional Autónoma de México (UAM-ICMyL-UNAM), A. P. 811, Mazatlán 82040, Sinaloa, México. * Corresponding author. E-mail: martin@ola.icmyl.unam.mx.
Received January 2013,
received in revisedform November 2013,
accepted November 2013.
ABSTRACT
The concentrations of chemical forms of nitrogen (N) and their isotopic composition in the water column and the δ15N signals in 738 samples of macroalgae collected during one year across the Urías lagoon system (Mazatlán, Sinaloa, Mexico) were analyzed in order to study the N sources. The δ15N-macroalgae premise is that they register and integrate the variability of N and may provide time-integrated information about N pollution. To validate this premise, we applied two models to predict the isotopic variability of N available in the water column (δ15N-DIN): one is based on a physical mixing balance of N sources (simple model), and the second includes the effects of the biogeochemical processes on the signals (coupled model, CM). Both models showed significant R2, but CM better explained the δ15N-DIN variability. The relation between δ15N-DINCM and δ15N-macroalgae also showed a good fit, although lower than expected and with higher dispersion. The multiple N sources and co-occurring biogeochemical reactions, which produce a mixture of chemical species of N and of their isotopic compositions, as well as the high diversity of species (45) explained the elevated variability and lack of fit. Even so, δ15N in macroalgae is the most useful available tool to quantify the relative contributions of N to ecosystems from different sources. Based on Bayesian isotopic mixing models, the main anthropogenic sources of N to the Urías lagoonal system were domestic effluents (50%), atmospheric deposition (24%), and seafood processing plant effluents (21%), and to a lesser extent, aquaculture effluents (3%), agriculture runoff (1%), and oceanic N (1%).
Key words: δ15N, eutrophication, biogeochemical cycle, NLOAD model, MixSIR.
RESUMEN
Las concentraciones de las formas químicas de nitrógeno (N) y su composición isotópica en la columna de agua y las señales de δ15N en 738 muestras de macroalgas recolectadas durante un año en el sistema lagunar de Urías (Mazatlán, Sinaloa, México) fueron analizadas para estimar las fuentes de N. La premisa sobre el uso de δ15N en macroalgas es que las macroalgas asimilan δ15N en proporción a la disponibilidad y reflejan la fuente de N de una manera predecible. Para validar esta premisa, se aplicaron dos modelos para la predicción de la variabilidad isotópica del N en el agua (δ15N-NID): el primero se basa en una mezcla física de las fuentes de N (modelo simple), y el segundo integra los efectos de procesos biogeoquímicos sobre sus señales isotópicas (modelo acoplado, MA). Ambos modelos mostraron valores de R2 significativos, pero el MA explicó mejor la variabilidad del δ15N-NID. La relación entre δ15N-NIDma y δ15N-macroalgas también mostró un buen ajuste, aunque menor al esperado y con una alta dispersión. Las múltiples fuentes de N y reacciones biogeoquímicas concurrentes, que producen una mezcla compleja de especies químicas de N y de sus composiciones isotópicas, además de la alta diversidad de especies (45), explicaron la elevada variabilidad y la falta de ajuste. Aun así, la técnica de δ15N en macroalgas es la herramienta más útil que existe para cuantificar las contribuciones relativas de N a los ecosistemas derivadas de diferentes fuentes. Con base en la resolución de ecuaciones de mezcla isotópica por estadística Bayesiana, las principales fuentes de N antropogénico en el sistema lagunar de Urías fueron los efluentes domésticos (50%), el depósito atmosférico (24%), los efluentes del procesamiento de productos pesqueros (21%) y, en menor proporción, los efluentes acuícolas (3%) los escurrimientos agrícolas (1%) y N oceánico (1%).
Palabras claves: δ15N, eutrofización, ciclo biogeoquímico, modelo NLOAD, MixSIR.
INTRODUCTION
Nitrogen (N) is considered the nutrient that most frequently limits primary productivity in coastal waters (Nixon 1995). Anthropogenic activities have increased N inputs to coastal ecosystems and thus altered the biogeo-chemical cycles in these ecosystems with environmental and ecological consequences (McClelland and Valiela 1998, Savage 2005). Over the past few decades, the natural availability of N in coastal ecosystems of the Gulf of California (Mexico) has changed due to the substantial increase in human-caused N deposition (Soto-Jiménez et al. 2003a, Piñón-Gimate et al. 2009). The Urías lagoon system is one of the ecosystems most affected by anthropogenic N inputs, as evidenced by the progressive eutrophication (Ochoa-Izaguirre et al. 2002).
Stable N isotopes (14N, 15N) in macroalgae have become a useful tool for identifying N sources in coastal ecosystems (e.g., Deutsch and Voss 2006, Dailer et al. 2010, Kaldy 2011, Ricaurte-Villota et al. 2013). The basic premise of the method is that the 15N of exposed macroalgae reflects the N source in a predictable manner (Cohen and Fong 2005). In this study, we quantified the N sources to the Urías lagoon system (Mazatlán, Sinaloa, Mexico) and measured their chemical and isotopic compositions, and related them to the spatiotemporal variation of the concentrations and chemical forms of N in the water column. We also compared the variations in the isotopic composition of N in water with those recorded in macroalgae from the same ecosystem.
MATERIALS AND METHODS
Study area
The Urías lagoon system is located at the entrance to the Gulf of California (fig. 1) and covers an area of 1800 ha (Montaño-Ley et al. 2008). The region has a tropical-subtropical climate and three seasons: rainy from July to October, dry-cold from November to April, and dry-warm from May to June. The lagoon system has three different habitats classified according to salinity: lagoonal habitat (LH, saline [salinity < 30] and hypersaline [salinity > 36]), lagoonal-marine habitat (LMH, salinity of 30 to 34), and marine habitat (MH, salinity of 35 ± 1).
The three habitats (fig. 1) can also be associated with the diverse human activities carried out in the area: (1) the upper zone, LH, which is covered by mangroves and influenced by tide channels, receives greater freshwater inputs from streams and agricultural lands (8100 ha), as well as aquaculture effluents (>400 ha) and domestic wastewater discharges; (2) the intermediate zone, LMH, which comprises most of the system and is where the Mazatlán thermoelectric power plant (capacity of 600 MW) and fishing boat docks are located, receives the effluents discharged by seafood processing plants (tuna canning, fishmeal production, shrimp freezing), domestic wastewater discharges (partially and untreated sewage of close to 170,000 inhabitants), and rainfall runoff from one third of the Mazatlán area; and (3) the marine zone, MH, which includes the mouth of the navegation channel (where tourist, merchant, and fishing vessels concentrate) and adjacent offshore waters, receives atmospheric deposition resulting from the emissions from fossil fuel combustion in vehicles and from the thermoelectric plant.
Collection of samples
Effluent, water column, and macroalgal samples were collected monthly from February 2009 to March 2010 at 20 sites. At each site, we collected 5 to 6 specimens of each species of macroalga found and 4 L of seawater and effluent. A total of 738 macroalgal specimens and close to 250 water and effluent samples were obtained. In situ temperature (T), salinity (S), dissolved oxygen (DO), and pH measurements were taken with a YSI 6600V2 sensor. The residence time (τ) of water in the lagoon system was also modelled (Montaño-Ley et al. 2008).
In the laboratory, the water and effluent samples were filtered through nitrogen-free Whatman GF/F filters (0.70 µm). The filtered water was examined for total dissolved nitrogen (TDN), by complete oxidation to nitrates following Grassoff et al. (1983), and for ammonium (NH4+), nitrate (NO3-), and nitrite (NO2-), according to the methods described by Strickland and Parsons (1972). Dissolved inorganic nitrogen (DIN) was obtained by adding the concentrations of NH4+, NO3-, and NO2-, whereas dissolved organic nitrogen (DON) was calculated as the difference between TDN and DIN. The detection limits were 0.6 µg L-1 for NH4+ and 1 µg L-1 for NO3- and NO2-, with a coefficient of variation of 12.4-15% for all three. Since the concentration of NO2- represents a very small fraction of DIN, it was added to that of NO3-.
Depending on the dominant inorganic N forms in the filtered effluent and water samples, NO3- and/or NH4+ were isolated by diffusion according to the methods proposed by Sigman et al. (1997) and Holmes et al. (1998). To determine δ15N-NH4+, NH4+ was converted to NH3 under alkaline conditions. To determine δ15N-NO3-, NO3- was reduced to NH4+ and converted to NH3 under alkaline conditions. NH3 is transported by diffusion and retained in the GF/D filters. For the isolation of NH4+ and/or NO3-, we used standards prepared with artificial seawater containing salts corresponding to the chemical forms and in the concentration ranges of the samples analyzed (5, 10, 50, and 100 µM) and blanks of Milli-Q water containing all the reagents except the nutrient. To estimate fractionation during the diffusion process, the GF/D filters of the standards and the 1-mg replicates of KNO3 and NH4Cl were analyzed by determining the N content and isotopic composition. Fractionation by diffusion (Δ15Ndiffusion) was calculated by the simple difference between the original isotopic relation of the salt and the resulting relation in the standard after diffusion. The efficiency of the NH4+ and NO3-extraction process was estimated by N recovery in the standard or the sample retained by the GF/D filter. Only recoveries greater than 80% were accepted and corrected as follows (Holmes et al. 1998):

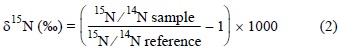
Macroalgae were rinsed with Milli-Q water to remove epibionts and freeze-dried (-44 °C, 33-72 mm Hg, 72 h). A sample of 5 mg of each dry and ground macroalga was placed in a 6 × 4 mm tin vial. The filters with the trapped N were packed in 9 × 5 mm tin capsules and sent, together with the macroalgal samples, to the Stable Isotope Facility at the University of California, Davis, for isotopic analysis. The isotopic values of N were expressed in parts per thousand with reference to atmospheric N, which is the internationally accepted standard. The δ15N isotopic signals of the analyzed samples were expressed using delta (8) notation:
Data processing
Nitrogen loading model
The NLOAD model described by Valiela et al. (1997, 2002) was used to identify the N sources and the total N load received by the Urías system from the catchment basin. Briefly, NLOAD calculates the N fluxes to a coastal ecosystem from the catchment area considering the land use (natural vegetation, agriculture, urban, parks and gardens, marshes, etc.), the number of inhabitants (% of treated sewage and type of treatment), and human activities such as the burning of fossil fuels (vehicular, industrial) and food production (e.g., agriculture, livestock raising, food processing). The model estimates the loss of N during its transport from the catchment basin to the coastal ecosystem by different processes, such as adsorption, assimilation, volatilization, and denitrification.
Simple and coupled mixing models
To explain the variability of δ15N-DIN in water, a physical mixing model was used (simple model) based on an isotopic balance using the concentrations of the inorganic N forms and their isotopic compositions, according to the source:
where ƒi is the proportional contribution of source i to the mixture and δi is the isotopic signature of source i. Since the sources of NO3- are terrestrial (e.g., agriculture, atmospheric) and oceanic, for the prediction of δ15N-NO3- it was first necessary to apply a mixed binary balance (marine and terrestrial) based on salinity to calculate the fraction of sea-water (and NO3-), following Middleburg and Nieuwenhuize (2001):

where δ15N-NO3-, δ15N-Nm, and δ15N-Nr are the isotopic values of NO3- in the water column, the oceanic sample, and the terrestrial sample, respectively.
The sources of NH4+ were considered to be anthropogenic activities and the decomposition of organic matter (allochthonous and autochthonous). The marine source was considered negligible due to the low concentrations of NH4+ in the adjacent seawater.
Nitrogen is highly reactive and its concentrations, chemical forms, and distinct isotopic composition change systematically as it participates in reactions associated with its biogeochemical cycle (Middleburg and Nieuwenhuize 2001). This isotopic change is called fractionation, and its magnitude depends on the type and intensity of the reaction, which in turn depends on the environmental conditions and time elapsed. Biogeochemical processes such as ammonium volatilization, nitrification, and denitrification result in isotopic fractionation that diverts the signals generated by the simple model relative to those observed in the field. A general linear model (coupled model) was thus designed that considers the effects of these processes on the variability in isotopic ratio (Moore and Semmens 2008):

where γi is the specific fractionation of source i participating in some biogeochemical process. Although organic matter mineralization is an important source of inorganic N in the water column, it has no effect on isotopic composition (Kendall 1998). Neither does biological N fixation produce isotopic fractionation (Swart et al. 2008). On the other hand, we assume that NO3- produced by denitrification is associated with the denitrification process (Dollhopf et al. 2005).
Volatilization (VNH3)
In seawater, the equilibrium of the NH4+ → NH3 reaction is mainly affected by pH, and to a lesser extent by T and S. We thus estimated the fraction of NH3 (xNH3) produced and removed from the water column, following Spotte and Adams (1983):


where pK is the equilibrium constant of the reaction as a function of T and S.
Denitrification (DNO3)
The denitrification reaction (CHONP + HNO3 - CO2 + H3PO4 + H2O + N2) mainly depends on the absence of DO and presence of NO3-, but is also influenced by T, pH, and τ. The effect of this reaction was estimated by the general denitrification equation (Heinen 2006):

where α is the denitrification potential based on DO, according to the following criterion: α = 0 for DO ≥ 2 mg L-1 and α = 1 for DO = 0 mg L-1; ƒNO3 refers to the effect of the concentration of NO3- required for the reaction that follows a nonlinear Michaelis-Menten behavior:

where ƒNO3 is dimensionless and ranges from 0 to 1, N is the concentration of NO3- (mg L-1), and K is the mean saturation constant with a value of 10 mg L-1 for ƒNO3 = 0.5 (Heinen 2006).
Since denitrification is a biological process, the rate of reaction increases exponentially with T according to the Arrhenius law. Bacterial activity is zero (ƒT = 0) at 0 °C and optimum (ƒT = 1) at 20 °C (Heinen 2006). Optimum pH for the reaction ranges from 7.0 to 7.5 (ƒpH = 1), the reaction ceasing at pH < 4 or pH > 10 (ƒpH = 0) (Heinen 2006). Finally, the magnitude of NO3- loss increases in relation to x. The fraction of NO3- (xNO3) potentially lost by denitrification can be calculated with the general equation (eq. 9).
Model validation
After estimating the effects of volatilization and denitrification on the NH4+ and NO3- signals, respectively, and constructing the simple and coupled models to predict the isotopic signals of DIN, the results were validated using the water column δ15N-NH4+ and δ15N-NO3- values determined by diffusion methods. The model with highest affinity to the values determined in the field by linear regression analysis was selected. The macroalgal δ15N values were plotted in relation to the δ15N-DIN signals predicted by the validated model.
Estimating the relative contributions
The MixSIR program based on Bayesian statistics (Moore and Semmens 2008) was used to solve the mixing models (simple and coupled) constructed to estimate the probable distribution of the contributions of N sources in the lagoon system. The isotopic composition of NH4+ and NO3-
in the N sources and in representative samples of the water column, as well fractionation factors during ammonium volatilization and denitrification (γ) were incorporated into solving the models. The relative contributions of the different N sources to macroalgae were also estimated using their isotopic signals according to their chemical form and the estimated fractionation effects.
RESULTS
Nitrogen sources and loading to the system
We identified five human-related sources of N that discharge into the Urías system: agricultural runoff, aquaculture effluents, atmospheric deposition, domestic wastewater effluents (sewage), and seafood processing plant (industrial) effluents (table 1). The total N loads ranged from 692 to 711 t yr-1; atmospheric deposition (29%) and treated and untreated sewage (28%) were responsible for the highest N inputs. The N load of marine origin, estimated by multiplying the volume of tidal flux for the Urías system by the mean concentration of N in the adjacent sea, was 94.1 t yr-1 (13%); however, N export was 281 t yr-1. The N load per unit area of the microbasin and agricultural lands was 25.3 kg ha-1 yr-1, whereas the N load entering the Urías system was 384 to 395 kg yr-1 per hectare of water mirror.
The N sources reaching the Urías system varied temporarily. During the rainy season, terrestrial leachates from the Urías microbasin and agricultural soil washing were discharged mainly by the channels in the upper zone (LH) and the Infiernillo estuary in the intermediate zone (LMH), in addition to aquaculture effluents from two farms operating in LH (from August to December and April to June). Sewage and industrial effluents discharge into LMH and are relatively constant year-round sources.
The isotopic characterization of the N sources (table 1) varied from low signals for agricultural runoff (2.1 ± 0.70/; mean ± standard deviation) to very high for treated sewage (16.1 ± 0.30/) and industrial effluents (19.1 ± 0.68/). On average, the signal derived for leachates from the Urías microbasin varied little (1.4-2.8/), depending on the agricultural land drained. Marine NO3- ranged from 1.9/ to 5.5/ according to the sampling season. Groundwater N loads were not considered, but we believe that the main N sources to the aquifer are atmospheric deposition and, to a lesser extent, agricultural runoff to the Mazatlán sub-basin and sewage from suburban and rural areas.
Environmental variables, chemical forms, and isotopic composition of nitrogen
The spatiotemporal variation of T, S, pH, and DO in the Urías system is summarized in table 2: T ranged from 22.2 ± 1.5 to 33.6 ± 0.59 °C; S ranged from 25.9 ± 2.5 to 39.8 ± 2.8; mean pH was 7.81 ± 0.26, with minimum and maximum values during the dry and rainy seasons, respectively; and DO on average ranged from 2.40 ± 0.98 to 10.2 ± 0.98 mg L-1, with values as low and high as <1 and 16.7 mg L-1, respectively. Minimum values of DO (0.77-2.0 mg L-1) were mainly observed within the tidal channels in LH and LMH (e.g., Infiernillo and Confites estuaries) and at other sites in LMH. In these low DO zones, sediments display anoxic conditions (H2S formation and blackish color).
The levels of NH4+ ranged from 13.1 ± 10.2 µg L-1 (December, MH) to 245 ± 172 µg L-1 (May, LMH) (table 3). Note that NH4+ concentrations ≥1180 µg L-1 were recorded at one site in LMH, associated with industrial effluents. The concentrations of NO3- plus NO2- ranged from 6.18 ± 1.56 µg L-1 (March, MH) to 204 ± 80.1 µg L-1 (November, LMH). The TDN levels also varied widely, between 134 ± 4.63 µg L-1 (February, MH) and 2836 ± 1231 µg L-1 (May, LMH). A high percentage (~80%) of TDN corresponded to DON, which is related to diverse anthropogenic inputs of organic matter, in particular sewage and industrial effluents.
Similar to the N concentrations, the isotopic values for both chemical forms also showed high spatial and temporal variation: δ15N-NH4+, from 13.0 ± 2.8/ to 20.1 ± 1.8/; δ15N-NO3-, from 0.85 ± 0.06/ to 13/ (table 4). The lowest values for δ15N-NH4+ (13.0-14.4/) and δ15N-NO3-(0.85-3.93/) were recorded during the rainy season in LH, whereas the highest were recorded in LMH throughout the year (17.4-20.1/) and in LH during the dry-cold season (8.3-13/).
The differences between the δ15N-NO3- and δ15N-NH4+ values measured in the water column and in the original sources (γ) (table 1) indicated enrichment. The mean differences were 1.6/ to 6.3/ (range of 0/ to 12/) for NO3- and ~1.0/ to 5.5/ (range of 0/ to 10/) for NH4+. Considering that NH4+ is the predominant form of sewage and industrial effluents and given that there is no direct source of NO3- in the area that receives such effluents (LMH), the presence of NO3- in these waters is due to nitrification. The signals observed for NO3- averaged ~8.2/ (product), whereas those for NH4+ ranged from 16.1/ to 19.1/ (reactive).
Modelling δ15N-DIN and δ15N-macroalgae
Two mixing models were used to estimate the isotopic signals of N available in the water column (δ15N-DIN) and they were compared to the NH4+ and NO3- signals observed (δ15Nobs) using diffusion methods. According to the results of the linear regression analysis, a better fit was obtained with the coupled model than with the simple model for both NH4+ (coupled model: δ15N-NH4+ = 1.04[δ15N-NH4+obs] - 0.64, R2 = 0.78; simple model: δ15N-NH4+ = 0.93[δ15N-NH4+obs] - 0.89, R2 = 0.51) and NO3- (coupled model: δ15N-NO3- = 1.02[δ15N-NO3-obs] - 0.07, R2 = 0.87; simple model: δ15N-NO3- = 0.88[δ15N-NO3-obs] - 1.40, R2 = 0.69). Both forms showed a lower slope and more negative intercept in the simple model, which indicates lower signals relative to the coupled model.
To validate the premise that macroalgae can be used as biomonitors of N pollution, we established the relation between δ15N-DIN and the isotopic signals of the 738 samples of macroalgae collected (fig. 2). The analysis revealed that all specimens had a significant R2 (0.43; n = 738; P < 0.001); however, there was high data dispersion related to the high isotopic variability in algae and DIN, as well as a lower than expected R2.
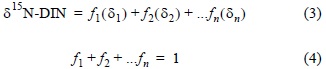
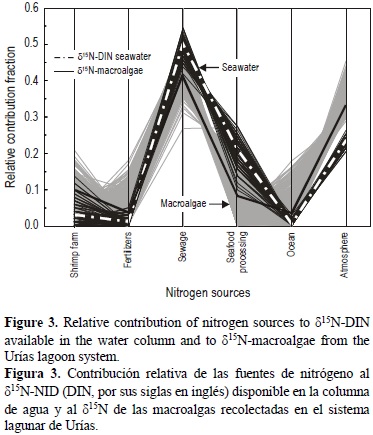
Relative contribution of nitrogen sources to δ15N-DIN and δ15N-macroalgae
The sewage effluents contributed 50% (45-56%) of N in the water column, atmospheric deposition contributed 24% (22-28%), industrial effluents 21% (12-29%), aquaculture 3% (0-12%), and agriculture 1% (0-7%), and 1% was of oceanic origin (0-3%) (fig. 3). The relative contributions in all the macroalgal specimens reflected that 41% (27-51%) of N was derived from sewage, 33% (2-45%) from atmospheric deposition, 10% (0-21%) from aquaculture, 8% (0-25%) from industrial effluents, and 4% (0-18%) from agriculture, and 4% (0-22%) was of oceanic origin.
DISCUSSION
The method of δ15N in macroalgae used to determine the relative contributions of N sources to the Urías lagoon system is useful to assess the effect of different human activities on the ecosystem and thus be able to establish preventive measures. This is the first step in any management program aiming to restore coastal zones; however, in the case of the Urías system, which is such a stressed and complex ecosystem, with multiple N sources, a diversity of macroalgal species, and changing environmental conditions in space and time, the result is high isotopic variability that tends to obscure any distinction of the N sources in macroalgae.
There are three explanations for this "lack of fit" and high variability of the data: (a) the multiple N sources that enter the system and vary spatially and temporarily, with different chemical forms of N and a wide range of isotopic signals; (b) the complex biogeochemical processes related to the N cycle alter its chemical form and isotopic composition; and (c) the high diversity of macroalgal species collected (45), with an additional effect due to fractionation by assimilation. This results in high spatial and temporal variation of the concentration and isotopic signal of N in the water column and, consequently, the macroalgae.
Most of the biogeochemical processes such as ammonium volatilization, nitrification, denitrification, ammonification, and N assimilation alter the concentration, chemical form, and/or isotopic compostion of N in the water column (Valiela et al. 1997, Kendall and Cadwell 1998, McClelland and Valiela 1998, Ricaurte-Villota et al. 2013). Based on the spatial and temporal variations of T, S, pH, and DO, and the chemical forms of N in the system, we suggest that the processes that have most impact are ammonium volatilization and denitrification. The relatively high values of pH, T, and S at the LH and LMH sites, as well as the high rates of organic matter decomposition and consequent production of NH4+, favor the conversion of NH4+ to NH3 and subsequent volatilization in the water column. The low DO levels observed in LH and at different LMH sites, together with the high concentrations of NO3- and accumulation of organic matter (1.2-4.1% of organic carbon) (Soto-Jiménez and Páez-Osuna 2001), high temperatures (T > 20 °C), optimum pH (7.4-8.54), and long residence times, accelerate the denitrification process. The preferential removal of 14N-NH4+ and 14N-N2 results in an enrichment of residual NH4+ and NO3-relative to their original signal.
Simultaneous nitrification-denitrification is controversial because the biogeochemical processes of the N cycle that occur in the water column and sediments are not always coupled (Valiela et al. 1997, Soto-Jiménez et al. 2003b), particularly in highly eutrophized environments such as the Urías system. Although little research has been done on these processes in subtropical coastal environments, we maintain that coupling occurs in the Urías system when conditions are stable (e.g., dry-cold season), as has been observed in other coastal ecosystems (Dollhopf et al. 2005). Coupling occurs mainly in areas where mangroves grow, where the oxygen released from the roots promotes nitrification close to the anoxic sediment zone, in turn stimulating denitrification (Ottosen et al. 1999). Coupling, however, does not occur during the rainy season, when most of the N inputs are in the form of NO3- and organic matter.
In addition to the different N sources and biogeochemical processes, the diversity and condition (e.g., juvenile, adult) of the macroalgal species also contribute to high isotopic variability. Few studies have measured fractionation factors during N uptake by macroalgae. Swart et al (2008) reported values of 2-40/00 for NH4+ or NO3- uptake, and Kaldy (2011) obtained values of 30/00 for NH4+ uptake and of 00/00 for NO3-uptake.
In general, the macroalgal δ15N values obtained in this study fall within the range of values reported for other sites in the world affected by the same sources (Deutsch and Voss 2006, Dailer et al. 2010, Kaldy 2011). In Mexico, few similar studies have been conducted. Atmospheric deposition, waste-water discharges, agriculture, aquaculture, and livestock rearing were found to be the main sources of anthropogenic N in three coastal ecosystems of Sinaloa (Soto-Jiménez et al. 2003b, Piñón-Gimate et al. 2009). Untreated sewage pollutes the coastal zone of the Yucatán Península (Carruthers et al. 2005) and the Mexican Caribbean (Mutchler et al. 2007). In the Urías system, atmospheric deposit, sewage and industrial effluents are the most apparent sources in the water column and macroalgae and, therefore, have a greater impact on the system. Aquaculture and agricultural activities and oceanic N are less important.
In summary, macroalgal δ15N is widely used to determine N sources and evaluate N pollution in coastal ecosystems; however, the different sources of variability observed in this study hampered the precise resolution of the mixing models used to estimate the N sources. It is necessary to use models that integrate factors which alter the chemical forms and isotopic signals of N (Moore and Semmens 2008) rather than the simple physical mixing models that do not consider fractionation (Phillips and Gregg 2003). Our coupled model allowed a better prediction of the available N isotopic signals relative to those observed in the water, and in turn the predicted δ15N values showed a close association with those measured in the macroalgae. Biogeochemical processes such as volatilization and denitrification and even macroalgal uptake that increase the signal by several parts per thousand are among the most important factors to consider.
By applying physical mixing models and adding the effects of the biogeochemical processes associated with the N cycle, it was possible to largely explain the variability of δ15N-DIN in water and, therefore, in macroalgae. Though macroalgae are excellent biomonitors of N in the ecosystem, their signals are a reflection of the N available in water and not necessarily of the sources that contribute it. Macroalgae integrate all the variability and reflect the isotopic signal resulting from all the processes. On the other hand, macroalgae (and their condition) can modify the N signal. So, for macroalgal δ15N analysis to be a reliable tool for the evaluation of the contribution of each source to the ecosystem, it is necessary to consider all the sources of variation. Otherwise, erroneous conclusions may be reached.
ACKNOWLEDGMENTS
This study was funded by the project UNAM-PAPIIT IN206409. We thank Humberto Bojórquez-Leyva, Arcelia Cruz-López, and Roberto Velázquez-Ochoa for help in the field and laboratory, and Yovani Montano-Ley and Victoria Montes-Montes for revising the manuscript. The valuable comments and suggestions of two anonymous reviewers are appreciated.
English translation by Christine Harris.
REFERENCES
Carruthers TJB, van Tussenbroek BI, Dennison WC. 2005. Influence of submarine springs and wastewater on nutrient dynamics of Caribbean seagrass meadows. Estuar. Coast. Shelf Sci. 64: 191-199 http://dx.doi.org/10.1016/j.ecss.2005.01.015 [ Links ]
Cohen RA, Fong P. 2005. Experimental evidence supports the use of δ15N content of the opportunistic green macroalgae Enteromorpha intestinalis (Chlorophyta) to determine nitrogen sources to estuaries. J. Phycol. 41: 287-293. http://dx.doi.org/10.1529-8817.2005.04022.x [ Links ]
Dailer ML, Knox RS, Smith JE, Napier M, Smith CM. 2010. Using δ15N values in algal tissue to map locations and potential sources of anthropogenic nutrient inputs on the island of Maui, Hawaii, USA. Mar. Pollut. Bull. 60: 655-671. http://dx.doi.org/10.1016/j.marpolbul.2009.12.021 [ Links ]
Deutsch B, Voss M. 2006. Anthropogenic nitrogen input traced by means of δ15N values in macroalgae: Results from in-situ incubation experiments. Sci. Total Environ. 366: 799-808. http://dx.doi.org/10.1016/j.scitotenv.2005.10.013 [ Links ]
Dollhopf SL, Hyun JH, Smith AC, Adams HJ, O'Brien S, Kostka JE. 2005. Quantification of ammonia-oxidizing bacteria and factors controlling nitrification in salt marsh sediments. Appl. Environ. Microbiol. 71: 240-246. http://dx.doi.org/10.1128/AEM.71.1.240-246.2005 [ Links ]
Grasshoff K, Ehrhardt M, Kremling K. 1983. Methods of Seawater Analysis. 2nd. ed. Verlag Chemie, Weinheim, 419 pp. [ Links ]
Heinen M. 2006. Application of a widely used denitrification model to Dutch data sets. Geoderma 13: 464-473. http://dx.doi.org/10.1016/j.geoderma.2005.08.011 [ Links ]
Holmes RM, McClelland JW, Sigman DM, Fry B, Petersen BJ. 1998. Measuring 15N-NH4+ in marine, estuarine and fresh waters: An adaptation of the ammonia diffusion method for samples with low ammonium concentrations. Mar. Chem. 60: 235-243. http://dx.doi.org/10.1016/S0304-4203(97)00099-6 [ Links ]
Kaldy J. 2011. Using a macroalgal δ15N bioassay to detect cruise ship wastewater effluent inputs. Mar. Pollut. Bull. 62: 1762-1771. [ Links ]
Kendall C. 1998. Tracing nitrogen sources and cycling in catchments. In: Kendall C, McDonnell JJ (eds.), Isotope Tracers in Catchment Hydrology. Elsevier, Amsterdam, pp. 519-576. [ Links ]
Kendall C, Caldwell EA. 1998. Fundamentals of isotope geochemistry. In: Kendall C, McDonnell JJ (eds.), Isotope Tracers in Catchment Hydrology. Elsevier, Amsterdam, pp. 51-86. [ Links ]
McClelland JW, Valiela I. 1998. Linking nitrogen in estuarine producers to land-derived sources. Limnol. Oceanogr. 43: 577-585. http://dx.doi.org/10.4319/lo.1998.43.4.0577 [ Links ]
Middleburg JJ, Nieuwenhuize J. 2001. Nitrogen isotope tracing of dissolved inorganic nitrogen behavior in tidal estuaries. Estuar. Coast. Shelf Sci. 53: 385-391. http://dx.doi.org/10.1006/ecss.2001.0805 [ Links ]
Montaño-Ley Y, Peraza-Vizcarra R, Páez-Osuna F. 2008. Tidal hydrodynamics and their implications for the dispersion of effluents in Mazatlán Harbor: An urbanized shallow coastal lagoon. Water Air Soil Pollut. 194: 343-357. http://dx.doi.org/10.1007/s11270-008-9721-0 [ Links ]
Moore JW, Semmens BX. 2008. Incorporating uncertainty and prior information into stable isotope mixing models. Ecol. Lett. 11: 470-480. http://dx.doi.org/10.1111/j.1461-0248.2008.01163.x [ Links ]
Mutchler T, Dunton KH, Townsend-Small A, Fredriksen S, Rasser MK. 2007. Isotopic and elemental indicators of nutrient sources and status of coastal habitats in the Caribbean Sea, Yucatan Peninsula, Mexico. Estuar. Coast. Shelf Sci. 74: 449-457. http://dx.doi.org/10.1016/j.ecss.2007.04.005 [ Links ]
Nixon SW. 1995. Coastal eutrophication: A definition, social causes, and future concerns. Ophelia 41: 199-220. [ Links ]
Ochoa-Izaguirre MJ, Carballo JL, Páez-Osuna F. 2002. Qualitative changes in macroalgal assemblages under two contrasting climatic conditions in a subtropical estuary. Bot. Mar. 45: 130-138. http://dx.doi.org/10.1515/BOT.2002.014 [ Links ]
Ottosen M, Risgaard-Petersen N, Nielsen LP. 1999. Direct and indirect measurements of nitrification and denitrification in the rhizosphere of aquatic macrophytes. Aquat. Microbiol. Ecol. 19: 81-91. [ Links ]
Phillips DL, Gregg JW. 2003. Source partitioning using stable isotopes: Coping with too many sources. Oecologia 136: 261-269. http://dx.doi.org/10.1007/s00442-003-1218-3 [ Links ]
Piñón-Gimate A, Soto-Jiménez MF, Ochoa-Izaguirre MJ, García-Pagés E, Páez-Osuna F. 2009. Macroalgae blooms and δ15N in subtropical coastal lagoons from the southeastern Gulf of California: Discrimination between agricultural, shrimp farm and sewage effluents. Mar. Pollut. Bull. 58: 1144-1151. http://dx.doi.org/10.1016/j.marpolbul.2009.04.004 [ Links ]
Ricaurte-Villota C, González-Yajimovich O, Sánchez A. 2013. Coupled response of rainfall and denitrification to solar forcing during the Holocene in Alfonso Basin. Cienc. Mar. 39: 151 -164. http://dx.doi.org/10.7773/cm.v39i2.2224 [ Links ]
Savage C. 2005. Tracing the influence of sewage nitrogen in a coastal ecosystem using stable nitrogen isotopes. Ambio 34: 145-150. http://dx.doi.org/10.1579/0044-7447-34.2.145 [ Links ]
Sigman DM, Altabet MA, Michener R, McCorklr DC, Fry B, Holmes RM. 1997. Natural abundant-level measurement of the nitrogen isotopic composition of oceanic nitrate: An adaptation of the ammonia diffusion method. Mar. Chem. 57: 227-242. http://dx.doi.org/10.1016/S0304-4203(97)00009-1 [ Links ]
Soto-Jiménez MF, Páez-Osuna F. 2001. Distribution and normalization of heavy metal concentrations in mangrove and lagoonal sediments from Mazatlán Harbor (SE Gulf of California). Estuar. Coast. Shelf Sci. 53: 259-274. http://dx.doi.org/10.1006/ecss.2000.0814 [ Links ]
Soto-Jiménez MF, Páez-Osuna F, Bojórquez-Leyva H. 2003a. Nutrient cycling at the sediment-water interface and sediments at Chiricahueto marsh: A subtropical ecosystem associated with agricultural land uses. Water Res. 37: 719-728. http://dx.doi.org/10.1016/S0043-1354(02)00380-9 [ Links ]
Soto-Jiménez M, Páez-Osuna F, Ruiz-Fernández AC. 2003b. Organic matter and nutrients in an altered subtropical marsh system, Chiricahueto, NW Mexico. Environ. Geol. 43: 913-921. http://dx.doi.org/10.1007/s00254-002-0711-z. [ Links ]
Spotte S, Adams G. 1983. Estimation of the allowable upper limit of ammonia in saline waters. Mar. Ecol. Prog. Ser. 10: 207-210. [ Links ]
Strickland JDH, Parsons TR. 1972. A Practical Handbook of Seawater Analysis. Fish. Res. Bd. Canada, Bull. 167, 311 pp. [ Links ]
Swart PK, Evans S, Capo T. 2008. The origin of nitrogen isotope values in algae. A research project conducted by the stable isotope laboratory. Technical Report EPA 20080501, University of Miami, 29 pp. [ Links ]
Valiela I, Collins G, Kremer J, Lajtha K, Geist M, Seely B, Brawley J, Sham CH. 1997. Nitrogen loading from coastal watersheds to receiving estuaries: New method and application. Ecol. Appl. 7: 358-380. [ Links ]
Valiela I, Bowen JL, Kroeger KD. 2002. Assessment of models for estimation of land-derived nitrogen loads to shallow estuaries. Appl. Geochem. 17: 935-953. http://dx.doi.org/10.1016/S0883-2927(02)00073-2 [ Links ]

