nueva página del texto (beta)
 Inglés (pdf)
 Artículo en XML
 Referencias del artículo
 Enviar artículo por email
 Citado por SciELO
  Similares en
SciELO
Similares en
SciELO 
 Permalink
1. INTRODUCTION
M dwarfs are one of the most common types of stars in the solar neighbourhood and the whole Galaxy. Catalogues of M dwarfs such as Lépine & Gaidos (2011) containing 8889 stars or Lépine & Gaidos (2013) with ≈100000 stars are based on measurements of colour indexes of the stars, their distances, and proper motions, together with information about X-ray emissions or other observed characteristics. Many of them show high photospheric activity (exceeding that of our Sun). Even though amplitudes of variations during flares can be high (>1mag in the V -band), only the most active dwarfs are monitored and studied. Due to a common low brightness of M dwarfs1, at least 1m-class telescopes are required to achieve a good time resolution of multi-colour observation. The low rate of flares for these objects makes observations tedious and time-consuming, and therefore such telescopes are rarely used for this kind of observation. This is the reason why infrequent flare activity of M dwarfs was proved sporadically. In the last decade, the situation has dramatically improved thanks to projects producing both, multi-colour measurements - SDSS (Kowalski et al. 2009) or white-light high-cadence measurements - Kepler space telescope (Walkowicz et al. 2011; Maehara et al. 2012; Davenport et al. 2014; Candelaresi et al. 2014; Doyle et al. 2018; Lin et al. 2019; Raetz et al. 2020; Okamoto et al. 2021), and TESS space mission (Doyle et al. 2019; Doyle, Ramsay, & Doyle 2020; Tu et al. 2020).
In this paper, we describe a discovery of a strong-flare activity in the M-dwarf CzeV502 using a small telescope (§ 3) and our follow-up observing effort with the same instrument and with several other telescopes (§ 4). Our observational results are compared with measurements from sky surveys (§ 5) and photographic plates (§ 6). In § 7 we present detection of Hα line emission using low-resolution spectroscopy. Information about CzeV502 found in the literature (§ 2) is compared with our observing results in § 8.
2. LITERATURE INFORMATION ABOUT THE OBJECT
The position of the flaring object CzeV502, which is the scope of this study, was determined by comparing our images and Aladin Lite image in DSS (our discovery images have a low angular resolution of 11”/pixel). There was identified object UCAC4 519-0520952 in the Simbad database (Wenger et al. 2000). The object is a very red star with B−R = 2.4mag (B = 14.4mag, R = 12.0mag) and it belongs among M stars (Zickgraf et al. 2003). Its brightnesses in infrared bands are J = 9.09(3)mag, H = 8.52(4)mag, and K = 8.26(2)mag (2MASS catalogue, Cutri et al. 2003). It is listed in the all-sky catalogue of bright M dwarfs with an M3 spectral type (Lépine & Gaidos 2011). Bai et al. (2012) determined a spectral type of M2.5 based on the low-resolution optical spectroscopy. GAIA DR2 and DR3 catalogues (Gaia Collaboration 2018, 2020) contain its effective temperature as 4013K and probably the most accurate values of its high proper motion and parallax, corresponding to a small distance to the Sun (25pc). The published results are summarised in Table 1. Other values of temperature and radius are mentioned in Table 4. In addition, the Einstein Observatory (space X-ray telescope) found a source of X-rays with a count rate of 0.0088(24)cts−1 in this location (McDowell 1994). X-ray activity was confirmed using the Röntgen Satellite (ROSAT) and the object was included in the ROSAT all-sky bright source catalogue (Voges et al. 1999). Measurements of its X-ray variability together with its X-ray spectrum are available in the second ROSAT all-sky survey catalogue (Boller et al. 2016).
TABLE 1 SUMMARY OF PROPER MOTIONS PARALLAXES AND DISTANCES*
| pmRA [mas/yr] |
pmDEC [mas/yr] |
π [mas] |
d [pc] |
Studya |
| +87 | −38 | 52(16)pho | 19 | 1 |
| - | - | - | 36 | 2 |
| +80(5) | −41(5) | 49(8) | 20 | 3 |
| +85.25(9) | −48.16(8) | 40.16(6) | 24.90(4) | 4 |
| +85.16(4) | −48.24(2) | 40.28(3) | 24.83(2) | 5 |
*From literature. a
1 - Lépine & Gaidos (2011), 2 - Bai et al. (2012), 3 - Finch & Zacharias (2016), 4 - Gaia Collaboration (2018), 5 - Gaia Collaboration (2020).
pho Parallax based on photometry.
TABLE 2 RESULTS FROM ANALYSIS OF SKY SURVEYS
| Sky survey | Nobs |
|
σ | Nbr | Nbr : Nobs |
| ASAS-3 (V) | 261 | 13.04 | 0.08 | 1 | 1:261 |
| CRTS (C) | 377 | 11.89 | 0.09 | 11 | 1:34 |
| NSVS (C) | 99 | 12.02 | 0.03 | 2 | 1:50 |
| KWS (V) | 353 | 13.17 | 0.38 | 1 | 1:353 |
| ASAS-SN (V) | 226 | 13.08 | 0.05 | 4 | 1:56.5 |
Notes.
a
Columns contain the following parameters: Sky survey - abbreviation of the sky survey (available photometric filter), N
obs - number of available/usable observations,
TABLE 3 SUMMARY OF OBSERVED FLARING ACTIVITY
| Dataset (filter) |
Nhour | Observed flare amplitude |
Number of flares based on ∆B [mag] estimation | |||
| ∆B < 0.5 | ∆B = 0.5 − 1 | ∆B = 1 − 2 | ∆B = 2 − 8 | |||
| Malokuk | 210 | 1× 1.5mag | 0∗ | 0∗ | 1 | 1 |
| (red) | 1× 0.37mag | |||||
| ASAS-SN | 17 | 1× 0.43mag | 3 | 1 | 0 | 0 |
| (V ) | 1× 0.2mag 2× 0.1mag | |||||
| Sonneberg (B) | 1400 | 0× | 0∗ | 0∗ | 0 | 0 |
Notes. a Columns contain the following parameters: Dataset (filter) - dataset designation (photometric filter/colour), N hour - the total number of observing hours, Observed flare amplitude - the number of flares with the mentioned amplitude in the measured band, Number of flares based on ∆B [mag] estimation - the number of flares with amplitude in the ∆B-band range, detailed explanation in the main text. Symbol ∗ means that this amplitude range is under/close detection limit of the dataset.
TABLE 4 PUBLISHED TEMPERATURE, RADIUS OF CZEV502 AND CALCULATED BOLOMETRIC ENERGY OF STRONGEST FLARES
| Study |
Tstar [K] |
Rstar [RSun] |
Eflare,1 [erg] 22/23 Feb. 2012 |
Eflare,2 [erg] 19/20 Mar. 2013 |
| Muirhead et al. (2018) | 3380 | 0.345 | 2.2 ×1034 | 0.7 ×1034 |
| Suissa et al. (2020) | 3385 | 0.40371 | 3.0 ×1034 | 1.0 ×1034 |
| Sebastian et al. (2021) | 3474 | 0.4 | 3.4 ×1034 | 1.2 ×1034 |
No evidence about optical variability of the object was found in the literature (SAO/NASA ADS, SIMBAD, VizieR, GCVS, VSX) at the time of our discovery (February 2012). Therefore, the star was added as CzeV502 Leo in the CzeV Catalogue - the Czech catalogue of discovered variable stars available on-line3(Brat 2006) and published in Skarka et al. (2017). This catalogue is maintained by the Variable Star and Exoplanet Section of the Czech Astronomical Society. Object CzeV502 was added also to the VSX database4 (Watson, Henden, & Price 2006). Recently, the star was identified as a rotating variable star with an amplitude of 0.09mag and elements
in the ASAS-SN project (object ID ASASSN-V J111820.37+134738.6). It is included in the ASASSN Catalog of Variable Stars: VI (Jayasinghe et al. 2020). The ATLAS project catalogue (Heinze et al. 2018) contains information about a dubious variability with a period of 6.286347d, a value very close to half of the ASAS-SN period.
3. DISCOVERY OF FLARING ACTIVITY OF CZEV502
In the night 22/23 February 2012 a field with the Leo Triplet (group of galaxies M65, M66, and NGC 3628) was observed. The observation was done by JL in a private observatory in Brno using the “Malokuk” telescope - a small photometric instrument designed for measurements of very bright variable stars (more e.g. in Zejda et al. 2011). The telescope (see Figure 1, right panel) was composed of a photographic lens Sonnar 4/135 (focal ratio/focal length) with maximal diameter of aperture of 34mm, an ATIK 16IC CCD camera (chip Sony ICX424AL) equipped with red non-standard long-pass filter similar to an R-filter (see the spectral response in Figure 14)5, and a simple mount EQ-1 Table Top (SkyWatcher). The exposure time was selected as 15sec to minimize the influence of mid-fast atmospheric changes and the periodic error of the mount. The optical setup was focused to obtain the sharpest image (it was planned to create the “deepest” combined image). A limiting magnitude in the single image was below 12.5mag, in the composite image close to 15mag (R).
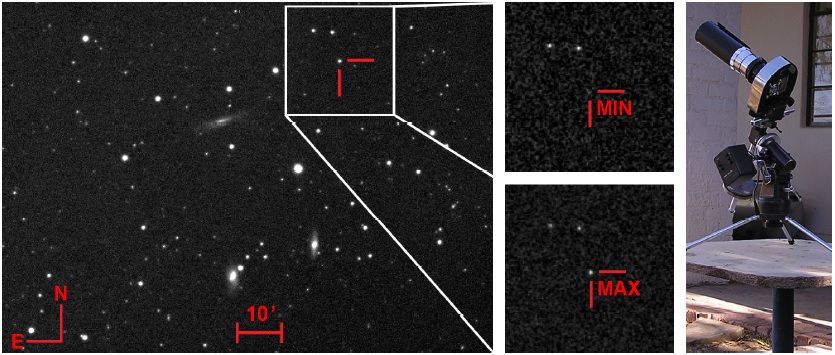
Fig. 1 Composite image of the Leo Triplet (exposure 58×15sec) obtained during the night 22/23 February 2012 (on the left), selected area on individual images with the variable star at minimum brightness (time 23:13:29 UTC - top centre) and at maximum brightness (time 23:17:30 UTC - bottom centre), and Malokuk telescope (on the right). The color figure can be viewed online.
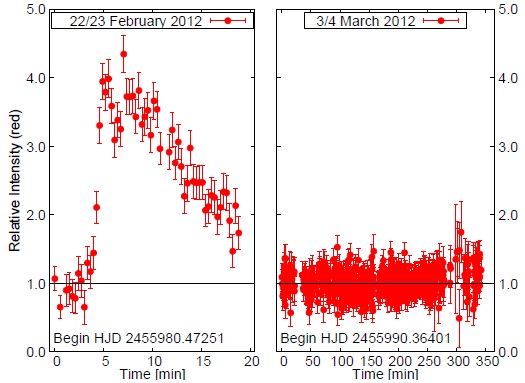
Fig. 2 The first detected flare on the night 22/23 February 2012 (left) in comparison to the quiescent state on 3/4 March 2012 (right); instrument Malokuk, exposure 15sec, red filter. Amplitude of the flare was about 1.5 mag (maximal brightness 10.5 mag) and duration more than 17min. The color figure can be viewed online.
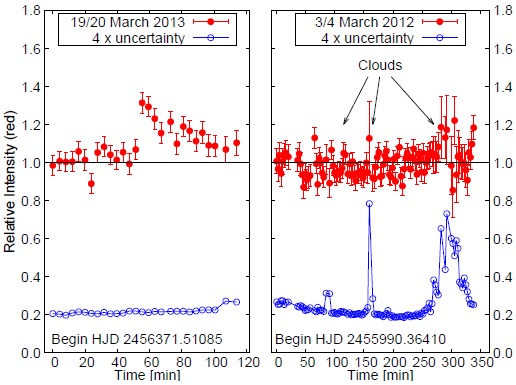
Fig. 3 The second detected flare on the night 19/20 March 2013 (left) and the quiescent state on 3/4 March 2012 (right), Malokuk telescope, red filter. Photometry was performed on images composed of 10 individual CCD frames to increase the S/N ratio. Uncertainty of each measurement was multiplied by 4 for better visualization (blue curves) and is used as an indicator of the stability of the observing conditions. The color figure can be viewed online.
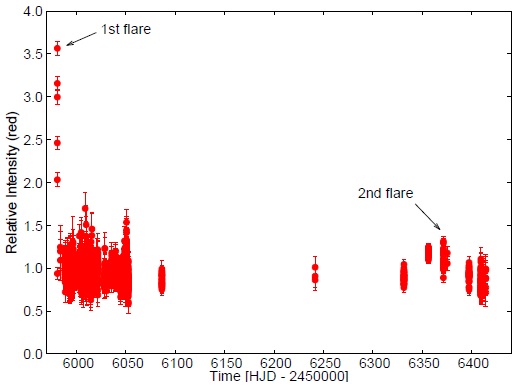
Fig. 4 The complete light curve from instrument Malokuk using red filter. The analysed images were composited from several individual frames. Evident brightness variation outside the two flares was caused by variable observing conditions. The color figure can be viewed online.
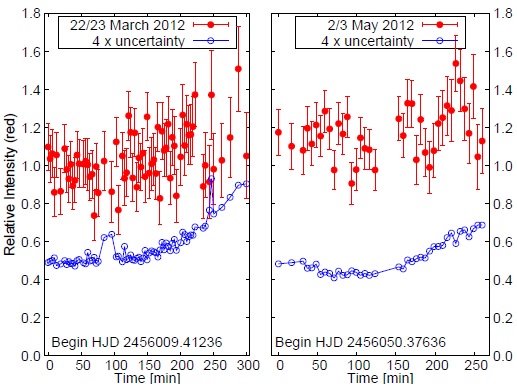
Fig. 5 Example of light curves from other nights (22/23 March 2012 - left, 2/3 May 2012 - right) showing higher relative intensity. High uncertainty and its growing value at the end of each night (blue curves, for better visualization uncertainty was multiplied by 4) support the quiescent state of CzeV502 measured during deteriorating observing conditions rather than flaring activity. The photometry was performed on images composed of 10 individual CCD frames to increase the S/N ratio. The color figure can be viewed online.
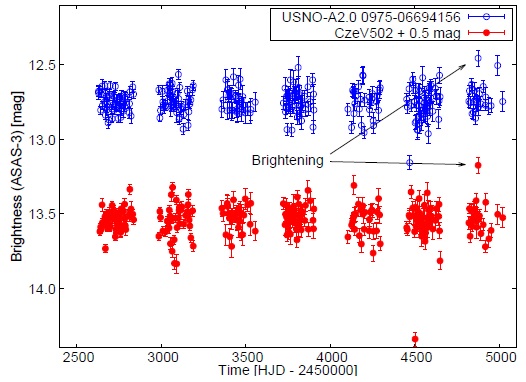
Fig. 6 The light curve for CzeV502 and comparison star USNO-A2.0 0975-06694156 from ASAS-3. The color figure can be viewed online.
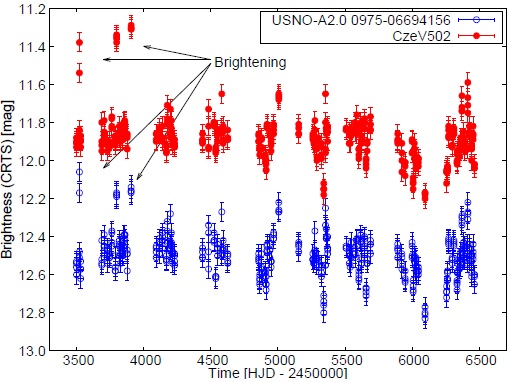
Fig. 7 The light curve for CzeV502 and comparison star USNO-A2.0 0975-06694156 from CRTS. The color figure can be viewed online.
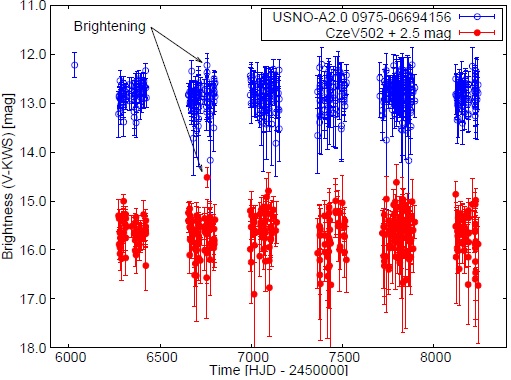
Fig. 8 The light curve for CzeV502 and comparison star USNO-A2.0 0975-06694156 from KWS. The color figure can be viewed online.
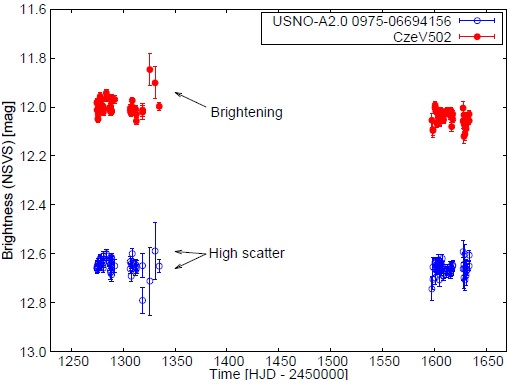
Fig. 9 The light curve for CzeV502 and comparison star USNO-A2.0 0975-06694156 from NSVS. The color figure can be viewed online.
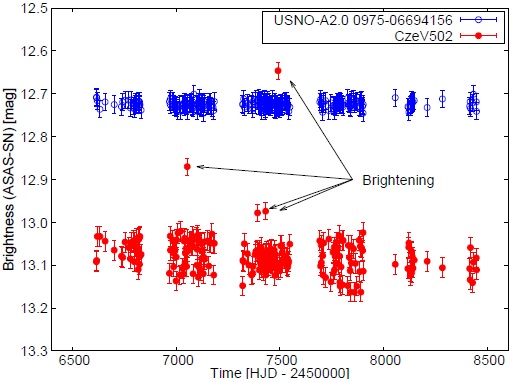
Fig. 10 The light curve for CzeV502 and comparison star USNO-A2.0 0975-06694156 from ASAS-SN. The color figure can be viewed online.
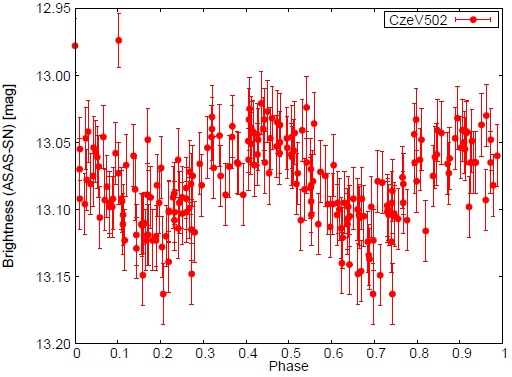
Fig. 11 The light curve for CzeV502 from ASAS-SN (zoomed) phased with ephemeris of equation 1. The color figure can be viewed online.
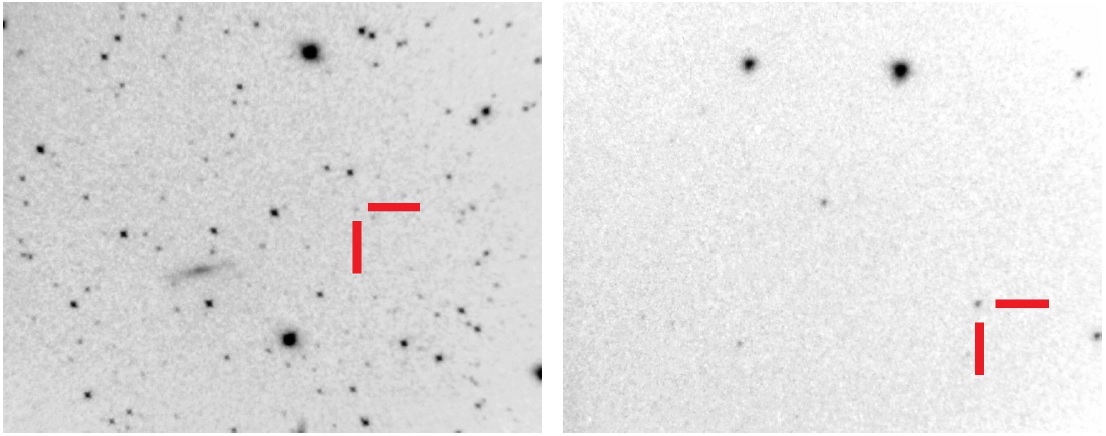
Fig. 12 Flare star CzeV502 in quiescent state on digitized Sonneberg Sky Patrol plate (left) and Sonneberg Astrograph Plate (right). The color figure can be viewed online.
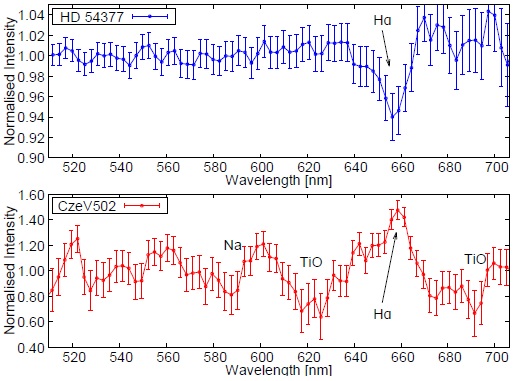
Fig. 13 Spectra for the comparison star HD 54377, spectral class A0 (top panel), and CzeV502, with significant Hα emission (bottom panel). The color figure can be viewed online.
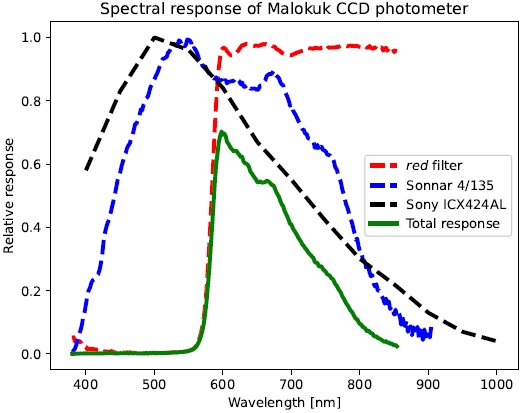
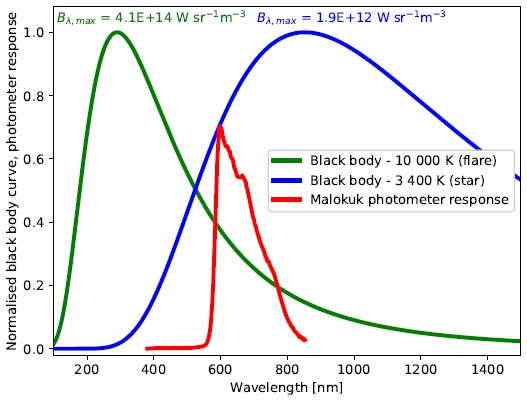
Fig. 14 Spectral response of the Malokuk photometer including a relative transmission of the red filter, a relative transmission of the photographic lens Sonnar 4/135, and a spectral response of the CCD chip Sony ICX424AL in the ATIK 16IC camera. The color figure can be viewed online.
All measurements were calibrated with the proper dark frame and flat field images using the photometric package C-Munipack (Motl 2009) vers. 1.1.28. Stars BD+14 2375 (R = 8.94mag or 8.88mag) and HD 98388 (R=6.84 mag or 6.81mag) with brightnesses adopted from USNO-B1.0 Catalog (Monet et al. 2003), were chosen as the comparison and check stars, respectively.
The observation started at 23:12:11 UTC (HJD 2455980.4725) and after four minutes, a significant brightening of the faint star-like object in the field was recorded (Figure 1). The object become about 4 times brighter (1.5 mag) during 2 minutes and then slowly faded, which is typical for stellar flares (Davenport et al. 2014) see Figure 2. Unfortunately, the observing interval was short (19min) and the end of the flare is missing; the object did not reach its brightness in the quiescent state.
The observed amplitude of the flare in the red band ∆R (1.5mag) can be extrapolated into the short-wavelengths adopting published results from multi-colour observations of e.g. YY Gem (Gary et al. 2012) or GJ 3236 (Šmelcer et al. 2017). Their flare spectral indexes for both objects show a linear dependency between log(amplitude) in mmag and log(wavelength) in nm and with similar slopes of −3.2(0.3) and −3.9(0.4). Possible flare amplitudes for the V and B bands (with central wavelengths of 550 and 439 nm) were estimated as ∆V ≈ 2.8 − 3.2mag and ∆B ≈ 5.8 − 7.8mag, respectively. To calculate the total bolometric energy released during the flare, a procedure described by Shibayama et al. (2013) was used. We obtained values of E flare in the range 2.2 − 3.4 × 1034 erg. More details are given in Appendix A.
4. FOLLOW-UP CCD PHOTOMETRY
Many CCD photometric observations were obtained in the next seasons to check the level of the normal (quiescent) state, to determine the colour index of CzeV502, and to confirm the flaring activity of this M dwarf star.
4.1. Malokuk - Sonnar 4/135
The majority of the follow-up measurements were obtained by JL using the Malokuk telescope, the same instrument as on the discovery night. Following observations with short exposures (3-30sec, typically 15sec) for a good covering of eventual flares were performed for a long time without any flaring detection. Finally, more than one year after the first flare (in the night 19/20 March 2013) the second suspected flare was detected (Figure 3). On this night the star brightened only 1.4 times (0.37mag). The duration of the flare was probably a little over 60 min (observation time was too short). The detected variation had a low amplitude and therefore the flare light curve as well as the comparison quiescent one, which are displayed in Figure 3, were measured from composite images of 10 CCD frames. The uncertainty of each measurement is used as an indicator of the stability of the observing conditions (e.g. passing clouds visible in Figure 3, the right panel). The calculated total bolometric energy released during this low-amplitude flare is in the range 0.7−1.2×1034 erg (see Appendix A).
The brightness of CzeV502 was often close to the limiting magnitude of detection in the individual CCD frames (especially during moonlit nights). These data were still usable for our purpose - detection of the star much brighter than usual. The final light curve (Figure 4) was created from photometry on composite images (typically 10 exposures, equivalent to one 150-sec long exposure) with a higher S/N ratio than a single image and removing points with uncertainty > 0.25mag caused by clouds. Visible variation of the normal level was caused by changes in atmospheric conditions and moonlight in the individual nights and it also depends on the length of exposures. Probably, it is not related to the real variability of the star (see other examples of observations which can be marked as false-positive candidates of flares in Figure 5). A visual inspection of all individual observations was performed.
In sum, we obtained nearly 210 hours (12578min) of measurements of CzeV502 in 58 nights during the years 2012-2013. The star was caught in a state of high activity probably only in 17+60 minutes. We estimate from this that the chance for positive detection of a flare with an amplitude similar or larger than ∆R ≈ 0.37mag is 1:163 or worse (flare rate of about 1 flare per 105 hours or 0.0095 flare per hour). We note that the R-band is not ideal for the detection of flares in dMe stars that have typically much larger amplitudes at shorter wavelengths. However, the red filter was selected as the best compromise for our small instrument, because CzeV502 was at the limit of detection when the V filter was used and almost undetectable in the B filter (Johnson-Cousins system) with the same instrument and much longer exposures. To get information about the flaring activity of CzeV502 of shorter wavelengths, we used larger telescopes and the short-wavelength photometric filters B, V , b, and y during 13 nights (about 11 observing hours) which are described below.
4.2. D50
D50 is a robotic telescope (Newtonian reflector with a diameter of 500mm; the used focal length was 2277mm, Nekola et al. 2010) at the Astronomical Institute in Ondřejov, supplemented by CCD camera FLI IMG 4710 with Johnson-Cousins photometric filters BVRI. D50 was used by JS for monitoring CzeV502 in 2 nights (26/27 February and 3/4 March 2012) without detection of any flare (total 3.1 hours). These measurements were transformed into the standard Johnson-Cousins photometric system: B = 14.57(5)mag, V = 13.08(2)mag, and R = 11.95(2)mag.
4.3. Other Telescopes
Several other telescopes were used to detect flares of CzeV502 but without success. Therefore we only summarize total observing time with the used telescopes: 2 hours (1 night) using the 40-cm telescope at Vyškov Observatory (BVRI), 0.5 hour (1 night) using the 23.5-cm telescope at Mt. Suhora Observatory, Poland (by - Strömgren), 4.9 hours (6 nights) using the 35.5-cm telescope at Brno Observatory and Planetarium (by - Strömgren), 0.3 hour (1 night) using the 5-cm telescope at a private observatory in Frenštát p. R. (Clear), and 0.01 hour (2 pre-discovery nights) with the 7-cm telescope at a private observatory in Brno (red).
The Leo Triplet is often recorded by amateur astrophotographers. We were looking visually for rebrightening of CzeV502 on photos among the on-line photographer community. We found one good candidate for a flare on the composite colour CCD photo. However, our detailed inspection of the raw images did not allow us to confirm the flare (the star was close to the saturation limit in most CCD images).
5. SKY SURVEYS
We have found data for CzeV502 in several all-sky surveys. Unfortunately, surveys such as the All Sky Automated Survey (ASAS) contain typically a few hundred measurements for one object obtained during a few years and using them for analysis of random short-time variations is very complicated due to insufficient sampling during some time periods or unsatisfactory time resolution. Therefore, we focused only on ‘bright outliers’ at greater than three times the standard deviation (3σ) from the mean brightness
After a quick inspection, released data for CzeV502 from the Lincoln Near-Earth Asteroid Research (LINEAR, Sesar et al. 2011) and Pi of the Sky databases (Burd et al. 2004) were found to be unusable for our purpose due to poor quality; CzeV502 is probably too bright (LINEAR) or too faint (Pi of the sky). On the other hand, data in ASAS-36 (Pojmanski 2002), the Northern Sky Variability Survey (NSVS, Woźniak et al. 2004), the Catalina Real-time Transient Survey (CRTS, Drake et al. 2009), the Kamogata/Kiso/Kyoto Wide-field Survey (KWS)7, and ASAS-SN (Shappee et al. 2014; Kochanek et al. 2017) are quite homogeneous, and we identified several bright points which may indicate flares (one in ASAS-3, two in NSVS, eleven in CRTS, one in KWS, four in ASAS-SN).
The use of outlying points as a proof of a flare is inconclusive when a light curve from the immediate time vicinity is missing. The same is true without the image on which the object is significantly brighter than usual. The deviated point can be a systematic error that arose during the observation (e.g. passing clouds) or during automatic processing. Despite that, we tried to estimate how high is the probability of catching the star during its brightening by calculation of a ratio between the number of bright outlier points N
br (points with
The ASAS-3 database, which contains typically only 1 or 2 measurements per night for one target, shows for CzeV502 only one point representing a possible brightening. This measurement stays alone on one night without any confirmation. A similar situation holds for brightening in KWS data (their accuracy for our star is poor). The ASAS-SN accurate data with a similar cadence (one data point per night) contains four possible brightenings. The NSVS brings for our target a more precise measurements than ASAS-3, but the brightest two values have a lower accuracy (2 times lower than is the accuracy of other values) and therefore they represent rather incorrect measurements. The CRTS contains the largest number of bright points belonging to three events that could be caused by flares and each measurement is confirmed typically by three other measurements during the same night.
To verify these findings, data for CzeV502 were compared with data for five non-variable stars in close vicinity (brightness from 10.5 to 12.6 mag in R-band, distance from 3 to 16.5 ´ which is far from the angular resolution limit of the selected surveys - below 1´). For four of the used surveys, it was found that the brightenings of CzeV502 were identified at the same times also for other stars (see comparison of measurements for CzeV502 and USNO-A2.0 097506694156 with mutual distance 16.5 ´ in Figures 6, 7, and 8). In the case of NSVS data, the bright outliers for CzeV502 have the highest uncertainty (Figure 9) and measurements for the comparison stars corresponding in time suffer from high scatter. Based on this information, we conclude that all the detected brightenings from these four surveys represent observing artifacts. This is an alarming finding of this research.
The most promising results come from ASAS-SN. Data for the selected comparison stars do not show the same bright artifacts (Figure 10). The largest recorded brightening was ∆V 0.43 mag. To calculate the hour rate of flares, four possible flares were recorded among 226 measurements. Each data point was created from three 90-sec long exposures, which means a total duration of 17 hours and a rate of 0.235 flare/hour. In addition, accurate observed changes phased with ephemeris in equation 1 (Jayasinghe et al. 2020) display the proposed rotation periodic variation with a 0.09 mag amplitude very well (Figure 11). Our own period analysis of ASAS-SN data using the Period04 software (Lenz & Breger 2005) showed two close frequencies (f 1 = 0.15933(2) and f 2 = 0.15798(4)cd−1) and twice the value of the period calculated from the strongest frequency 2/f 1 = 12.5523(14)d confirm the published value (12.5494014d) very well. Nevertheless, data from other surveys or from our measurements do not support this periodicity. Only the ATLAS catalogue contains information about dubious variability with the half period (Heinze et al. 2018).
6. PHOTOGRAPHIC PLATES AT SONNEBERG
The Sonneberg Observatory Plate Archive contains roughly 280000 plates obtained between 1928-2009 and thus it is the largest European astronomical plate collection. The limiting brightness of stars in the plates is 14-17 mag in the B-band (most plates were taken in blue colour). Thus, our object (B ≈ 14.6mag in normal state) was well detectable (see Figure 12).
The star was checked by eye estimation under a microscope by RH on 1600 selected plates representing 1400hours of exposure to the flaring activity. The method is much faster than any alternative technique. But no light change exceeding 0.2-0.3mag in B was found. Hence, the flares with an amplitude of the order of 1mag must be very rare (roughly less than 1 per 1400hours).
7. LOW-RESOLUTION SPECTROSCOPY
We estimated that our flaring M dwarf, as an X-ray source, could be also a dMe star with emission lines of Ca II H&K or Hα in its spectrum, which is typical for chromospherically active stars (Hall 2008). We attempted to use a small telescope SkyWatcher 102/500mm with a low-resolution spectrograph Star Analyser 100 (diffraction grating with transmission of 100 lines/mm) of Paton Hawksley Education Ltd firm, and an ATIK 16IC CCD camera.
Two series of spectra were obtained at Brno Observatory and Planetarium in the night 15/16 April 2013, 15×30sec for the comparison star HD 54377, spectral class A0, and 51×30sec for CzeV502. The obtained spectra, containing zero and first diffraction orders, were calibrated and subsequently composed into a single image. Wavelength calibration was done using the comparison star. The continuum in the spectra was determined using a 4th order polynomial in the wavelength range 500-700nm.
The high noise spectrum for the CzeV502 (Figure 13) has a clearly seen strong emission Hα line (λ=656.28nm) and contains probably the Na doublet and several TiO bands (absorption about 590, 620, and 690nm). The star is very red and thus its signal is close to zero in the range of the H&K Ca lines (396.85nm, 393.37nm). The comparison star has an evident absorption Hα line as was expected. Emission of Hα in CzeV502 and its classification as a dMe star was independently confirmed by Bai et al. (2012). Their spectrum of CzeV502 shows a pronounced Hα emission line.
8. DISCUSSION AND CONCLUSIONS
The detection of the flaring activity of star CzeV502 = RX J1118.3+1347, unknown as a variable object before our discovery, is described. The first discovered flare in the night 22/23 February 2012 with a brightening of about 4 times (amplitude ∆R ≈ 1.5mag) had a duration of more than 17min. The amplitude in shorter wavelengths was estimated as ∆V ≈ 2.8 − 3.2mag or ∆B ≈ 5.8 − 7.8mag according to the results from Gary et al. (2012) and Šmelcer et al. (2017). The second suspected flare on 19/20 March 2013 with a brightening of only about 1.4 times (amplitude ∆R ≈ 0.37mag) lasted more than 60min. The amplitude was estimated as ∆B ≈ 1.4 − 1.9mag. The total bolometric energy released during the first and the second flares was estimated as E flare,1 = 2.2 − 3.4 × 1034 erg and E flare,2 = 0.7 − 1.2 × 1034 erg, respectively (see Appendix A) and both flares can be classified as superflares (typically set as E > 1033 erg). Such a large released energy for M2-3 dwarfs is quite unique (Lin et al. 2019; Raetz et al. 2020), especially for slow rotators with rotation periods > 10d. No further significant mark of flaring activity was found in 58 nights (≈210 hours) of photometric monitoring with a 3.4-cm Malokuk telescope (red filter). Our pre-discovery archive images from two nights show CzeV502 in a normal state. Additional multicolour photometry was obtained in 13 nights (about 11 hours) using larger telescopes also with shortwavelength photometric filters (B, V , b, and y) without however succeeding in detecting another flare.
All-sky surveys data (ASAS-3, NSVS, CRTS, KWS, and ASAS-SN) were used to verify the flares. We focused on measurements showing evident brightening (more than 3σ from the mean survey brightness). The numbers of these bright outliers were compared with the number of the whole datasets and probabilities for detecting flares were roughly estimated as 1:261 (ASAS-3), 1:50 (NSVS), 1:34 (CRTS), 1:353 (KWS), and 1:56.5 (ASAS-SN). Our data provide a better-proven value of 1:163 based on two well-recorded flares. Unfortunately, we found that analogous brightenings as those detected for CzeV502 in surveys data were recorded also for other stars at the same time. Therefore, they are not flares but only some kind of measurement artifacts (passing clouds or bad data reduction).
A different situation was found only in the ASAS-SN V -band data. Four recorded brightenings of CzeV502 are not visible in nearby stars and we accept them as flares. The ASAS-SN brightening ratio was determined as 1:56.5 and the flaring rate was calculated as 0.235 flare/hour according to the total duration of 17 hours. This value is much higher than the rate estimated based on our red band measurements (0.0095 flare/hour). The large discrepancy between both identified rates can be related to the fact that two strong expected dependencies were not considered so far; the dependency between flaring rate and flaring energy and the dependency between flare amplitude and observed wavelength. For a more rigorous comparison between these two datasets, and also for the results from the plate collection discussed below, we decided to estimate the amplitude of detected flares in the B-band using results from Gary et al. (2012), Šmelcer et al. (2017). According to the these two studies, the flare amplitude (in mag) is 1.9 or 2.1 times higher in the V band than in the red band and 2.1 or 2.4 times higher in B band than in the V band (central wavelengths were adopted as follows: λ B = 439nm, λ V = 550nm, and λ red = 670nm). The observed flare amplitudes are summarized in Table 3; we split their estimated B band values into four amplitude bins (∆B < 0.5, 0.5 − 1, 1 − 2, and 2 − 8mag). From the comparison it is apparent that our Malokuk data recorded only the flares with the largest amplitude (and the largest released energy) in contrast to ASAS-SN data. This is probably a consequence of the filter selection and also the data quality. ASAS-SN data have higher accuracy (σ ASAS−SN = 0.05mag) than the data from Malokuk (σ MALOKUK = 0.12mag with the upper limit of 0.25mag)8. The largest recorded ASAS-SN brightening of ∆V ≈ 0.43mag is close to the limit for flares detectable using a small Malokuk telescope in the red band.
Apart from the CCD photometry, we visually controlled 1600 plates of the photographic archive at Sonneberg Observatory (the equivalent of 1400 hours of observations) and no sign of flaring activity larger than 0.2-0.3mag in the B-band was found. Nevertheless, longer exposures of plates (typically 45 min) could blur the possible flare event if ∆B <1mag and duration <20min. Probably only high amplitude flares (> 1mag) with a long duration (>20min) are detectable on photographic plates with long exposure times.
To sum up results related to the flaring activity, the upper limit for the flaring rate of very bright flares (∆B = 2 − 8mag) can be estimated as 1 flare per 1640 hours (1 flare per 68 days) when the total duration includes the whole observing time (our CCD and ASAS-SN photometry and photographic plates). This estimated flaring rate can be an overestimate because it is based only on one such bright flare and the duration of observation is still very short. Data from other surveys even ignoring probable artifacts did not detect flares falling into this category. Nevertheless, their duration is dozens of hours and this does not significantly affect the statistic, which is particularly based on photographic plates. Flares with a ∆B amplitude larger than 1mag have a rate of 1 flare per 820 hours = 0.093yr (based on 2 flares). We estimate the total released bolometric energies of both flares as E flare,1 = 2.2−3.4×1034 erg and E flare,2 = 0.7 − 1.2 × 1034 erg, a more than an order of magnitude higher rate for these superflares than mentioned Lin et al. (2019). Their estimated rate of flares among M dwarfs considering a released energy E flare > 1 × 1033 erg is one in 0.6yr, with E flare > 1034 erg one in 6.5yr, and with E flare > 1035 erg one in 350 yr. The CzeV502 is even more unique if it is a slow rotator with an expected rotation period of 12.55d (more about rotation below). The rate of superflares can be about 50 times smaller among the M-dwarf slow rotators (period > 10d, Raetz et al. 2020).
A different flaring rate was observed for the lowamplitude flares ∆B ≤ 1mag, unfortunately, only ASAS-SN data are fully usable for this purpose and cannot be simply combined with Malokuk or Sonneberg numbers due to their detection limits. The brighter flares from this class could occur every 17 hours, flares with ∆B ≤ 0.5mag can occur every 4 hours.
In addition, we determined the brightness of the star during its quiescent state from measurements by D50 telescope. These values were transformed into the standard Johnson-Cousins system B = 14.57(5)mag, V = 13.08(2)mag, R = 11.95(2)mag. Our determined colour index B−R = 2.62(5)mag is close to value B−R = 2.4mag based on Zickgraf et al. (2003). Our colour B−V = 1.49(5)mag, corresponding to spectral type M2 (based on Tsvetkov et al. 2008) and it is in agreement with M3 (Lépine & Gaidos 2011) or M2.5 type (Bai et al. 2012).
As a source of X-rays (McDowell 1994; Voges et al. 1999; Boller et al. 2016) and catalogued as an M dwarf (Zickgraf et al. 2003) we conclude that this object belongs to the UV Ceti type of eruptive variables and it is dMe flare star. The emission of the Hα line was detected by our low-resolution spectroscopy and it is also known from Bai et al. (2012). This object is probably similar to the EXOSAT X-ray source EXO 020528 +1454.8 = WW Ari with dMe flare star counterpart detected by Hudec et al. (1988).
Our frequency analysis of the ASAS-SN data identified two close frequencies corresponding to one half of the 12.55-d period mentioned in the ASAS-SN catalogue (Jayasinghe et al. 2020). The 12.55-d period is not directly apparent in our frequency spectrum, which is a consequence of the searching algorithm. The same or half value of the period were not revealed in any other datasets, probably due to worse data quality. This periodic (or semi-periodic) variation with an amplitude of 0.09mag (V -band) can correspond to rotational variability as was already proposed (Jayasinghe et al. 2020). This kind of variability is common for other M dwarf stars (McQuillan, Aigrain, & Mazeh 2013; Doyle et al. 2018, 2019) and can be classified as BY Draconis type, as mentioned in VSX. Among other possible explanations a close companion orbiting the M dwarf component causing mutual eclipses or non-eclipsing variability can be considered. Our spectroscopic data with a low dispersion obtained in only one night do not allow us to discard/confirm binarity using radial velocity measurements. However, a possible close companion in the binary system would influence our results by additional light and appropriate reduction of the flare amplitudes. A brighter star than the M dwarf itself can be ruled out due to the observed colour indices or spectrum (Bai et al. 2012). Nevertheless, a less-luminous object such as a brown dwarf can be present, and additional spectroscopic measurements will be helpful. There is no apparent background star brighter than 17.5mag (R) closer than 1 arcmin using SDSS.
In this work, we have demonstrated the usability of a small and inexpensive instrument for the study of the flaring activity of stars. It can be used for full-time monitoring of one particular object to obtain a high time resolution. As we showed, it can provide more dense and more precise data than data from plate collections or sky surveys. A large field of view allows one to observe many stars simultaneously and thus its benefit is in the study of numerous variable stars at the same time. Such an instrument is ideal for photometric observations of very bright stars, which are often neglected (see Zejda et al. 2011).