1. Introduction
The range of self-consistent configurations of collisionless, self-gravitating systems is determined by the orbital structure they support, as orbits are their basic building blocks in phase space (e.g. Jeans’ theorem, see Binney & Tremaine, 2008, § 4.2). It is not the individual positions and velocities of the particles that matter, as these will change from one instant to another, but rather the orbits along which they move. The overall mass distribution, through its force field, determines the orbits that are possible. In turn, the occupation fractions for each orbit determine the range of possible self-consistent models that can exist with this mass distribution, something directly exploited by some methods to build selfconsistent models (Schwarzschild 1979). As such, determining the orbital structure of self-consistent models is of paramount importance.
Traditionally, the orbital structure of models has not been extensively studied, but rather the global (e.g. overall energy and angular momentum), and local (e.g. moments of the local velocity distribution) dynamical properties have been emphasized (e.g. Vorobyov & Theis 2008). However, a new generation of methods to build self-consistent models uses directly the orbital makeup, e.g. the “Made to Measure” method of Syer and Tremaine (1996). In particular, N -body simulations allow the construction of self-consistent models, but the collisionality due to their graininess had made impossible the successful extraction of orbits from them. In a collisional system, particles do not follow orbits, but trajectories that are piecewise orbits, since collisions scatter particles in orbital space. It was only when N -body simulations were able to follow of the order of 106 particles that the graininess could be pushed down and the first orbits could be extracted directly from an N -body simulation (Ceverino & Klypin 2007).
In almost all cases, orbit extraction from N -body simulations is attained by extracting a fixed, smooth potential from the final snapshot, which in turn is used to integrate forward in time the orbits of the individual particles starting from their final positions in the N -body simulation (e.g. Holley-Bockelmann et al. 2001; Athanassoula 2002; Muzzio & Mosquera 2004). However, in this case the orbits are the result of test-particle integrations in a fixed potential. In this work we tackle the more challenging feat of extracting orbits directly from the N -body simulation. In this case, not only we should have enough particles to minimize the effect of collisions, but we should perform an N -body simulation with high standards of integration, and make sure that during the entire time window when orbits are extracted, the system remains in the same configuration. We have used the gyrfalcon method of Dehnen (2000) which is a Barnes & Hut octal tree code that obeys exactly Newton’s third law, as all force calculations preserve the symmetry of forces between pairs of particles. This results in a large degree of linear momentum conservation, besides the usual good energy conservation of tree codes.
We decided to study systems formed by very cold collapses, with initial virial ratios (2T /|W |) of 0.05 and 0.08, which result in the well-known radial orbit instability (Polyachenko 1981; Polyachenko & Shukhman 1981; Merritt & Aguilar 1985). These collapses produce triaxial ellipsoidal final equilibrium configurations (Aguilar & Merritt 1990). As such, they should have a rich orbital structure which makes them ideal for this study. Furthermore, cold collapses are probably one of the formation mechanisms of dark halos and luminous elliptical galaxies.
In § 2 of this work we discuss the construction of cold, out-of-equilibrium initial configurations as well as their collapse and relaxation phase. § 3 addresses the orbit integration stage, the total and individual energy conservation tests of our relaxed systems and their final shapes. In § 4 we analyze the orbit extraction and classification process. § 5 presents three extended N -body simulations characterized by a finer error in the conservation of individual particle energies, § 6 contains a final discussion.
2. Collapse simulations: initial conditions and methods
Our initial conditions are 106 particle, isotropic Hernquist spheres (Hernquist 1990), scaled out of equilibrium to have a binding energy of -0.1 and an initial virial ratio of 0.05 (Model A) and 0.08 (Model B). A million particles was chosen because it was the largest set we could integrate within a reasonable time with the computing infrastructure at our disposal. As we will see later, this was enough to bring down collisional effects to a level that would not preclude our successful orbit extraction during the time window we employed.
We used Dehnen (2000) tree code: gyrfalcon. We chose this code because it incorporates explicitly Newton’s third law in its force calculation, resulting not only in a more efficient code (as pair wise forces are computed for both particles), but one that conserves linear momentum to a high degree. The two main parameters that define a run in this code are the softening length (ε) and the tolerance (θ). We found optimal values for them by trial and error, using several collapse runs with our initial conditions varying their values and monitoring energy conservation. The values we used are listed in Table 1.
Table 1 Model parameters
| Model | ε | θ | Ei | Li | (2T/W)i | Time span (in tcross) | Time to equilibrium (in tcross) | δ(2T/W) (in equil.) | δE (in equil.) |
|---|---|---|---|---|---|---|---|---|---|
| A | 0.038 | 0.204 | −0.10 | 0.00022 | 0.05 | 100 | 1 | 0.6% | 0.00003% |
| B | 0.040 | 0.200 | −0.10 | 0.00028 | 0.08 | 70 | 1 | 0.4% | 0.0004% |
We ran our experiments using the computing facilities of the CyberSHARE Center of Excellence and the 48 cores of the Research Cloud VCL environment at the University of Texas at El Paso (UTEP). We used the nemo toolbox (Teuben 1995) to create our initial conditions and to do all the necessary manipulations to analyze the simulations.
Projections on the plane that contains the major and minor axes of the collapsing configurations are shown in Figure 1 for Model A and Figure 2 for Model B. Figure 3 shows the run of the virial ratio as a function of time. In both cases the virial ratio settles within 10% of its equilibrium value within 6 time units (1 tcross). After this, fluctuations of 0.6% for Model A and of 0.4% for Model B are present. Model A was simulated for 600 time units, Model B for 420 time units, which corresponds to 100 and 70 standard crossing times (tcross), respectively. Here, tcross = (R3/GM)1/2. The energy is conserved to the level quoted in Table 1.
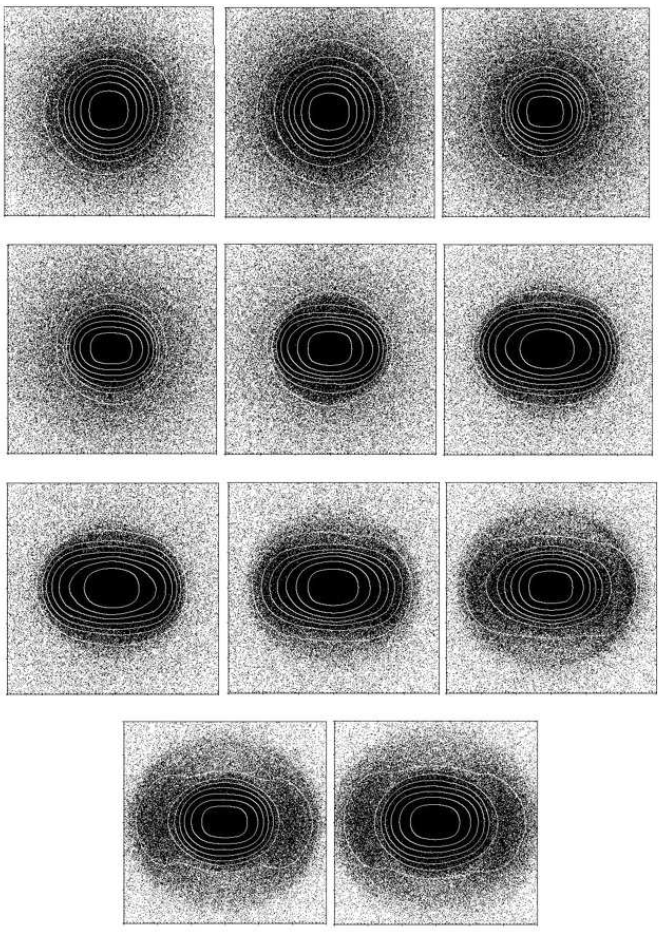
Fig. 1 Sequence of spatial projections on the XZ plane for Model A [(2T /|W |)i = 0.05] during the collapse and relaxation stage from its initial configuration. The frames span an interval of 50 tcross (t: 0-300). t=600 is the total collapse and relaxation time for this model. Images are spaced by 5 tcross and cover a central area of 60 × 60 distance units. The systems were rotated to make their major and minor axes lie on the plane of the paper.
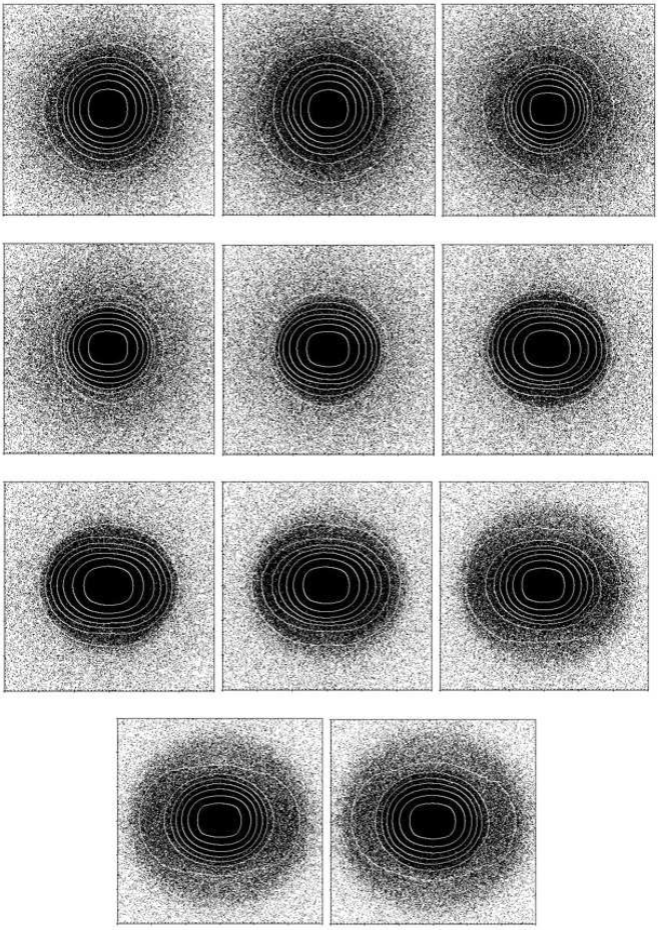
Fig. 2 Sequence of spatial projections on the XZ plane for Model B [(2T /|W |)i = 0.08] during the collapse and relaxation stage from its initial configuration. The frames span an interval of 50 tcross (t: 0-300). t=420 is the total collapse and relaxation time for this model. Images are spaced by 5 tcross and cover a central area of 60 × 60 distance units. The systems were rotated to make their major and minor axes lie on the plane of the paper.
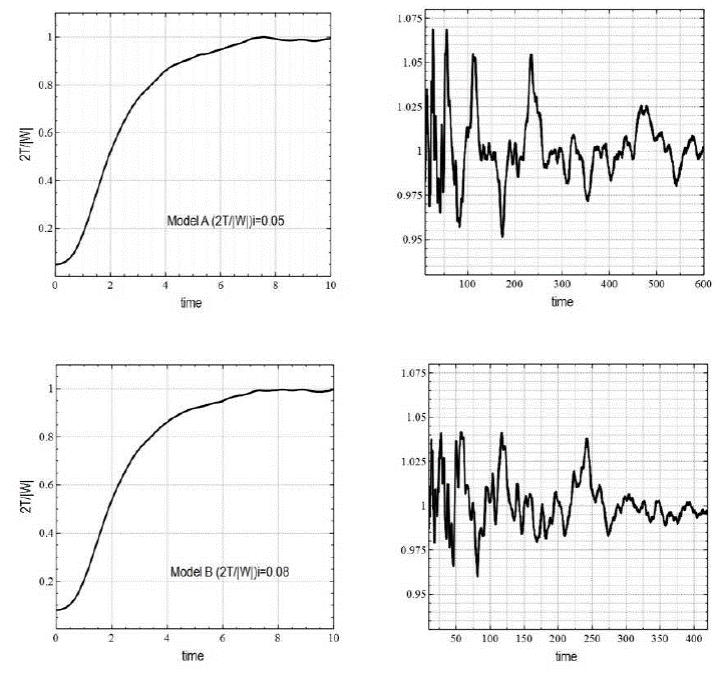
Fig. 3 Virial ratio 2T/|W| as a function of time for our cold-collapsed simulated galaxies during their initial collapse and relaxation period. Time is expressed in system units. Top: Model A (t: 0-10 and t:10-600, equivalent to t=0-100 tcross). Bottom: Model B (t: 0-10 and t:10420, equivalent to t=0-70 tcross). Hernquist spheres with 106 particles were initially cooled down to a virial ratio (2T/|W|)i of 0.05 (top) and 0.08 (bottom). The systems underwent violent relaxation and their virial ratios settled within 10% of their equilibrium value within ≈ 6 time units.
3. Orbit integration, energy conservation tests and shapes of the relaxed systems
Once relaxed from the small fluctuations of the virial ratio around unity, Figure 3, Models A and B were evolved and integrated for 85 crossing times. The resulting configurations after this process were then called Models 1A and 1B. During the integration, possible changes in the total energy of the system were constantly monitored. The virial ratio (2T /W ) showed negligible oscillations around unity, with mean variations smaller than 1% (Figure 4).
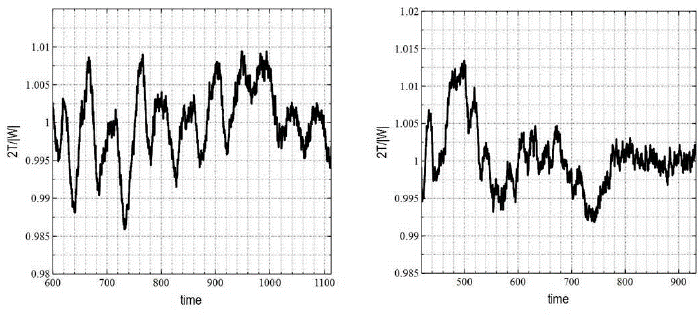
Fig. 4 Virial ratio as a function of time for our relaxed systems during the entire orbit integration interval of 85 tcross. Average fluctuations of less than 1% around unity on both Model 1A (left), and 1B (right) are shown. The vertical axis on both graphs spans a virial ratio interval of 0.035 units.
As the integration took place, the total energy fractional error (Ef e) was carefully calculated. We monitored the total energy of our models throughout the full integration process to verify its constancy. Ef e never exceeded 3×10⁻⁷ during the entire simulation of Model 1A (our best one), or 4×10⁻⁶ for Model 1B (Figure 5). Since the resulting stellar orbits have to be finely sampled for the purposes of a robust classification, a short time step (∆t = 0.00781) was selected during the integration process, such that each individual orbit would be sampled by a total of at least 4096 points. As we will see later, 4096 is a reasonable minimum number of points for a reliable sampling of the orbit for a spectral dynamics-based orbit classification code such as taxon (Carpintero 2013, private communication). Integrating each of the 1 million-particle ensembles for 85 crossing times took 24 days of CPU time. The resulting output files contained detailed orbital data for 106 particles and had typical sizes of 60 Gb.
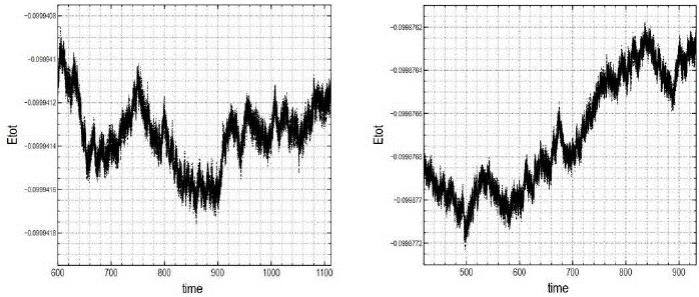
Fig. 5 Total energy as a function of time for Models 1A (left) and 1B (right) over the entire orbit integration interval of 85 tcross. The total energy fractional errors (Efe) are 3×10⁻⁷ (left) and 4×10⁻⁶ (right). The vertical axis on both graphs spans an energy interval of 0.0000012 units.
3.1. Energy Conservation of Individual Particles
That collisional effects in our models did not accumulate to a level that invalidated the identification of particle trajectories with orbits can be verified by monitoring the degree of total energy conservation of the system, and that of the individual particles. During our integration for 85 crossing times in both models, the total energy fractional error was small (no greater than 4×10⁻⁶), a good indication that the total energy of our systems was well conserved. We then proceeded to verify the conservation of energy of the individual particles.
It must be pointed out that during the initial collapse of our cold configurations towards a steady state violent relaxation came into play (Lynden-Bell, 1967; Binney & Tremaine, 2008), and was responsible for changing the individual energies of the particles even though the total energy of the ensemble remained constant. Once the system reached a relaxed state, both the total energy and the individual energies should remain constant.
A good way of assessing the conservation of energy of individual particles is through the root meansquare error (rms) of individual particle energies over the full integration interval (85tcross). The rms error of individual energies was calculated for all the particles in both models. The resulting plots of log(δErms/∆t) versus initial energy for each of the 106 particles of each model are shown in Figure 6 (“giraffe plots”, given its resemblance to the African mammal’s head and neck).
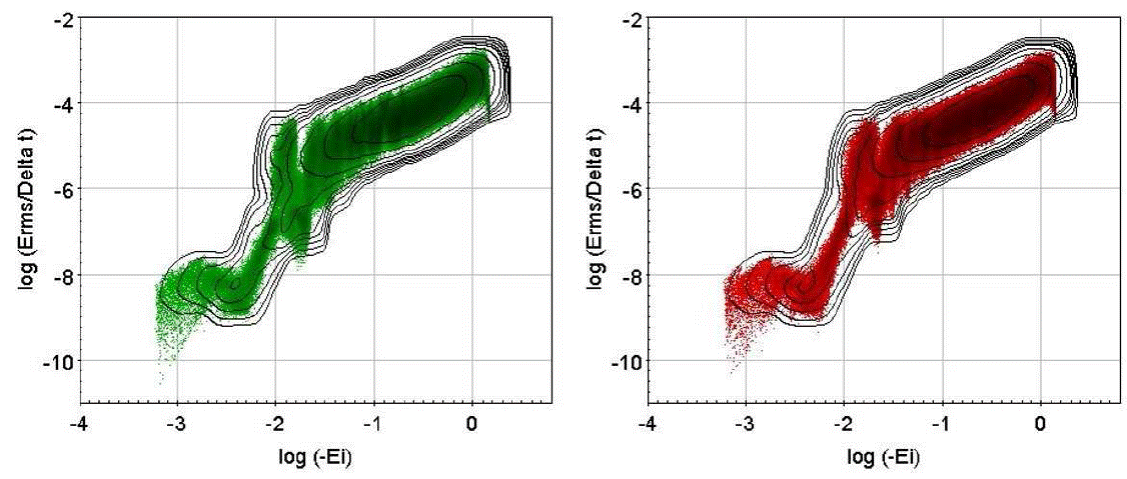
Fig. 6 Root mean-square errors of individual particle energies as a function of initial binding energy (“giraffe plots”) for the 106 particles of Model 1A (left) and Model 1B (right). Conservation of individual energy improves for the least tightly bound particles on both systems (lower-left corner). For the time interval considered (85 tcross), a few of the most remote and least energetic particles can reach negligible errors of ≈ 10−10. Particles in the lower-left quadrant of this plot are the ones whose orbit types are most uncertain, not covering a large enough number of orbital periods for a reliable classification. The isodensity contours show that the most populated region in both diagrams is the middle of the giraffe’s neck.
Figure 6 clearly shows a moderately good conservation of energy for the most tightly-bound orbits (upper-right region of the diagram) and an excellent conservation for the least tightly-bound ones (lower-left one); however, the latter have such long orbital periods that not even the longest integration intervals adopted in this work could sample a large enough number of orbits to be classified with a good confidence level.
3.2. Final Shapes of the Relaxed Spheroids
After the orbit integration process was completed, we were able to determine the final, intrinsic shapes of our relaxed systems of particles. For this, we computed the tensor of inertia (TOI) at t=1112 (Model 1A) and t=932 (Model 1B); this allows to line up the systems’ principal axes with the (x, y, z) coordinate axes. We did this by considering 80% of the most tightly bound particles using nemo, as well as their corresponding eigenvectors and eigenvalues. The semi-axes (a, b, c) of our final configurations were determined from the square roots of the eigenvalues, and we plotted a, b and c as a function of time during the full 85 postrelaxation crossing times of these simulations to verify their constancy. Figure 7 illustrates the small changes in time for the two models considered, thus confirming that our systems had reached a steady state within 5% fluctuations of the TOI eigenvalues.
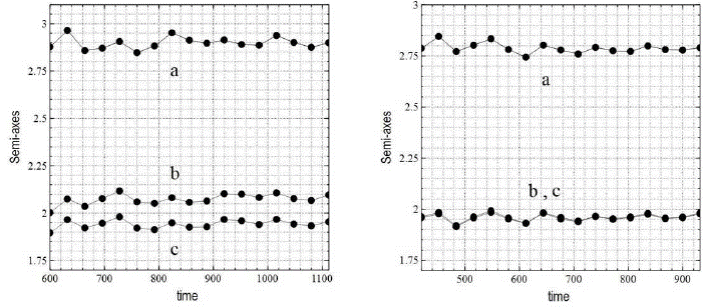
Fig. 7 Spheroid semi-axes as a function of time for the entire integration interval of 85 crossing times in Model 1A (left) and Model 1B (right), including the 80% most bound particles in both. Both models reached a steady state configuration and constant shape. The semi-axes show that Model 1A has a slightly more triaxial geometry than Model 1B, whose minor and intermediate axes, equal in magnitude, indicate a frankly prolate configuration.
We also used the triaxiality index (Aguilar and Merritt, 1990)
to evaluate the intrinsic shapes of our models. For this, we considered both the 80% and 60% of the most bound particles (mbp) in Table 2.
Table 2 Final shapes of relaxed spheroids
| Model, 80% mbp | a 2.8778 | b 2.0035 | c 1.8961 | c/a 0.66 | Triaxiality index (τ) 0.109, prolate-like spheroid |
|---|---|---|---|---|---|
| 1A, 60% mbp | 1.4998 | 0.9404 | 0.8574 | 0.57 | 0.129, prolate-like spheroid |
| 1B, 80% mbp | 2.7877 | 1.9635 | 1.9585 | 0.70 | 0.006, prolate spheroid |
| 1B, 60% mbp | 1.5362 | 0.8726 | 0.8675 | 0.56 | 0.008, prolate spheroid |
In Figure 8 the resulting intrinsic shapes of the simulated and rotated galaxies are shown through their projections on the XY, XZ, YZ planes for the 80% mbp. Radial orbit instability takes place and is responsible for deforming the originally spherical systems, which gradually adopt a typical spheroidal/triaxial shape. Our results show that the final intrinsic shapes of the relaxed models are truly prolate.
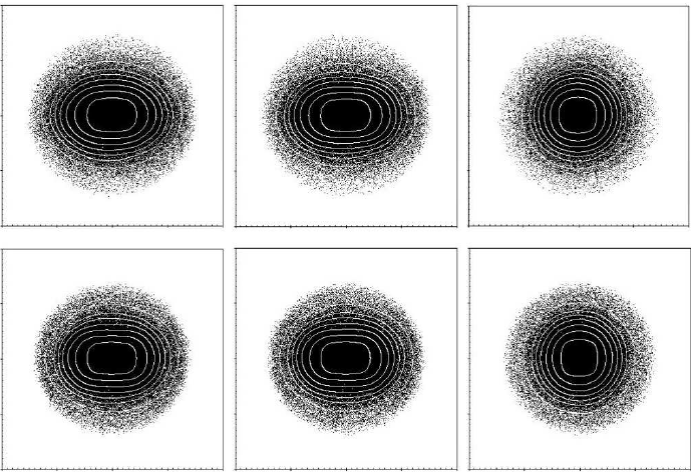
Fig. 8 Final shapes of our relaxed spheroids. Their XY, XZ and YZ projections (from left to right) including the 80% mbp are shown. Top series: Model 1A (τ = 0.109) after 100 tcross; bottom series: Model 1B (τ = 0.006) after 70 tcross. Images cover a central area of 40 × 40 distance units. A central bar dominates the mass distributions and defines their prolate-like and prolate shapes. The systems were rotated to make their axes lie on the plane of the paper.
4. Orbit extraction and classification
4.1. Orbit Extraction
A fundamental goal of this project is to simulate cold-collapsed spherical systems where the effect of collisions is negligible for the time intervals considered. This has been accomplished by means of (a) the selected, relatively high number of particles (106); (b) the particular simulation parameters we used, which yielded an excellent conservation of total energy; and (c) the small individual particle energy errors obtained.
The orbit extraction was done for both simulations in the time window that goes from t=600 to t=1112 (Model 1A) and from t=420 to t=932 (Model 1B), a span of 85 tcross at the half-mass radius, starting 100 and 70 such crossing times after the initial collapse. As we saw in the previous section, during this time window the systems have settled down and fluctuations in energy, virial ratio and inner structure, as gauged by the inertia tensor, are small. This is a fundamental condition to claim that the extracted trajectories correspond to orbits in a fixed potential. Phase space information for all particles during this time window was extracted using a Fortran code (extrilla) written for this purpose by Dr. Tunna Baruah and H. Noriega-Mendoza (UTEP). The most recent version of this code can extract 106 orbits in about 50 hours of CPU time, implying an extraction speed of ≈ 20, 000 orbits per hour. The code extracts orbits with a routine that efficiently reads and sorts the positions (x, y, z) in time (at constant time intervals) of all the individual particles from a very large data file, output by the N-body simulation. In this way, individual orbits are obtained for the entire set of 106 particles over the full integration interval.
Given the wide dynamical range in the energies of the resulting orbits, a number of them (particularly the least bound ones) have not completed a minimum number of periods after the 85 crossing times of our first two integrations (Models 1A and 1B); so they must be rejected from the classification process because they do not meet the necessary criterion of at least 80 orbital periods completed. However, many of the rejected particles show some of the smallest individual energy changes of our samples. As we will see in the last section, even though collisional effects are negligible for these remote particles -implying an excellent conservation of individual energies-, they are so far away from the center of the system that their orbits are reduced to short arcs, insufficient for a reliable classification.
4.2. Orbit Classification
The orbit classification was possible using the taxon code (Carpintero & Aguilar 1998). This code classifies orbits by performing a Fourier analysis of them [in configuration space only in the original code; with full phase space information in the latest version we used (Carpintero, private communication)]. It is based on the concept of spectral dynamics (Binney & Spergel 1982) and has been used by other authors as a reliable classificator (e.g. Gómez et al. 2012; Vasiliev 2013; Zotos 2014, Wang, Athanassoula and Mao 2016). taxon is particularly suitable for this project because of the automatic character of the code, which allows the quick classification of large samples of orbits (hundreds of thousands of them) in a semi-automatic fashion.
For a good classification, (besides a good energy conservation for the individual particles) the number of sampled points along the orbit, as well as the number of orbital periods covered by the sampling are crucial. In their article, Carpintero & Aguilar (1998) suggest a minimum of 4096 points spanning 80 to 300 periods; hence, every run with taxon allowed us to classify orbits once these three criteria were met:
No=4096 (a minimum number of 4096 (x,y,z) points sampled per orbit; in TAXON this number must always be a power of 2).
80 < Np < 300 (a minimum of 80 and a maximum of 300 periods covered per orbit, resulting in an optimal sampling rate of 50 points per orbital period).
a < log(δErms/∆t) < b (a predetermined interval for the allowed rms error of individual particle energies).
Since all of our runs were set to allow 4096 (x,y,z) points sampled per orbit, the second and third criteria helped us to assess the quality of our classification process, once the individual particle energy changes were minimized. Our results show that, given the gyrfalcon integration period covering 85 crossing times, only about 16% of all the particles (106) in Models 1A and 1B had enough time to complete at least 80 and no more than 300 orbital periods. The remaining 84% were a combination of (a) less tightly bound particles with much longer orbital periods; (b) those that reached the escape velocity to become unbound; and (c) tightly-bound particles that exceeded 300 orbital periods. Our calculation of the rms errors of individual particle energies indicated that, given an integration interval of 85 crossing times, we could reach rms errors of the order of
in the corresponding “giraffe plots” of Models 1A and 1B. Once this third individual energy conservation criterion for particles was introduced, we ended up with 11,602 (Model 1A) and 15,805 (Model 1B) very well-sampled, well-classified, highly reliable orbits. In this sense, our orbital analysis was constrained to samples containing 1.1 and 1.5% of the original populations of stars, spanning a moderate range of binding energies in our simulated galaxies (Figure 9). taxon completed the classification process of 106 orbits in about 180 hours of CPU time, equivalent to a rate of 5,500 orbits per hour. A typical taxon output data file includes 8 columns with information on: (1) number of orbital periods sampled per particle; (2) taxon classification code; (3), (4), (5) fundamental frequencies; (6), (7) and (8) resonances.
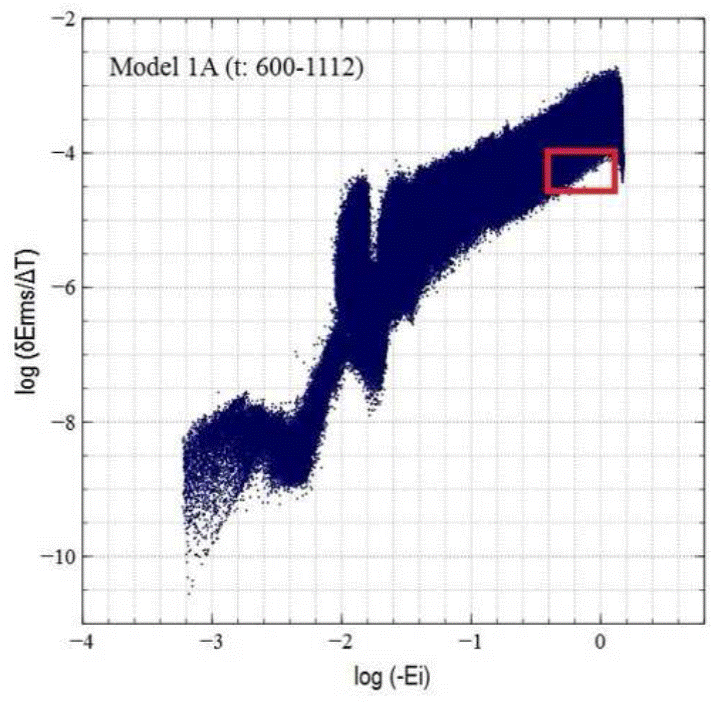
Fig. 9 Region of the “giraffe plot” occupied by the 11,602 particles in Model 1A, whose orbits met the three selection criteria discussed in the text. A similar region was identified for Model 1B. An rms error interval of 4.5 < log(δErms/∆t) < -4.0 in the individual particle energies represents the minimum achievable error for an integration period of 85 crossing times in Models 1A and 1B.
The classification process yielded the results for the relative number of particles belonging to the different orbit types shown in Table 3.
Table 3 Orbit classification
| Model | Orbit type Open long-axis tube | Taxon classification code 311 | % of total number of classified orbits 51% |
|---|---|---|---|
| 1A | Open box | 300 | 34% |
| Chaotic | 411 | 5% | |
| Open short-axis tube | 313 | 4% | |
| Open boxlet | 310 | 3% | |
| Thin long-axis tube | 211 | 3% | |
| 1B | Open long-axis tube | 311 | 75% |
| Open box | 300 | 14% | |
| Chaotic | 411 | 5% | |
| Thin long-axis tube | 211 | 4% | |
| Open boxlet | 310 | 2% |
Histograms with the number or particles for each orbit type as a function of binding energy are shown in Figure 10. The preponderance of long-axis tube and open box orbits is obvious in both models, and even though their relative abundances change, open x tubes dominate the orbital makeup with at least 50% of the total number of particles in both models. Chaotic orbits contribute 5% of the total number of selected particles in our prolate and prolate-like systems. XY, XZ and YZ projections of the three most abundant orbit types resulting from this classification exercise are shown in Figure 11.
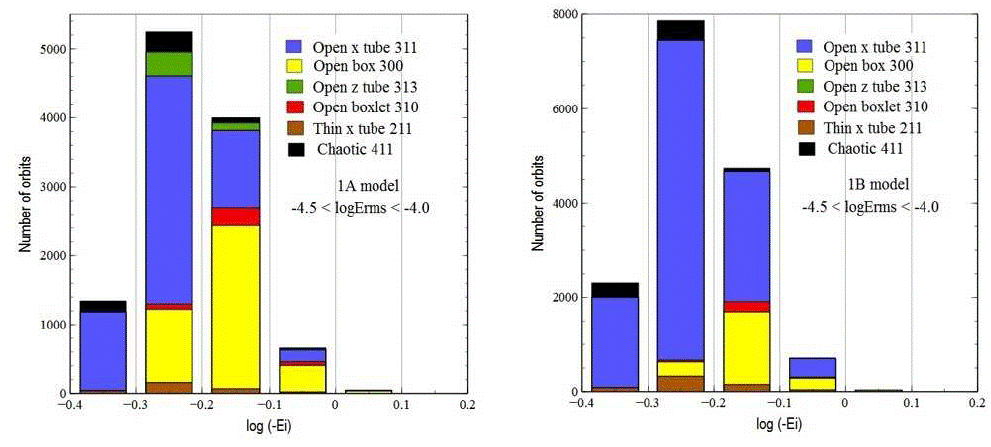
Fig. 10 Histograms of the number of particles for each orbit type as a function of initial binding energy in our simulated galaxies. The samples only include particles with the smallest individual energy errors obtained during an integration period of 85 crossing times (-4.5 < log(δErms/∆t) < -4.0 ). Long-axis open tube and open box orbits dominate in both Model 1A (left) and Model 1B (right). The most bound particles are located to the right on the horizontal axis. The statistics include a sample of 11,602 (left) and 15,805 (right) orbits that met the three selection criteria discussed in the text. 5% of the total number of selected orbits in each model are chaotic.
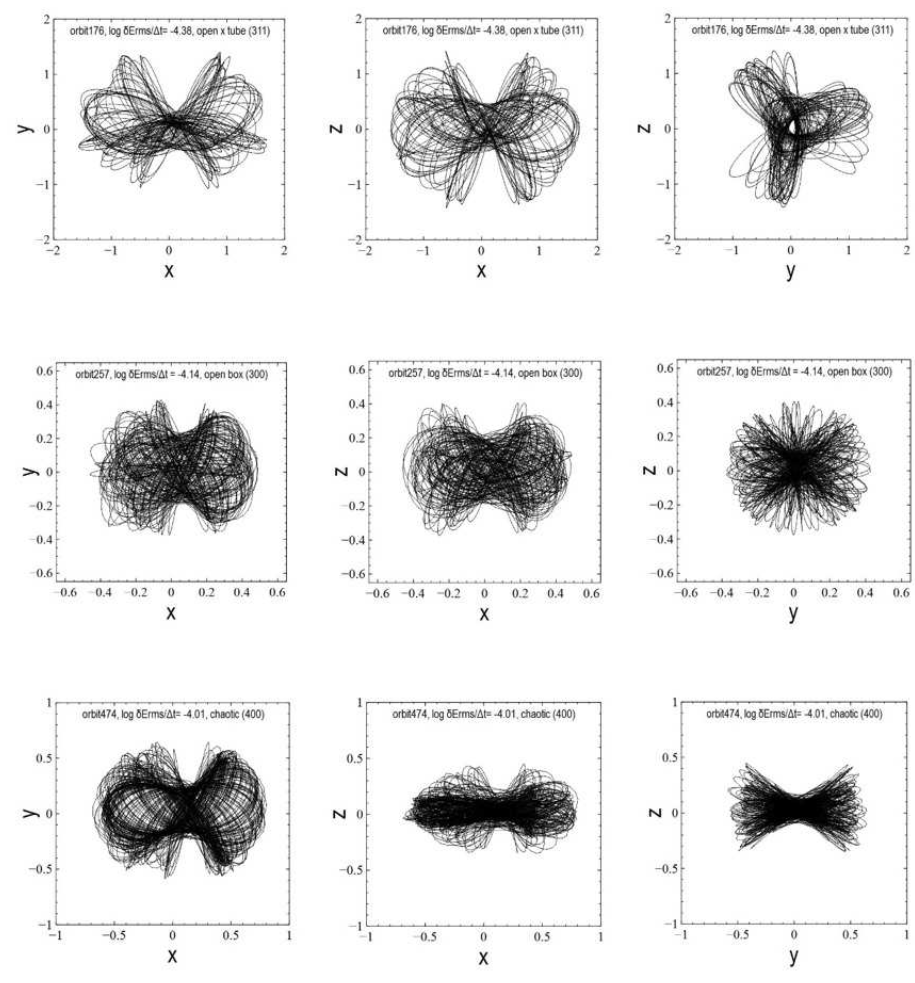
Fig. 11 The three most abundant types of orbits in Models 1A and 1B; XY, XZ and YZ spatial projections are shown from left to right. Top: An open tube around the spheroid’s major axis (x), is the most common kind of orbit in our prolate and prolate-like configurations. Middle: An open box orbit, where the particle can get arbitrarily close to the system’s center. Bottom: A chaotic orbit, much less abundant than the first two orbit types is shown.
5. Extended models
Given the excellent conservation of total energy in our initial two models, we performed two extended N-body simulations (named Model 2A and Model 2B) of our initially cold-collapsed configurations. Fundamentally, these extended runs were aimed at “capturing” a subsample of less gravitationally-bound particles with smaller rms errors in their individual energies that, given a sufficiently long integration interval, could also cover a minimum of 80 orbital periods for a robust classification. Thus, these orbits would meet the first two selection criteria described above, plus a stricter third one, since our goal this time would be to reach at least an rms error in the interval
We wanted to minimize the individual particle energy errors of our selected orbits even further. In the end, it was this criterion that ultimately defined the robustness of the individual orbit extraction and classification process. We accomplished this goal by doubling and even quadrupling the integration time of Models 1A and 1B, as we kept close track of the conservation of total energy. As expected, longer runs allowed us to consider those particles with small, intrinsic individual energy errors that, at the same time and given a sufficiently long time interval, were able to complete a larger number of orbital periods. Smaller individual energy errors together with a larger number of completed orbits per particle was possible at the expense of the conservation of total energy of the systems; the fractional error (Efe) was now ≈ 10-5, still acceptable for the purposes of this work.
It turns out that, once a longer integration time is allowed, the never-fully-absent collisionality of the systems becomes more important towards their central parts, where the most gravitationally-bound particles are subject to collisional relaxation, mostly due to two-body interactions. Individual particle energy changes occur preferentially at small radii, as confirmed in our simulations, allowing us to better sample more remote particles with both a large enough number (at least 80) of completed orbital periods and smaller individual energy changes enabling a reliable orbit classification via taxon. Such cumulative changes of individual particle energy at small radii are responsible for the small, yet global, change in the total energy of the systems.
5.1. Models 2A and 2B
Based on the previous argument confirmed by our tests, we extended our two initial N-body simulations by integrating Models 1A and 1B with gyrfalcon for 170 crossing times. Models 2A and 2B were run for twice as long as the corresponding initial experiments and took an equivalent to 48 days of CPU time. Figures 12 and 13 illustrate the virial ratio and total energy variations in time for Models 2A and 2B through the entire integration interval of 170 tcross. Both parameters are very well conserved; the virial ratio mean fluctuations are less than 0.5%, evidence of a complete virialization in both models. As expected for a simulation twice as long, the total energy in both models does not show the excellent level of constancy of the original configurations, as the slowly, yet steadily increasing curves indicate.
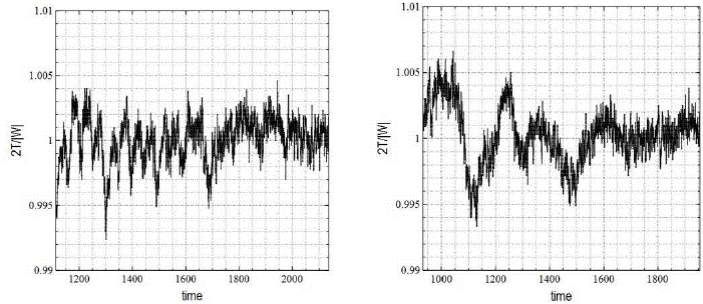
Fig. 12 Virial ratio as a function of time for the entire integration interval in Models 2A (left) and 2B (right), equivalent to 170 tcross. The virial ratio shows mean variations of less than 0.5%, evidence that both configurations reached a steady state after complete virialization.
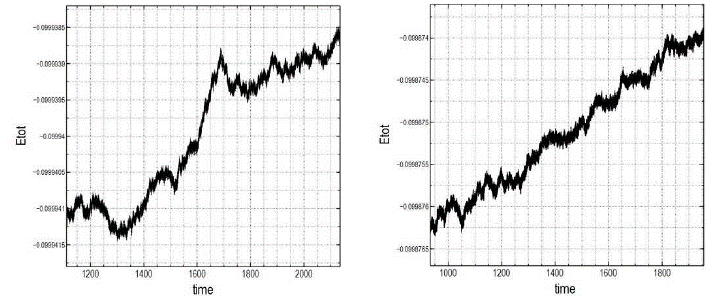
Fig. 13 Total energy as a function of time for the entire integration interval of 170 tcross in Models 2A (left) and 2B (right). Run for twice as long as their predecessors (Models 1A and 1B), the total energy shows a steady increase in both models, which implies a total energy fractional errors of 2.6×10⁻⁵ (left) and 2.4×10⁻⁵ (right).
Nonetheless, these errors are still perfectly acceptable for the purposes of this work, since this second series of runs improves our chances of including particles with an excellent conservation of individual energy, as we show below.
Additional support for the high stability of the final configurations, confirming the fact that the gravitational potential was no longer time-dependent, came from the constancy of the systems’ principal semi-axes a, b and c in Models 2A and 2B (Figure 14), confirmed by the XZ projections of both spheroids -the plane on which the systems’ elongations are more evident-, which show a constant, final ellipsoidal geometry. Compare the initial and final frames of the integration interval of 170 tcross. These were the ideal conditions for the orbit extraction stage.
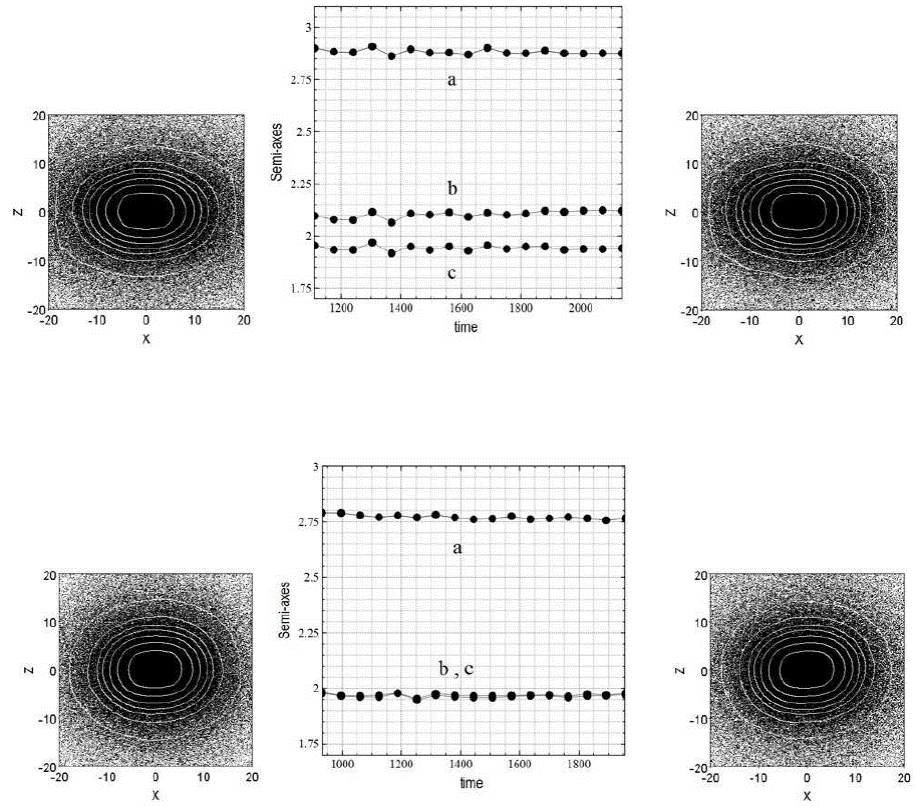
Fig. 14 Projections on the XZ plane of Models 2A (top) and 2B (bottom) at the beginning and end of the integration interval of 170 tcross. The virialized, elongated final shapes of the spheroids are clear, confirmed by the lengths of their corresponding principal semi-axes a,b and c (shown between the images). The 80% mbp were included. The constancy of these lengths implies a constant triaxiality index for each configuration.
After performing the stability tests, we analyzed the conservation of energy of individual particles in our systems. Although the total energy fractional errors (Efe) of Models 2A (2.6×10⁻⁵) and 2B (2.4×10⁻⁵) were greater than those of their corresponding progenitors, we were able to sample a population of particles whose individual energy root mean square errors reached 10-5.0 - 10-4.5 (Figure 15).
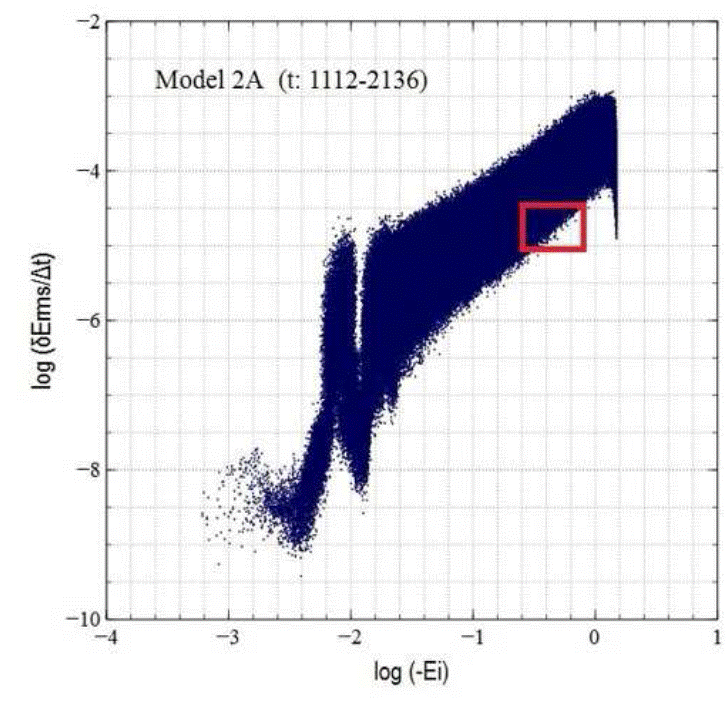
Fig. 15 Region of the “giraffe plot” of the rms individual energy errors occupied by the 5493 particles of Model 2A, whose orbits met the three selection criteria discussed in the text. A similar region was identified for Model 2B. An rms error interval of -5.0 < log(δErms/∆t) < -4.5 in the individual particle energies represents the minimum achievable error for an integration period of 170 crossing times for Models 2A and 2B.
Hence, at the expense of a small loss of accuracy in the conservation of total energy, more particles with smaller individual energy errors and better time-sampled orbits became available, the key to a robust orbit classification. Table 4 shows the main orbital families classified by taxon once 5493 particles in Model 2A and 7734 in Model 2B met the first two previously established criteria for Model 1A, plus a larger individual energy error interval (10-5.0 - 10-4.5 in this case). Figure 16 presents the histogram as a function of binding energy corresponding to the orbit types in Table 4.
Table 4 Orbit classification
| Model | Orbit type Open box | Taxon classification code 300 | % of total number of classified orbits 43% |
|---|---|---|---|
| 2A | Open long-axis tube | 311 | 37% |
| Open short-axis tube | 313 | 9% | |
| Chaotic | 411 | 6% | |
| Chaotic | 400 | 3% | |
| Open boxlet | 310 | 2% | |
| 2B | Open long-axis tube | 311 | 73% |
| Open box | 300 | 17% | |
| Chaotic | 411 | 8% | |
| Open short-axis tube | 313 | < 1% | |
| Chaotic | 400 | < 1% | |
| Open boxlet | 310 | 1% |
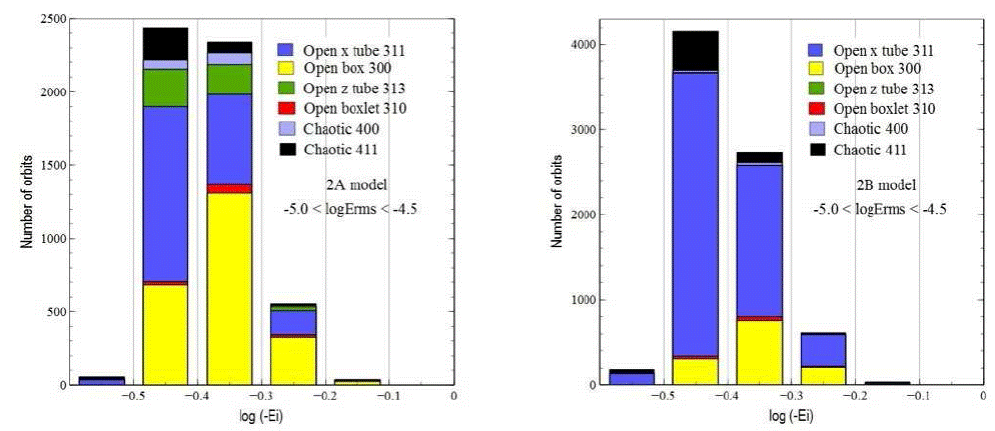
Fig. 16 Histograms of the number of particles of each orbit type as a function of initial binding energy for Models 2ª (left) and 2B (right). The samples only include particles with the smallest individual energy errors obtained during an integration period of 170 tcross (-5.0 < log(_Erms/_t) < -4.5). As in Models 1A and 1B, long-axis open tubes and open boxes are the dominant types of orbits. The most bound particles are located to the right on the horizontal axis. The statistics include a sample of 5493 (Model 2A) and 7734 (Model 2B) orbits that met the three selection criteria discussed in the text. Roughly 10% of the total number of selected orbits in each model are chaotic.
A good, straightforward way of verifying the conservation of individual particle energies in our Nbody simulations, in addition to the “giraffe plots”, is a plot of the fluctuations of the individual energies of those particles as a function of time through the full integration interval of Model 2A (t: 1112-2136, ≈ 170 tcross). Such a plot is shown in Figure 17 for a sample of particles within an arbitrary interval of energies.
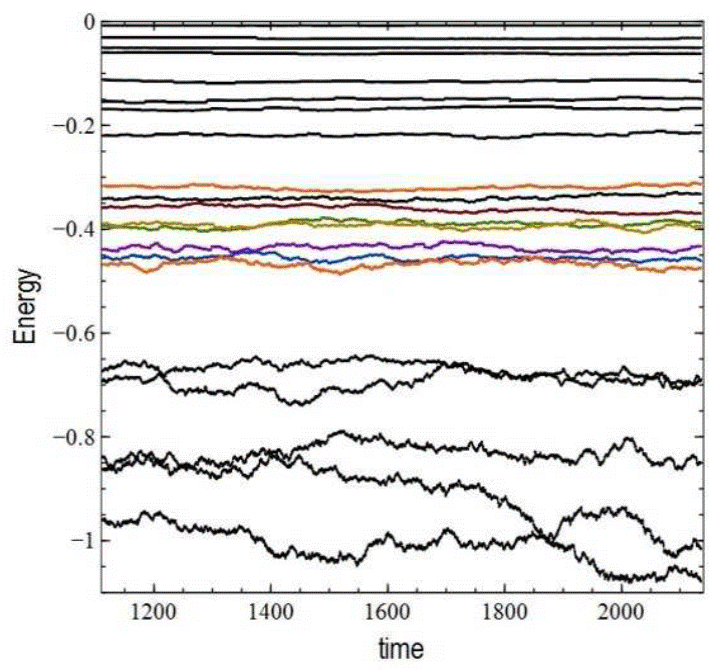
Fig. 17 Individual energies as a function of time for a sample of particles in Model 2A in an arbitrary interval of energies. The most bound particles (bottom) are subject to a greater collisional relaxation effect due to 2-body encounters, and their energies fluctuate following the typical random walk of a diffusive process. The least bound particles (top) are much less affected by this effect and their initial binding energies remain practically constant for Ei ≥ −0.2. A subsample of the 5493 selected and classified orbits of Model 2A whose individual energy rms errors lie in the interval -5.0 < log(δErms/∆t) < -4.5 is also shown for comparison in the middle section of the plot (-0.5 < E < -0.3). Model 2A was integrated using the optimal (ε,θ) pair that minimizes the total energy conservation error.
The particles of Model 2A, whose energies are shown in the uppermost and lowermost regions of the diagram, were randomly selected to cover the energy interval. The middle region centered at E ≈ −0.4 is occupied by a subsample of 5493 selected orbits whose individual energy rms errors lie in the interval −5.0 < log(δErms/∆t) < −4.5. The small errors are justified by the constancy of these particles’ paths in Figure 17. Even though the characteristic random walk describing the variations of such energies in time is obvious for the most bound particles (lowermost region where E < −0.6), which are more exposed to interactions with neighbors, the least gravitationally bound particles (E > −0.2) are much less subject to these encounters, so their initial, individual binding energies tend to remain unchanged in time. In Figure 17, such particles define orbits along which the binding energy is practically constant. However, most of them have not completed a minimum number of periods to be reliably sampled and classified, not even in our longest run of 340 crossing times (Model 4A).
As a comparison, Figure 18 shows the individual energy fluctuations versus time for a sample of 10 particles in a similar gyrfalcon simulation of a Plummer sphere with 106 particles. The integration time is 200 tcross, comparable to that of Model 2A (170 tcross). The paths of individual particles in both graphs show indeed the expected random walk, which is more evident in the most bound particles (left diagram). It must be emphasized, however, that this N -body simulation did not incorporate the optimal parameters to minimize the total energy conservation errors.
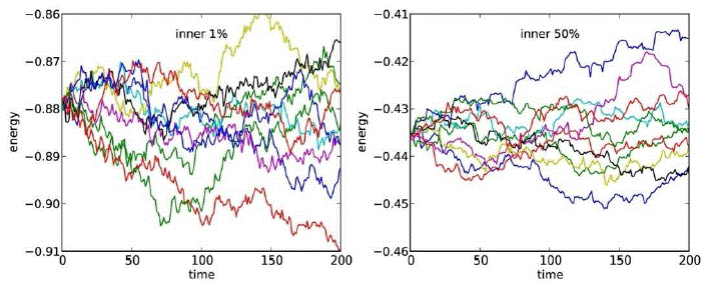
Fig. 18 Individual energies as a function of time for a sample of 10 particles in a gyrfalcon simulation of a Plummer sphere with 106 particles. The random walk is present and more evident in the most bound particles (left diagram). The 200 tcross simulation was not performed with the optimal parameters to minimize the total energy conservation errors. Courtesy of Eugene Vasiliev (private communication).
5.2. Model 4A
A second extended simulation to Model 1A, hereafter referred to as Model 4A, spanned a total integration time of 340 crossing times, the longest achieved in this work and equivalent to 96 days of CPU time, twice and four times as long as the 2A and 1A configurations, respectively. At the end of the run the total energy fractional error now increased to 3.4×10⁻⁵; we went a step further in the conservation of individual energies, requiring a subsample of particles in our system to have rms errors of 10−5.5 − 10−5.0 as they completed a minimum of 80 orbital periods (Figure 19).
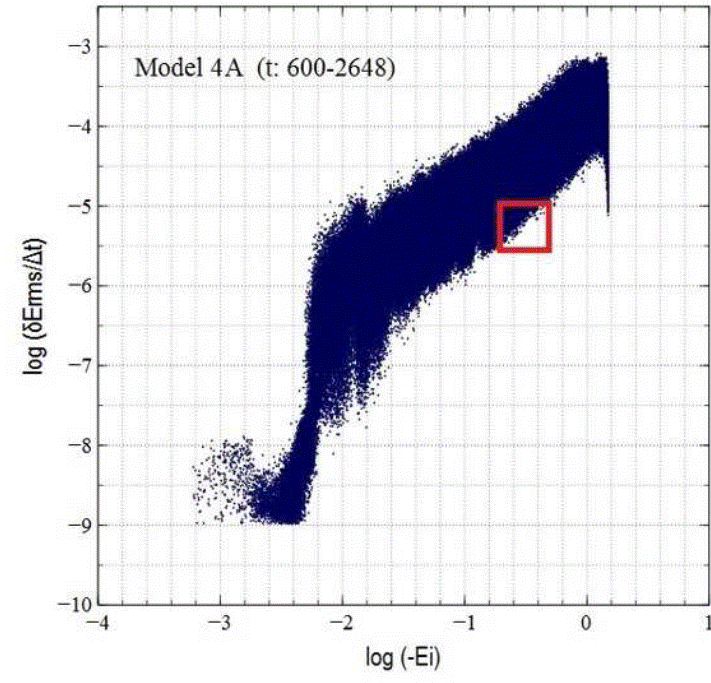
Fig. 19 Region of the “giraffe plot” of the rms individual energy errors occupied by the 1486 particles in Model 4A, whose orbits met the three selection criteria discussed in the text. An rms error interval of -5.5 < log(δErms/∆t) < -5.0 in the individual particle energies represents the absolute minimum achievable error in this work, possible after an integration period of 340 tcross in Model 4A.
Pushing the integration code (gyrfalcon) to its limits by means of optimal integration parameters and timestep, as well as the longest possible N -body run for the purposes of this work, the resulting orbit classification scheme represents our best approach to the realistic family of orbits present in prolate, elliptical galaxies resulting from a cold-collapsed scenario for this energy interval. Table 5 shows the main orbital families classified by taxon for 1486 particles in Model 4A that met the first two previously established criteria in Model 1A, plus the smallest individual energy error interval achieved in this work (10−5.5 − 10−5.0). Figure 20 presents the histogram as a function of binding energy corresponding to the orbit types in Table 5.
Table 5 Orbit classification
| Model | Orbit type Open box | Taxon classification code 300 | % of total number of classified orbits 43% |
|---|---|---|---|
| 4A | Open long-axis tube | 311 | 21% |
| Open short-axis tube | 313 | 17% | |
| Chaotic | 400 | 16% | |
| Chaotic | 411 | 2% |
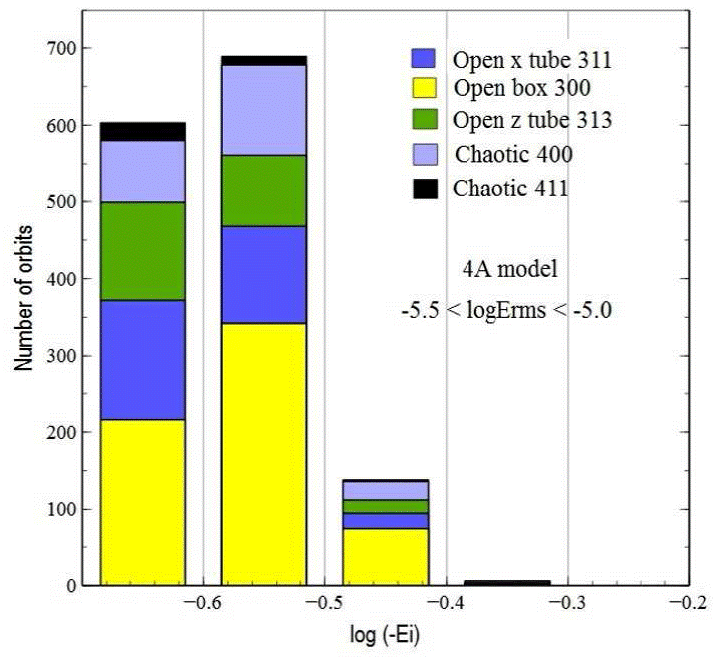
Fig. 20 Histogram of the number of particles for each orbit type as a function of initial binding energy in Model 4A. The samples only include particles with the smallest individual energy errors obtained during an integration period of 340 tcross (-5.5 < log(δErms/∆t) < -5.0). As in Models 1A and 2A, long-axis open tubes and open boxes are the dominant types of orbits. The most bound particles are located to the right of the horizontal axis. The statistics include a sample of 1496 orbits that met the three selection criteria discussed in the text. The number of chaotic orbits increased to 20% of the total in this model, a percentage comparable to that of the short-axis open tubes, found in this model.
6. Discussion
Although a significant amount of effort has been invested to understand cold collapses via N-body simulations, little has been done to approach the problem of extracting individual orbits directly from the resulting steady-state configurations of these numerical experiments. This is due to the intrinsic graininess and collisionality of the simulations, which effectively prevent us from identifying the trajectories of individual particles with their real orbits, given the scattering introduced by collisions. Nowadays however, high-precision tree codes such as gyrfalcon working with a relatively large number of particles, open up a promising possibility by making this in situ orbit extraction process possible given high standards of integration.
Our numerical simulations tracked a couple of cold collapses ((2T /|W |)i < 0.1) of a cuspy mass distribution (out of equilibrium Hernquist sphere) where collisional effects were minimized to yield two final, highly prolate, relaxed configurations with an excellent conservation of total energy and a wide interval of rms individual particle energy errors. Having reached an equilibrium state, particle energy changes are due to two-body relaxation only (Vasiliev 2013). Our work confirms this fact and shows how the individual energies of the most bound particles randomly oscillate, but also how the least bound particles -whose energies are accurately quantified by gyrfalcon-remain practically immune to the energy diffusion associated with these encounters.
Between such extremes (Figure 17), our goal has been to prove that direct orbit extraction from numerical simulations is feasible, and that there is no need to “freeze” the final N -body system configuration to extract a time-independent potential, to use in test-particle simulations to extract orbits. Indeed, we were able to extract 1-1.5% of the entire population of orbits in our models, those corresponding to particles whose individual energies showed a good level of constancy in the following three intervals of rms error:
Shapewise, our resulting prolate and prolate-like spheroids are consistent with the prolate and triaxial shapes adopted by the most luminous ellipticals, kinematically dominated by anisotropic velocity dispersions, contrary to low-luminosity ellipticals, better described as oblate isotropic rotators (Davis et al. 1983) in agreement with intrinsic oblate shapes (Statler 1987). Our results are also in agreement with the elongations, triaxialities and central bars -induced by ROI-of the final spheroids obtained under cold collapse conditions (Aguilar & Merritt 1990).
On the other hand, individual particles in our systems belong to the mostly quasi-periodic families of orbits in cuspy triaxial/prolate potentials (de Zeeuw 1985), with a clear preponderance of long-axis tubes and box orbits. Short-axis tubes are practically absent in Model 2B, evidence of its true prolaticity (Valluri et al. 2010). The fraction of chaotic orbits in this work, however, is much lower than that obtained by other authors (e.g. Zorzi & Muzzio 2012) under a similar cuspy, yet truly triaxial scenario. Since it is the shapes of orbits in phase space that determine whether or not self-consistency can be achieved, in our case of triaxial and smooth configurations it is clear that truly chaotic orbits must not dominate, as they would spoil self-consistency. This is particularly the case for highly elongated ellipsoidal shapes, like the ones we have obtained here, as chaotic orbits will tend to fill the interior of the energy-accesible equipotential surface with the wrong shape, given that the Laplacian operator that connects the isodensity and equipotential surfaces via Poisson equation does not conserve curvature, thus opposing self-consistency.
This numerical exercise to extract and classify orbits from live N -body simulations of cold-collapsed systems motivates further work, involving the possibility of constructing self-consistent models of galaxies with the orbit superposition method being the most important one. The available library of reliably classified orbits resulting from this work provides the fundamental element to carry out such a project, where we could compare the orbital makeup of these systems (shaped by violent relaxation) with the range of self-consistent systems that can be built using Schwarzschild’s (1979) method. Among the available, improved tools to accomplish this goal is smile (Vasiliev 2013), a code specially designed to construct self-consistent models of galaxies from a library of orbits.


 nueva página del texto (beta)


