


 nueva página del texto (beta)
 Inglés (pdf)
 Artículo en XML
 Referencias del artículo
 Enviar artículo por email
 Citado por SciELO
  Similares en
SciELO
Similares en
SciELO 
 Permalink
1. Introduction
The linear polarization of starlight can be very useful for studying the nature of the interstellar medium (ISM). This type of polarization results from starlight passing through several clouds of interstellar dust grains that are aligned with the Galactic magnetic field. Thus, this type of studies provides information about the distribution of interstellar dust and the structure of the magnetic field (e. g. Heiles 1996), as well as on the nature and size of the dust particles (Whittet et al. 1992).
In particular, young star clusters are very good candidates for polarimetric observations because many of them have been studied through photometric and spectroscopic techniques. Parameters such as distance, membership, spectral types, color excess, etc. have been determined. Having studied several of these objects in the Southern Hemisphere, we are pioneers in the use of polarimetric tools (Feinstein et al. 2003a, Feinstein et al. 2003b, Martinez et al. 2004, Vergne et al. 2007, Feinstein et al. 2008, Orsatti et al. 2010, Vergne et al. 2010, etc). We developed a number of applications to help us detect the presence (if any) of intracluster dust and, with additional observations of non-member stars, to study the distribution of interstellar dust along the line of sight to them. Some of the objects are spread over a significant which makes it possible to analyze the evolution of the physical parameters of the dust over the region where the clusters are located. Polarimetric measurements are useful for establishing memberships (e.g. Orsatti et al. 2001, Vergne et al. 2010), for detecting energetic phenomena in the history of a cluster (Feinstein et al. 2003a) and for identifying stars with non-interstellar polarization, such as stars with extended atmospheres. Dust-rich regions, like the where the open cluster NGC 6249 is located, are best suited for polarimetric studies of the associated interstellar material.
NGC 6249 (C1654-447) is an intermediate-age open cluster (2.4 x 10⁷ years) located in the dusty Scorpius region at l = 341° 7, b = -1.19°. It covers a relatively small of the sky of about 6' in diameter and it has a mean extinction Eb-v of 0.45 mag, with a B3V star as the earliest spectral type on the main sequence. The first photometric study of this cluster was conducted by Moffat & Vogt (1973), who observed 15 of the brightest stars in the field using photoelectric photometry; they reported a distance of 1.03 kpc from the Sun. More recently, McSwain & Gies (2005b) carried out a CCD photometric survey of Be stars in open clusters, including NGC 6249, using Stromgren b,y and narrowband Hα photometry.
In this work we studied the distribution, size and efficiency of the dust grains that polarize the starlight and the different orientations of the Galactic magnetic field along the line of sight to NGC 6249. Moreover, we intended to detect stars with evidence of intrinsic polarization and to understand its possible origin.
Finally, we compared our findings in NGC 6249 with those from NGC 6250 (Feinstein et al. 2008). This open cluster is located in the ARA region around the edge of the Scorpius region, and due to their proximity in the sky and their similarities in distance and age, we believe it is interesting to compare the polarimetric data from both clusters.
The polarimetric study of NGC 6249 is part of a polarimetric survey of southern open clusters. In § 2, we discuss the observations and data reduction. In § 3, we show the results, and in § 4 we analyze and discuss them. In § 5, we study the distribution of the dust components responsible for the observed polarization, and we compare the results of NGC 6249 with those of NGC 6250. The conclusions of our results are prsenteded in § 6.
2. Observations and data reduction
Observations in the Kron-Cousins (KC) UBV(RI)KC bands (λUeff =0.36/μm, FWHM=0.05/μm; λBeff =0.44/μm, FWHM=0.06/μm; λVeff =0.53/μm, FWHM=0.06/μm; λReff =0.69/μm. FWHM=0.18/μm; λIeff =0.83/μm, FWHM=0.15/μm) were acquired using the five-channel photopolarimeter of the Torino Astronomical Observatory (FOTOR) attached to the 2.15m telescope at the Complejo Astronomico El Leoncito (San Juan, Argentina). This instrument can make simultaneous polarization measurements in the five UBVRI bands, and the combination of dichroic beam splitters and filters attached to the field lenses is very similar to the standard UBVRI system. FOTOR has 5 diaphragms for making polarimetric measurements, which, in combination with the 2.15 m telescope, result in apertures of 5.5, 7.7, 11.0, 15.4 and 18.7 arcsecs. For additional information about the instrument, data acquisition and data reduction, we refer to Scaltriti et al. (1989). During each run, we observed a set of standard stars to determine null polarization and the zero point of the polarization position angle (Clocchiatti & Marraco 1988); this allowed us to determine both the instrumental polarization and the coordinate transformation into the equatorial system, respectively.
Polarimetric observations of a sample of 30 stars in the direction of NGC 6249 were performed from 2005 to 2009, along with other observing projects. They are listed in Table 1, which shows, in self-explanatory format, the stellar identification as given by McSwain & Gies (2005b; Column 1) additional identifications in Column 2 and the corresponding filter in Column 3, the percentage polarization Pλ and the corresponding error ϵP for each filter in Column 4. The position angle of the electric vector θλ in the equatorial coordinate system (measured from north increasing eastward) and the respective mean error ϵθ for each filter (Column 5) were computed considering the photon shot noise as the dominant source of errors.
3. Results
The sky projection of the V-band polarization vectors for the stars observed in NGC 6249 is shown in Figure 1; the vector lengths are proportional to the percentage of polarization (PV) and their orientations are given by the polarization angles (θV). The dotted line, superimposed on the figure, represents the Galactic parallel at b = -1.3°, which is inclined at approximately 38° in this region. This figure seems to show that the polarimetric vectors of most stars are aligned in a direction close to that the projection of the Galactic Plane (hereafter GP), which indicates that dust particles had enough time to relax and polarize the light with the same orientation as the GP (Axon & Ellis 1976). Generally this is a sign that the dust has not been affected by a recent perturbation (Ellis & Axon 1978) and that the orientation of the magnetic field remains almost unchanged, at least in the direction of NGC 6249. However, if we analyze in detail the observations in Table 1, the polarization angles of four stars of the sample (#140, #146, #150 and #253) show a departure of between 8° and 11° from the orientation of the GP.
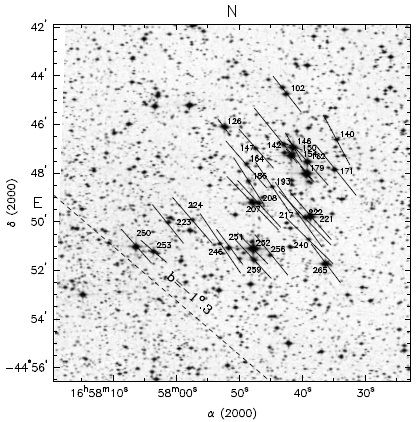
Fig. 1 Projection on the sky of the polarization vectors (Johnson V filter) of the stars observed in the region of NGC 6249. The dot-dashed line is the Galactic parallel b = -1°.3. The length of each vector is proportional to the polarization percentage. The background image of the cluster is a DSS image from the Space Telescope Institute.
Table 1 Polarimetric observations.
| Stara | Other | Filter | Pλ ± ϵP | θλ ± ϵθ | Stara | Other | Filter | Pλ ± ϵP | θλ ± ϵθ |
|---|---|---|---|---|---|---|---|---|---|
| Id.b | % | ° | Id.b | % | 0 | ||||
| McS 102 | U | 1.40 ± .35 | 20.7 ± 7.3 | McS 208 | U | 2.57 ± .47 | 48.6 ± 2.9 | ||
| B | 1.74 ± .34 | 35.3 ± 2.4 | B | 2.61 ± .34 | 47.3 ± 3.4 | ||||
| V | 1.69 ± .33 | 38.2 ± 4.4 | V | 2.36 ± .36 | 42.7 ± 3.8 | ||||
| R | 1.36 ± .15 | 35.4 ± 3.8 | R | 2.56 ± .18 | 47.9 ± 1.8 | ||||
| I | 1.03 ± .27 | 43.7 ± 7.3 | I | 2.27 ± .21 | 47.6 ± 2.5 | ||||
| McS 126 | U | 0.98 ± .31 | 32.7 ± 9.0 | McS 217 | U | 2.99 ± .79 | 26.3 ± 8.6 | ||
| B | 0.64 ± .09 | 38.5 ± 4.0 | B | 3.71 ± .50 | 37.7 ± 5.3 | ||||
| V | 0.75 ± .08 | 36.8 ± 4.9 | V | 2.95 ± .22 | 35.9 ± 1.9 | ||||
| R | 0.64 ± .05 | 37.4 ± 3.5 | R | 2.08 ± .39 | 44.3 ± 2.0 | ||||
| I | 0.32 ± .09 | 45.0 ± 11.2 | I | 1.39 ± .47 | 45.0 ± .9 | ||||
| McS 140 | U | … | … | McS 221 | MV 7 | U | 4.21 ± .52 | 51.9 ± 3.5 | |
| B | 2.77 ± .37 | 32.8 ± 3.9 | HD 329215 | B | 3.08 ± .24 | 42.0 ± 2.2 | |||
| V | 2.08 ± .15 | 28.0 ± 0.7 | V | 2.30 ± .31 | 41.0 ± 3.8 | ||||
| R | 2.31 ± .15 | 28.7 ± 1.1 | R | 2.52 ± .23 | 41.2 ± 2.7 | ||||
| I | 2.01 ± .15 | 31.3 ± 2.2 | I | 2.26 ± .37 | 40.1 ± 4.6 | ||||
| McS 142 | MV 10 | U | 2.32 ± .75 | 37.6 ± 8.9 | McS 222 | U | … | … | |
| B | 1.76 ± .48 | 30.3 ±10.5 | B | … | … | ||||
| V | 3.53 ± .35 | 39.1 ± 7.4 | V | 2.76 ± .31 | 44.2 ± 0.8 | ||||
| R | 3.18 ± .43 | 38.9 ± 6.3 | R | 2.52 ± .30 | 42.9 ± 2.6 | ||||
| I | 1.50 ± .44 | 39.7 ±16.0 | I | 1.73 ± .38 | 52.2 ± 6.2 | ||||
| McS 146 | MV 3 | U | 1.29 ± .14 | 34.4 ± 2.0 | McS 223 | U | … | … | |
| HD 329217 | B | 1.50 ± .14 | 31.9 ± 0.3 | B | 1.73 ± .46 | 42.0 ± 4.3 | |||
| V | 1.21 ± .09 | 29.8 ± 0.6 | V | 1.83 ± 12 | 38.8 ± 1.7 | ||||
| R | 1.10 ± .11 | 30.5 ± 0.7 | R | 1.90 ± .11 | 40.4 ± 1.9 | ||||
| I | 0.95 ± .08 | 25.9 ± 3.9 | I | 1.14 ± .14 | 44.0 ± 3.6 | ||||
| McS 147 | MV 11 | U | 1.85 ± .14 | 28.6 ± 2.2 | McS 224 | U | … | … | |
| B | 2.25 ± .33 | 40.0 ± 1.5 | B | … | … | ||||
| V | 1.93 ± .18 | 41.6 ± 0.6 | V | 2.25 ± .29 | 40.8 ± 2.6 | ||||
| R | 2.42 ± .18 | 39.9 ± 1.9 | R | 2.29 ±.30 | 41.1 ± 3.0 | ||||
| I | 2.27 ± .29 | 37.2 ± 3.6 | I | 2.87 ± .57 | 37.7 ± 2.8 | ||||
| McS 150 | MV 9 | U | 1.68 ± .43 | 43.2 ± 7.2 | McS 240 | U | … | … | |
| B | 1.46 ± .32 | 32.0 ± 6.3 | B | 3.65 ± .46 | 48.9 ± 2.8 | ||||
| V | 1.05 ± .18 | 26.3 ± 5.0 | V | 2.44 ± .27 | 45.8 ± 1.9 | ||||
| R | 1.20 ± .20 | 34.0 ± 4.6 | R | 2.65 ± .32 | 41.7 ± 1.8 | ||||
| I | 1.49 ± .30 | 20.2 ± 8.9 | I | 2.83 ± .52 | 43.0 ± 6.9 | ||||
| McS 154 | MV 4 | U | 0.51 ± .14 | 49.3 ± 7.7 | McS 246 | U | … | … | |
| DM-44.11305 | B | 0.72 ± .03 | 40.9 ± 1.2 | B | 3.17 ± .45 | 34.0 ± 4.3 | |||
| V | 0.64 ± .02 | 37.8 ± 0.9 | V | 2.67 ± .27 | 34.3 ± 2.0 | ||||
| R | 0.61 ± .01 | 38.7 ± 0.7 | R | 2.69 ± .27 | 36.2 ± 2.3 | ||||
| I | 0.55 ± .02 | 36.5 ± 1.0 | I | 1.91 ± .43 | 11.6 ± 6.3 | ||||
| McS 162 | MV 5 | U | 2.49 ± .18 | 37.2 ± 2.3 | McS 250 | HD 329212 | U | 1.53 ± .23 | 38.7 ± 2.7 |
| B | 2.19 ± .20 | 41.5 ± 1.0 | B | 1.76 ± .16 | 44.7 ± 0.9 | ||||
| V | 2.27 ± .12 | 41.6 ± 0.9 | V | 1.68 ± .11 | 41.6 ± 1.2 | ||||
| R | 2.06 ± .14 | 37.8 ± 1.2 | R | 1.73 ± .12 | 43.8 ± 0.7 | ||||
| I | 1.83 ± .18 | 38.9 ± 2.0 | I | 1.57 ± .13 | 40.3 ± 2.4 | ||||
| McS 164 | MV 12 | U | ... | ... | McS 251 | U | 2.00 ± .29 | 24.0 ± 8.2 | |
| B | ... | ... | B | 1.81 ± .23 | 37.1 ± 2.2 | ||||
| V | 2.30 ± .29 | 41.0 ± 3.6 | V | 1.62 ± .20 | 37.0 ± 1.3 | ||||
| R | 2.79 ± .26 | 40.9 ± 2.7 | R | 1.86 ± .13 | 39.4 ± 2.0 | ||||
| I | 2.46 ± .79 | 40.3 ± 8.9 | I | 1.57 ± .23 | 36.2 ± 1.3 | ||||
| McS 171 | MV 6 | U | 2.38 ± .34 | 40.1 ± 2.4 | McS 252 | MV 1 | U | 2.25 ± .48 | 35.4 ± 6.0 |
| B | 2.19 ± .24 | 36.2 ± 1.5 | HD 329213 | B | 2.38 ± .37 | 39.3 ± 6.4 | |||
| V | 2.4 ± .14 | 38.9 ± 1.0 | V | 1.61 ± .13 | 44.4 ± 2.2 | ||||
| R | 2.33 ± .21 | 38.6 ± 1.2 | R | 1.57 ± .12 | 41.9 ± 2.2 | ||||
| I | 1.85 ± .31 | 35.6 ± 2.7 | I | 2.20 ± .22 | 48.8 ± 2.8 | ||||
| McS 179 | MV 2 | U | 0.97 ± .16 | 33.9 ± 4.6 | McS 253 | U | 1.39 ± .32 | 53.0 ± 6.5 | |
| HD 329216 | B | 0.93 ± .04 | 37.5 ± 1.3 | B | 1.12 ± .21 | 53.4 ± 2.9 | |||
| V | 0.71 ± .02 | 38.7 ± 1.0 | V | 1.25 ± .16 | 49.3 ± 5.1 | ||||
| R | 0.65 ± .02 | 34.1 ± 0.7 | R | 1.17 ± .15 | 49.1 ± 3.5 | ||||
| I | 0.56 ± .02 | 34.9 ± 1.1 | I | 1.44 ± .27 | 50.7 ± 5.2 | ||||
| McS 186 | MV 14 | U | 1.66 ± .28 | 34.4 ± 4.9 | McS 256 | U | ... | ... | |
| B | 2.61 ± .37 | 32.6 ± 2.9 | B | 1.64 ± .44 | 39.4 ± 5.4 | ||||
| V | 2.10 ± .21 | 32.9 ± 2.9 | V | 1.93 ± .24 | 39.2 ± 3.6 | ||||
| R | 2.43 ± .26 | 38.6 ± 2.7 | R | 1.69 ± .23 | 41.0 ± 1.0 | ||||
| I | 2.80 ± 33 | 31.7 ± 2.3 | I | 1.58 ± .35 | 37.9 ± 6.2 | ||||
| McS 193 | MV 15 | U | 2.90 ± .24 | 43.5 ± 8.2 | McS 259 | U | 2.21 ± .33 | 36.9 ± 6.4 | |
| B | 2.57 ± .20 | 34.1 ± 2.2 | B | 2.06 ± .25 | 42.6 ± 3.5 | ||||
| V | 2.25 ± .14 | 34.3 ± 1.3 | V | 1.95 ± .15 | 42.9 ± 1.2 | ||||
| R | 2.38 ± .08 | 36.8 ± 0.9 | R | 1.99 ± .15 | 45.0 ± 1.0 | ||||
| I | 1.68 ± .10 | 41.2 ± 1.8 | I | 1.86 ± .24 | 45.0 ± 3.7 | ||||
| McS 207 | MV 8 | U | 3.37 ± .24 | 43.1 ± 2.1 | McS 265 | HD 329214 | U | 2.05 ± .35 | 19.5 ± 3.0 |
| DM-44.11306 | B | 3.09 ± .15 | 44.3 ± 1.4 | B | 2.12 ± .19 | 30.7 ± 2.4 | |||
| V | 2.75 ± .24 | 44.0 ± 2.5 | V | 1.79 ± .19 | 37.2 ± 3.1 | ||||
| R | 2.72 ± .21 | 35.0 ± 2.2 | R | 1.85 ± .15 | 35.5 ± 1.8 | ||||
| I | 2.28 ± .32 | 34.1 ± 4.0 | I | 1.32 ± .30 | 39.9 ± 5.7 |
aidentification from McSwain & Gies (2005b).
bidentifications from Moffat & Vogt (1973), HD or DM.
Figure 2 shows the relationship between PV and 9y for the 30 stars. We found a scatter in the angles between 26°.3 and 49°.3, probably due to the existence of dust along the line of sight to NGC 6249 or to the presence of intracluster dust. In this figure, the stars in the most compact concentration have polarimetric orientations in the range of 37°-46°, and their polarizations values range from 1.68 % to 2.4 %. Surely, the majority of these stars are members of the cluster.

Fig. 2 V-band polarization percentage of the stellar flux PV (%) vs. the polarization angle θV for each star.
Figure 3 shows the distribution of the polarization angle in the V filter (PV and θV) for the sample of stars; the solid line in the figure indicates the angle of inclination of the GP. If we fit a Gaussian distribution to the probable members (dark bars), we obtain a distribution with a mean of 39°.7 and a full width at half maximum (FWHM) of 5°.7. This last value coincides with the width found by us in previous polarimetric studies of open clusters (less than 10°).
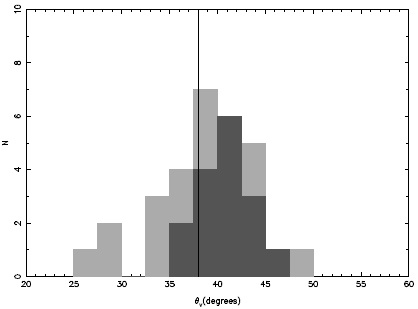
Fig. 3 The distribution of the polarization angle in the V filter (θV) for the sample of stars; the solid line indicates the angle of inclination of the GP. The dark bars represent the distribution of probable members, while light bars represent the distribution of the total sample.
The angle distribution of the member is similar to that of the total sample (grey bars). All stars with angles smaller than 35° are identified as non-members.
4. Analysis and discussion
4.1. Fitting to Serkowski's Law
Intrinsic stellar polarization components may be distinguished from interstellar component by time variability, by a wavelength dependence unlike that of interstellar polarization, and/or by a strong rotation of the polarization position angle with respect to the wavelength. Two important polarizing mechanisms may cause linear intrinsic polarization: Thomson scattering in a flattened plasma disk around Ae/Be stars (Serkowski 1968, Coyne & Kruszewski 1969, etc.), and light scattering by large size grains located in non-spherically distributed dust clouds, as in the light from red giants, red and yellow variables, and other objects (Coyne & Vrba 1976, Bergeat et al. 1976, etc.). Sometimes both mechanisms act on the light of a single star (e.g. Capps, Coyne & Dick 1973; HD 44179) or on the light of binary stars, especially close binaries, which contain mass transfer streams, hot spots where the streams falls into the accretion disk, the disk around the gainer star, and an asymmetric donor star. Each of these components implies an asymmetry that contributes to the net polarization (Bjorkman 2011).
Elongated dust grains in the interstellar medium aligned by the galactic magnetic field can give the polarization vectors a preferred orientation. Serkowski (1973) noted that observations of interstellar polarization follow the same curve for all stars, which can be approximated by an empirical formula. To analyze the data, we fitted the observations in the five filters for each star in our sample using Serkowski's law of interstellar polarization defined by
If the polarization was produced by aligned interstellar dust particles, we assumed that the observed data (in terms of wavelength in the UBVRI bands) would follow equation (1) and that each star would have a Pλmax and a λmax value. To perform the fitting, we adopted K = l.66 λmax + 0.01 (Whittet et al. 1992), with λmax in μm. The individual Pλmax, λmax values, together with the star identification from McSwain & Gies (2005b), are listed in Table 2.
Table 2 Polarization results.
| Stara | Pmax ± ϵp | σ1 b | Intr. Pol. | λmax ± ϵλ | Memb. | Stara | Pmax ± ϵp | σ1b | Intr. Pol. | λmax ± ϵλ | Memb. |
|---|---|---|---|---|---|---|---|---|---|---|---|
| % | Criteria | % | Criteria | ||||||||
| McS 102 | 1.63±0.10 | 0.45 | 0.43±0.03 | m | McS 208 | 2.69±0.09 | 0.61 | 0.53±0.03 | m | ||
| McS 126 | 0.80±0.22 | 1.56 | λmax | 0.37±0.09 | nm | McS 217 | 4.05±0.51 | 0.73 | λmax | 0.28±0.02 | nm |
| McS 140 | 2.27±0.15 | 1.09 | 0.58±0.09 | nm | McS 221 | 3.08±0.38 | 1.81 | σ1 | 0.41±0.07 | m | |
| McS 142 | 2.53±0.37 | 1.13 | 0.56±0.17 | nm | McS 222 | 3.11±0.64 | 0.83 | 0.41±0.08 | nm | ||
| McS 146 | 1.33±0.06 | 0.89 | 0.44±0.03 | nm | McS 223 | 2.05±0.51 | 2.17 | σ1 | 0.41±0.12 | nm | |
| McS 147 | 2.31±0.14 | 1.26 | 0.61±0.05 | m | McS 224 | 2.48±0.29 | 0.92 | 0.77±0.19 | m | ||
| McS 150 | 1.29±0.16 | 1.38 | 0.56±0.16 | nm | McS 240 | 2.82±0.34 | 1.85 | σ1 | 0.54±0.17 | m | |
| McS 154 | 0.67±0.03 | 1.54 | 0.48±0.03 | nm | McS 246 | 2.94±0.29 | 0.88 | 0.45±0.07 | nm | ||
| McS 162 | 2.39±0.09 | 1.02 | 0.46±0.03 | m | McS 250 | 1.77±0.03 | 0.57 | 0.56±0.03 | m | ||
| McS 164 | 2.81±0.24 | 0.53 | 0.83±0.12 | m | McS 251 | 1.90±0.12 | 1.11 | 0.52±0.06 | m | ||
| McS 171 | 2.40±0.07 | 0.66 | 0.59±0.04 | m | McS 252 | 1.77±0.19 | 2.42 | σ1 | 0.59±0.17 | m | |
| McS 179 | 0.80±0.07 | 2.40 | σ1 | 0.41±0.04 | nm | McS 253 | 1.29±0.09 | 0.97 | 0.57±0.09 | nm | |
| McS 186 | 2.52±0.23 | 1.24 | 0.71±0.09 | nm | McS 256 | 1.84±0.07 | 0.37 | 0.54±0.05 | m | ||
| McS 193 | 2.76±0.27 | 1.71 | σ1 | 0.39±0.04 | nm | McS 259 | 2.10±0.09 | 0.91 | 0.52±0.05 | m | |
| McS 207 | 3.17±0.13 | 1.14 | 0.43±0.03 | nm | McS 265 | 2.05±0.13 | 0.86 | 0.44±0.05 | m |
aidentifications from McSwain & Gies (2005b).
bσ1 2 = Σ (rλ/ϵpλ)2 /(m - 2); where m is the number of colors and rλ = Pλ - Pmax exp(-K ln2(λmax /λ)).
To detect stars with evidence of intrinsic polarization in at least part of their light, we computed the σ1 parameter (the unit weight error of the fit) in order to quantify the departure of our data from the "theoretical curve" of Serkowski's law. In our scheme, when a star has σ1 > 1.70, it indicates the presence of a component of non-interstellar origin in the measured polarization. A second criterion that can be used to test the origin of polarization is the λmax values: stars with a value lower than the average corresponding to the interstellar medium (0.55 μm; Serkowski et al. 1975) are candidates to have an intrinsic component of polarization (Orsatti et al. 1998).
Six stars of the sample show evidence of intrinsic polarization according to the σ1 value: #179, #193, #221, #223, #240, and #252. The second criterion yielded another two stars: #126 and #217, whose λmax values (0.37 μm and 0.28 μm, respectively) are very low compared to the average value for the interstellar medium. Stars #193, #221 and #223 also have suspicious λmax values (0.39 μm, 0.41 μm and 0.41μm, respectively). Column 5 in Table 2 lists the criteria used to detect stars with evidence of intrinsic polarization.
As we just mentioned, if the polarization is dominated by dust particles in the interstellar medium, the value of λmax should be nearly equal to 0.55 μm. As can be seen in Column 6, this parameter, calculated for each star in the sample, took a wide range of values between 0.28 ± 0.02 and 0.83 ± 0.12, indicating that stars are being polarized by dust clouds in which the dust grains have different orientations.
Figure 4 shows the dependence of polarization and position angle on wavelength for some of these stars, five of which have evidence of intrinsic polarization according to the values of their parameters. The PV and θV as a function of λ of Star #207 shows a suspcious behavior and is also included in the figure. For comparison purposes, the best fit to Serkowski's law of the interstellar polarization was plotted as a continuous line in the plots of PV vs λ. The θV vs λ plots show significant rotations in the polarization position angle of all these stars; however, only two stars are mentioned in the literature (stars #179 and #252) as having peculiar features. Star #179 has a spectral type G8 III (FitzGerald et al. 1979); it is a non-member, and is listed as a spectroscopic binary (Mermilliod el al. 2007). The intrinsic component of its polarization might be influenced by its evolutionary state, by its binary condition, or by both characteristics together. Star #152 is not included in this figure. The PV vs. λ plot of star #207 (MV8; non-member) shows high polarization in the U and B filters, a peculiar feature, as well as variations in the polarization angle. A similar behavior was found in stars #193 and #217.

4.2. Stokes Plane and Memberships
The studies by Moffat & Vogt (1973) and Mc-Swain & Giess (2005b) in the region of NGC 6249 did not focus on memberships. The first study determined some fundamental cluster parameters and the second one detected possible Be candidates. Membership assignment is not an easy task with this cluster because the V vs. b-y plot of McSwain & Giess (2005b) shows a great number of stars near the main sequence, evidence of the effects of an uneven distribution of dust and/or of evolutionary effects on dust in the region of the observed stars.
It is possible to use different tools to assign memberships in open clusters: photometry, a comparison between the radial velocities of giant stars in the region and the mean velocity of the clusters, or a combination of stellar proper motions (from the Hipparcos and Tycho catalogues) radial velocities and spatial distribution. In addition to these methods, we developed a polarimetric technique in previous studies (Orsatti et al. 2010, Vergne et al. 2010) that can help solve the membership problem or be a helpful complement of photometry; it involves the use of two important tools: the plot of the Stokes parameters QV vs. UV and the polarization efficiency plot, PV /EB-V . Furthermore, these two applications provided us with useful information about the evolution of the interstellar environments from the Sun to the cluster.
The Stokes parameters, QV = PV cos(2θV) and UV = PV sin(2θV), are components in the equatorial system of the polarization vector PV. The procedure to identify memberships is based on the assumption that member stars are located behind common dust clouds that polarize their light, while most non-members are not. Objects close to the Sun, or located along the line of sight to the cluster, are less polarized. If there are dust clouds between the Sun and the cluster, and their dust particles are oriented in different directions, the final angle is not the same as that of cluster stars. On the Stokes plane, the stars are located in different regions. The individual polarization of the stars located behind the cluster can be higher than that of cluster members if the dust has the same orientation, and the star profiles could be depolarized if the orientation is not the same. In both cases the location on the diagram (QV, UV) is not the same as that for member stars. The EB-V of stars with depolarized light is higher and can be detected in the efficiency diagram (PV vs. EB-V). This will be analyzed in the next subsection.
Following the previous considerations, we accept that any star in the non-member region is very probably a non-member and, likewise, any star located in the cluster region is very probably a member. We do not apply this criterion to stars with observed evidence of intrinsic polarization, since we can only assign them a dubious membership. This tool has been used by us in previous work to prove that polarimetry is as efficient as photometry for membership identifications (Orsatti et. al 2010).
The (QV, UV) plot is shown in Figure 5; the point defined by coordinates QV = 0 and UV = 0 indicates the dustless solar neighborhood, and any other point represents the direction of the polarization vector PV as seen from the Sun. The stars represented by open circles are non-members, those represented by full circles are members and the open and full triangles are non-members and members, respectively, with evidence of intrinsic polarization.
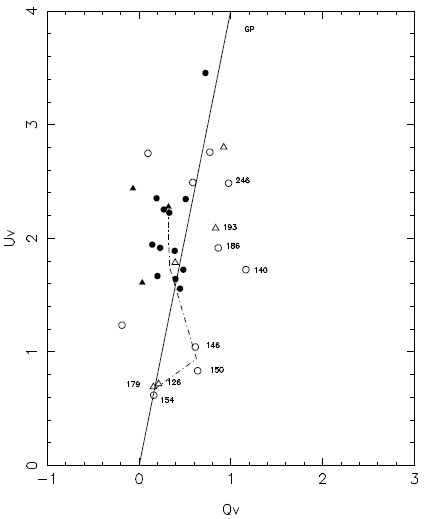
Fig. 5 Qv vs. Uv Stokes parameters for the V-bandpass. Filled and open circles represent members and non-members; filled and open triangles represent members and non-members with intrinsic polarization according to Table 2. The solid line represents the inclination of the GP. The dashed lines indicate the variation of the polarization through the dust layers between the cluster and the Sun.
The first and closest group is composed of stars #126, #179 (both of them with evidence of intrinsic polarization), and #154; this last star and star #179 are binaries. Due to their peculiar features, we were not able to determine the distance of this group of stars, but they are located near the Sun, show a low average polarization of 0.7 % and a mean plarization angle of about 37.8° respectively; this orientation is similar to that of the GP.
The next group has three stars: #146 (MV3). #150 (MV9) and #253, with very similar polarization percentages (1.05 %, 1.21 % and 1.25 %, respectively), but the orientation of #253 (49°) is very different from that of the other two stars (26.3° and 29.8°). Star #253 deserves particular attention: the departure of its polarization angle is probably the result of its location in the sky. This is confirmed by Figure 1, where stars #146 and #150 are located on the northwest edge of the cluster, while star #253 is on the southeast edge. We suggest that #253 is a background star, affected by the same dust cloud polarizing the cluster. Star #146 has been classified as AO (Cannon & Mayall 1949). Thus, accepting a luminosity class IV-V and using the color magnitude diagram of Moffat & Vogt, we found a distance of about 520 pc from the Sun.
Next, we identified a concentration of fourteen stars which we associated with possible members of NGC 6249 (Figure 5). An apparent subdivision of two subgroups can be seen above and below UV = 2.0; we analyzed if this separation implies the presence of two different stellar groups or if there is any other explanation. The subgroup of eight stars with U-values below 2 is composed of #102, #147, #250, #251, #252 (with intrinsic polarization), #256, #259 and #265. The mean polarization and orientation of the electric vector for the group are PV = 1.77 % ± 0.13 and 9V = 39.7° ± 2.2 (mean of 7 stars, excluding #252). The other subgroup, with U-values above 2, is composed of six stars: #162, #171, #208, #221, #224 and #240; their mean values are PV = 2.34% ± 0.07, and θV = 41°±1.2. We found that, even when the difference between θV values was not significant, the difference in mean polarization between both subgroups was important and amounted to about 0.57%. It is not possible to reach a conclusion by plotting the stars on a UBV plot because few stars have been measured on that system; however, Strömgren b, y and narrowband Hα photometry (McSwain & Gies 2005a) shows a main sequence with a notable width in the V vs. y-b diagram, which can confirm the presence of intracluster dust. Moreover a U-shaped dark zone can be observed in the central zone of the sky plane (Figure 1). The stars of the first subgroup are located in the upper and lower parts of this zone. The stars of the second subgroup are located in the edges of this dark region, together with probable background non-members: #164, #207, #217, #222 and #142; these stars are spread along a SE-NW stripe. Clearly, the second subgroup and the background stars are being affected by a dust cloud (dark U-structure) in front of, or inside, the cluster. We can conclude that both subgroups are part of the same cluster but are polarized by different dust clouds.
By comparing the individual PV and θV of the rest of the stars with the mean values of the subgroups, we found an additional probable member, star #164, with polarimetric parameters PV = 2.30% and θV = 41°. Its position on the V vs. (U - B) plot (Moffat & Vogt 1973) and on the V vs. (b-y) plot (McSwain & Gies, 2005b) corresponds to a non-member, but we will confirm its membership in the next subsection.
Stars #207 and #222 are non-member stars affected by the above mentioned dark cloud. The non-member star #246 is located on the SE edge, where the U-shaped dust layer has no influence on its polarization; the difference in polarization angle with respect to the previous two stars is explained by their position opposite to this cloud. Star # 142(MV10) is a cluster member according to its position in Moffat and Vogt photometric diagrams. Its polarization and its position angle versus wavelength do not show an abnormal behavior nor do they reveal a suspicious value of the σ1 parameter (Table 2), but its location on the Stokes plane could indicate that it is a background star (non-member).
Using the polarimetric plot QV vs UV and the calculated mean values, we were able to reconfirm six memberships of stars from the list of Moffat & Vogt (1973); these are: #162 (MV5), #171 (MV6), #221 (MV7), #142 (MV10), #147 (MV11), and #164 (MV12). Another seven stars were identified as non-members: #179 (MV2),#146 (MV3), #154 (MV4), #207 (MV8; the Be star detected by McSwain & Gies 2005b), #150 (MV9), #186 (MV14), and #193 (MV15). Furthermore, we found another nine members between the observed stars: #102,#208,#224,#240,#250,#251,#256,#259, and #265. Only a few members (3) have evidence of intrinsic polarization according to the parameters σ1 and λmax, but we can add one more #252 (MV1), defined as a member but with evidence of intrinsic polarization according to σ1. The final memberships are shown in Table 2 (last column).
4.3. Polarization Efficiency
The ratio PV / EB-V is known as the
polarization efficiency of the ISM; it depends mainly on the degree of alignment
of the dust grains, the strength of the magnetic field and its orientation along
the line of sight to the cluster. Assuming normal interstellar material
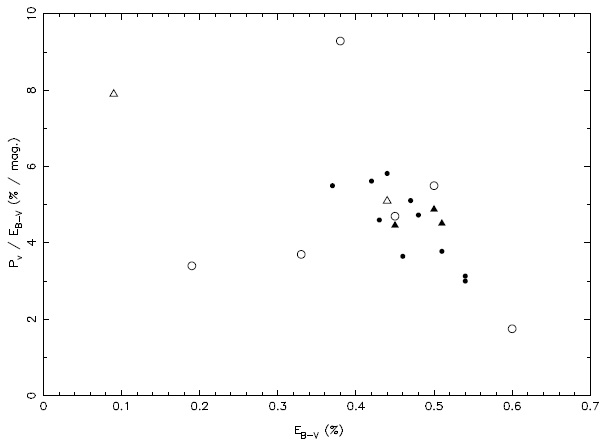
Figure 6 shows the relationshp that exists between the reddening and the visual polarization produced by the dust grains along the line of sight to NGC 6249. Only half of the observed stars have UBV photometry; their individual color excesses Eb-v were obtained either from the literature or by dereddening the colors and using the relationship between spectral type and color indexes (Schmidt-Kaler 1982). Some stars have only Stromgren photometry; in this case, we calculated individual color excesses Eb-v following the procedure applied by McSwain & Gies (2005b). This task was successfully accomplished for only seven stars (#102, #208, #240, #250, #251, #256 and #265) due to different errors on the application of the procedure; the rest of the stars, without Eb-v values (#126, #140, #217, #222, #223, #224, #246, #253 and #259), are shown along the vertical axis (PV).

Fig. 6 Plot of the polarization efficiency PV vs.
EB-V for stars in the direction
of NGC 6249. The solid line shows the empirical upper limit for the
polarization efficiency
The solid line shows the empirical upper limit relation for the polarization efficiency
It can be seen that, with the exception of star #142, all points are plotted to the right of the interstellar maximum efficiency line, indicating that their polarizations are mostly due to the ISM. The position of the probable members of NGC 6249 can be deduced from their color excesses in the range of 0.35 to 0.55 mag, and from their polarization values PV between 1.65% and 2.75%. The stars represented along the PV axis have polarization values in these ranges but their color excess could not be calculated; others (#126, #146, #150, #154, #179 and 2#53) are clearly non-members. In the case of star #150, its color excess value does not agree with its polarization. This value indicates that it is a non-member star with an overestimated color excess, suggesting it is a late-type star. This is indicated in Figure 6 by an arrow that points toward smaller color excess values. Regarding star #142, we mentioned in the previous subsection that it does not have any indications of intrinsic polarization, although its position deviates slightly to the left of the empirical upper limit, and that the color excess does not agree with its high polarization value; therefore, we think that it could be a background star. To calculate the mean polarization efficiency PV / Eb-v of NGC 6249, we selected a concentrated group of ten stars previously confirmed as members; the polarization efficiency was 4.44, which is close to the standard value for interstellar dust (of about 5). This value indicates that the dust polarizes the light from this cluster stars with normal efficency.
In Figure 7, we plot PV / EB-V vs EB-V for the stars with excesses EB-V. A trend can be observed of decreasing polarization efficiency with increasing EB-V. This behavior may be due to a small change in the polarization angles, which produces a slight depolarization.
4.4. Dust Distribution and Polarimetrie Similarity in NGC 6249 and NGC 6250
NGC 6249 was included by Koskov & Orlov (2011) in a study on double open clusters, that aimed to detect a dynamical connection between this cluster and another one located in close vicinity: NGC 6250. Even though they could not find any evidence of interaction, we think it is interesting to compare the polarimetric properties of both clusters due to their proximity in the sky and the similarities in their photometric characteristics (distance, age, spectral type, etc). However, note that previous polarimetric studies carried out by us did not show polarimetric similarities between clusters similar to NGC 6249 and NGC 6250.
According to MacSwain & Gies (2005b) NGC 6249 and NGC 6250 are at 1.03 kpc and 0.87 kpc from the Sun, and their ages are 2.4 x 10⁷ and 1.4 x 10⁷ years, respectively.
NGC 6250 was studied with polarimetric techniques by Feinstein et al. (2008), who observed 32 of the brightest stars in the region. Their data showed a mean polarization of 1.83%, close to the polarization value produced by the ISM with normal efficiency for a color excess of 0.37 mag; at least three dust components along the line of sight to the cluster were identified by polarimetry. Only a small part of the observed stars (6) showed some evidence that their polarization was influenced by an intrinsic component.
From the comparison of both clusters, we found that the largest difference between them is the orientation of the polarization vectors. In the case of NGC 6250, the range is 4°-25°; for NGC 6249, it is 37°-46°. The reason for this difference is that the dust distribution is more inhomogeneous in NGC 6250. The mean polarimetric efficiency of both clusters is similar, 4.95 (NGC 6250) and 4.4 (NGC 6249), close to that of the ISM (5.0). The optical properties of the dust grains that polarize the light of the stars in both regions show similarities, with λmax of 0.59 μm and 0.57 μm for NGC 6250 and NGC 6249, respectively.
The degree of polarization of a star is not a continuous function of distance due to the presence of dust layers located between the observer and the star. A sudden jump in the variation of the polarization is observed when the stellar light encounters a dust layer, and the number of jumps is associated with the number of dust components in the path to the stars and with the orientation of the magnetic field.
To study the distribution of the dust in the direction of these clusters, we increased the size of the sample by including the observations of NGC 6250 from Neckel & Klare (1980).
Figures 8a and 8b show the trend of the absorption (Av) with increasing distance in the area of NGC 6249 and of NGC 6250. We only considered stars from both clusters whose distances were derived by us from magnitudes and colors (Schmidt-Kaler, 1982). Full circles indicate the observations of NGC 6249 (a) and NGC 6250 (b); open circles indicate the observations from Neckel & Klare (1980). Both figures show the presence of at least two absorption sheets. The first is located between 250 pc and 300 pc, and the second at about 600 pc. In the first jump, an increase in absorption of 0.5 mag was estimated in the direction of both clusters after observing Figures 8a and 8b. In the second jump, the absorption increased to 1.4 mag for NGC 6249 and to approximately 1.0 mag for NGC 6250. The range in absorption in the last jump was greater for NGC 6249. According to this observation, we can confirm that NGC 6249 is farther from the Sun than NGC 6250. Clearly, both clusters show a similar variation of the optical absorption and the same variation of interstellar extinction as found by Neckel & Klare (1980, see Figure 6j, 209). We did not have enough stars beyond 1.5 kpc, but by observing Figure 8 we may predict a considerable increase in the extinction.

Fig. 8 Plot of Av vs. distance (pc) in the area of NGC 6249 (a) and of NGC 6250 (b). Full circles represent the observations of NGC 6249 (a) and of NGC 6250 (b); open circles indicate the observations from Neckel & Klare (1980). Both figures show the variation of the interstellar absorption from the Sun to the clusters with a full line.
5. Conclusions
We obtained the linear polarization in the UBVRI bands for a sample of 30 stars around the open cluster NGC 6249. The analysis of these data indicates that six stars show evidence of an intrinsic polarization component in their light but only three of them are cluster members. The mean polarization efficiency, PV / EB-V amounts to 4.4, which is normal when compared to the corresponding value for the ISM (Serkowski et al. 1975) of about 5. Among the member stars of NGC 6249, we noted two subgroups with average polarization and orientation of the electric vector of PV = 1.77% ± 0.13, θV = 39.7° ± 2.2; and Pv = 2.34% ± 0.07, θV = 41.0° ± 1.2, respectively. This difference in polarization can be the consequence of the presence of an U-shaped dark absorbing zone that can be seen in the central region and is located in front or inside the cluster. The FWHM in the distribution of the polarization angles of the members is 5.7°, in agreement with the width found for other open clusters previously studied by us. The polarimetric comparison between NGC 6249 and NGC 6250 showed some coincidences in the number of stars with intrinsic polarization and those with average polarimetric efficiency. However, this is not the case for the mean orientation of the polarization vectors.
We were able to identify at least two absorption sheets in the direction of the cluster. The first is located between 250 pc and 300 pc from the Sun and the second is at about 600 pc. We also predicted a considerable increase in the absorption from a distance of 1.5 kpc. The orientation of the magnetic field in these dust layers is rather similar to that of the GP (38°). Our polarimetric results agree with the distribution of interstellar extinction given by Neckel & Klare (1980).

