


 nueva página del texto (beta)
 Inglés (pdf)
 Artículo en XML
 Referencias del artículo
 Enviar artículo por email
 Citado por SciELO
  Similares en
SciELO
Similares en
SciELO 
 Permalink
1. Introduction
Titanium dioxide (TiO2) has been investigated with a special interest in recent decades because it is considered the most promising material among semiconductors used in photocatalysis, due to its high photocatalytic performance, low cost, controllable structure and morphology, chemical stability, and its non-toxicity [1-3]. However, it has two main limitations: its high bandgap that is approximately 3.05 eV, and 3.20 eV for the rutile and anatase phases, respectively. As a consequence of this relatively high bandgap, the titania can only absorb the UV light from the solar spectrum, which carries only about 4% of the incident solar energy, which considerably limits its overall photocatalytic efficiency [4] and also, the high speed of recombination of electron-hole pairs. Due to these deficiencies, many studies have been dedicated to the construction of composite materials with TiO2, particularly with graphene. It is considered an excellent base material for conversion applications and energy storage since it has very favorable properties for this type of application, such as good electrical conductivity, flexible and ultra-thin nature, chemical stability, and a high theoretical surface area of 2,600 m2/g [5-7] Consequently, it is an ideal candidate for the development of graphene-metal oxide composite nanomaterials for energy-related applications. When titania is combined with graphene, there is the possibility of improving absorption in the visible region, as has been confirmed in theoretical studies [8]. Therefore, multiple efforts have been made to obtain anatase-graphene nanocomposites with applications in photocatalysis. A strategy to grow graphene on a TiO2 (anatase) nanosheet via an ambient pressure chemical vapor deposition method using acetylene as a precursor was developed [9]. Sandwich structures of mesoporous anatase sheets and reduced graphene oxide have been obtained to be applied as electrodes in lithium-ion batteries [10]. These nanocomposites were easily synthesized from tetrabutyl titanate by acid-assisted hydrolysis and a subsequent thermal reduction process. TiO2 (anatase)/graphene nanocomposites were also synthesized by thermal plasma, dielectric barrier discharge, and heat treatment [11]. This method allowed to obtain well dispersed anatase nanoparticles below 50 nm and few-layer graphene nanosheets. Titania/graphene hybrids were synthesized by self-assembly and gas reduction in a hydrothermal system [12]. The method was based on electrostatic attraction between positively charged titanium glycolic acid and negatively charged graphene oxide in an aqueous medium. The ultrathin and flexible graphene layers were distributed around the surface of titania nanospheres, resulting in a new interface between titania and graphene.
In this work, the synthesis of an anatase-graphene nanocomposite is proposed, having as its main characteristic, the extremely small size of the TiO2 nanoparticles synthesized by the sol-gel method, the production of few-layer graphene by electrochemical exfoliation and the simplicity of the synthesis of the nanocomposite with ultrasonic mixing. A fixed 50/50 wt% graphene/TiO2 phase ratio was used in an attempt to understand how both phases interact. Due to the combination of the electrical properties of zerobandgap graphene and the photocatalytic properties of TiO2, this nanocomposite promises to have applications in photocatalysis.
2. Methodology
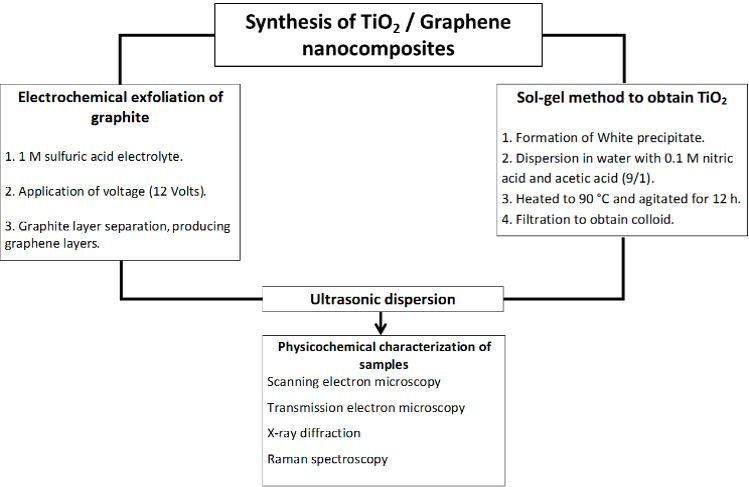
2.1. Synthesis of graphene/TiO2 nanocomposite
Graphene (G) was synthesized by the electrochemical graphite exfoliation method. First, a 1 M sulfuric acid solution was prepared to subsequently place the electrodes that constitute the electrochemical array in a beaker. A graphite bar was used as a working electrode and a copper wire as a counter electrode. The operating voltage used was 12 Volts.
The synthesis of titanium dioxide (anatase) was performed using the sol-gel method [13], and it is described below: To start, 20 ml of titanium butoxide was added to 200 ml of distilled water in a beaker, which generated a white precipitate that was separated from the liquid by decantation. Then, the precipitate was redispersed in distilled water containing a 0.1 M solution of nitric acid and glacial acetic acid in a 9/1 molar ratio (acetic acid/titanium butoxide). Subsequently, the graphene/TiO2 nanocomposite was generated from the above-mentioned precursors through mixing with a 50/50 wt % ratio inside a cylindrical vial. After mixing, sonication was performed for one hour to disperse the respective phases. Figure 1 shows the complete methodology followed to obtain and characterize the TiO2/graphene nanocomposite.
2.2. Sample characterization
The equipment used to identify the crystalline phases of the precursors was the X-ray diffraction system model D8 ADVANCE DAVINCI. The samples were analyzed with the conventional technique (Bragg-Brentano geometry). In general, the samples were run in a range of 2θ from 5◦ to 80◦, with a 0.2◦ increase in the reading angle, every 0.5 seconds. For the analysis of the morphology of the samples, several types of equipment were used: a JEOL brand Field Emission Scanning Electron Microscope (FESEM), model JSM 7600F in the secondary electron modes and topographic mode, a Transmission Electron Microscope (TEM), Tecnai Supertwin model with field emission. The instrument used to obtain the Raman spectrum of the graphene sample is a Bruker Optics Senterra Dispersive Microscope equipped with 532 nm, 785 nm and 633 nm laser. The configuration used was: 532 nm laser, 5 mW power, and 5 seconds of acquisition time. UV-vis spectroscopy was carried out on a Perkin Elmer (Lambda 25) spectrophotometer at wavelengths of 300-1100 nm to determine the bandgap energy of TiO2 nanoparticles.
3. Results and Discussion
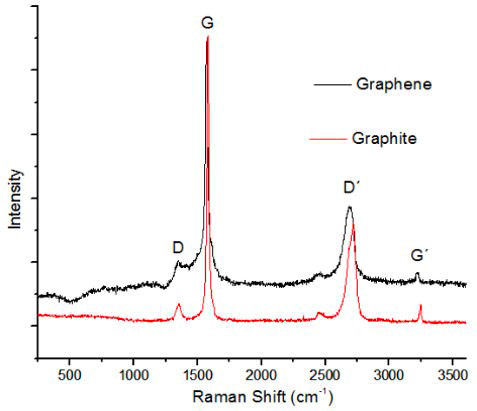
3.1. Raman spectroscopy to confirm the exfoliation of the graphite layers
The Raman spectrums of the exfoliated graphene sample and the graphite precursor are shown in Fig. 2. The peaks obtained in the graphene sample correspond to the characteristic bands of graphene: D (1344), G (1569) D’ (2689) G’ (3220). Band D indicates the presence of defects or edges in graphene samples [14], which could be observed by SEM and TEM. The intensity of the G peak is relatively high, compared to the intensity that occurs in monolayer graphene samples, which is much lower. A slight shift to the left of the D’ band after exfoliation can be observed. The D’ band of monolayer graphene does not have sub-peaks, unlike bilayer graphene that has 4 sub-peaks and few-layer graphene and graphite that both have 2 sub-peaks [15]. The band D’ in the graphene sample spectrum resembles that of graphene of a few layers, indicating the proper exfoliation of graphite layers.
3.2 Identification of crystalline phases present in the graphene/TiO2 nanocomposite
The graph in Fig. 3 shows a comparison of the diffractograms obtained from anatase, graphene, and the G/TiO2 nanocomposite. In the graphene precursor sample, the peak at 2θ = 26.4◦ (002) is characteristic of graphite [16,17], and it may also be attributed to graphene or reduced graphene oxide. In the latter case, the peak is much wider, resembling an amorphous signal [18,19].
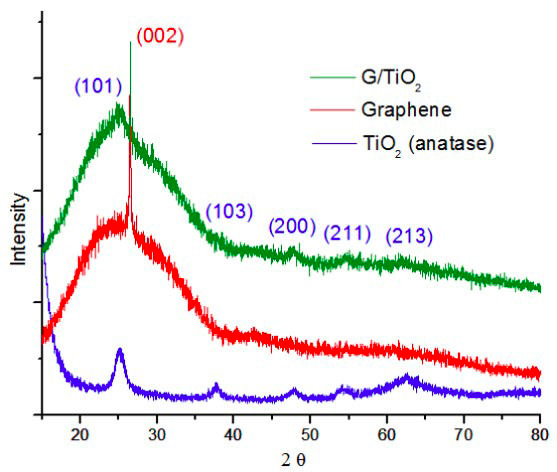
The most relevant peak in the TiO2 sample obtained with the sol-gel method appears at around 25.3◦, and it is characteristic of the crystalline phase of anatase [20]. Other peaks are also attributed to anatase and can be observed in the resulting diffractogram: 37.9◦ (103), 47.7◦ (200), 54.8◦ (211) and 62.5◦ (213). Both characteristic peaks of graphite and graphene, as well as the different TiO2 anatase peaks, are still present in the diffractogram of the anatase/graphene nanocomposite. Such nanocomposite corresponds to a mixture of anatase and graphene phases, and no chemical reaction has taken place that would have ended up in an additional phase. The average crystallite size of TiO2 nanoparticles was calculated to be around 6.14 nm by applying the Scherrer equation:
where K is a dimensionless constant with a value close to unity, λ is the X-ray wavelength, β is the full width at halfmaximum (FWHM) of the diffraction peak, and θ is the diffraction angle [21].
3.3. Morphology of the graphene/TiO2 nanocomposite
Figure 4 shows the images obtained with the SEM of the synthesized composite. With high amplification (Fig. 4a), a graphene base with some TiO2 particles deposited on the surface can be observed, and some titania particles are below the graphene layers. The observed morphology is similar to that reported in the literature and corresponds to the physical mixture between the graphene and titania phases [22,23]. The EDS analysis with elemental mapping mode allows to distinguish the areas where each element is located. In Fig. 4b, the carbon is colored in red and titanium in green, the resulting mixture of both elements and, consequently, of both colors is shown in yellow. It can be noted that the most present color in the sample is yellow (a mixture of titanium and carbon), followed by areas where only green (titanium) is seen, and finally, some red dots (carbon). Besides a measurement of the green (titanium) and red (carbon) zones areas was carried out and nanometric particles of titanium (42 nm) and carbon (31 nm) were measured.
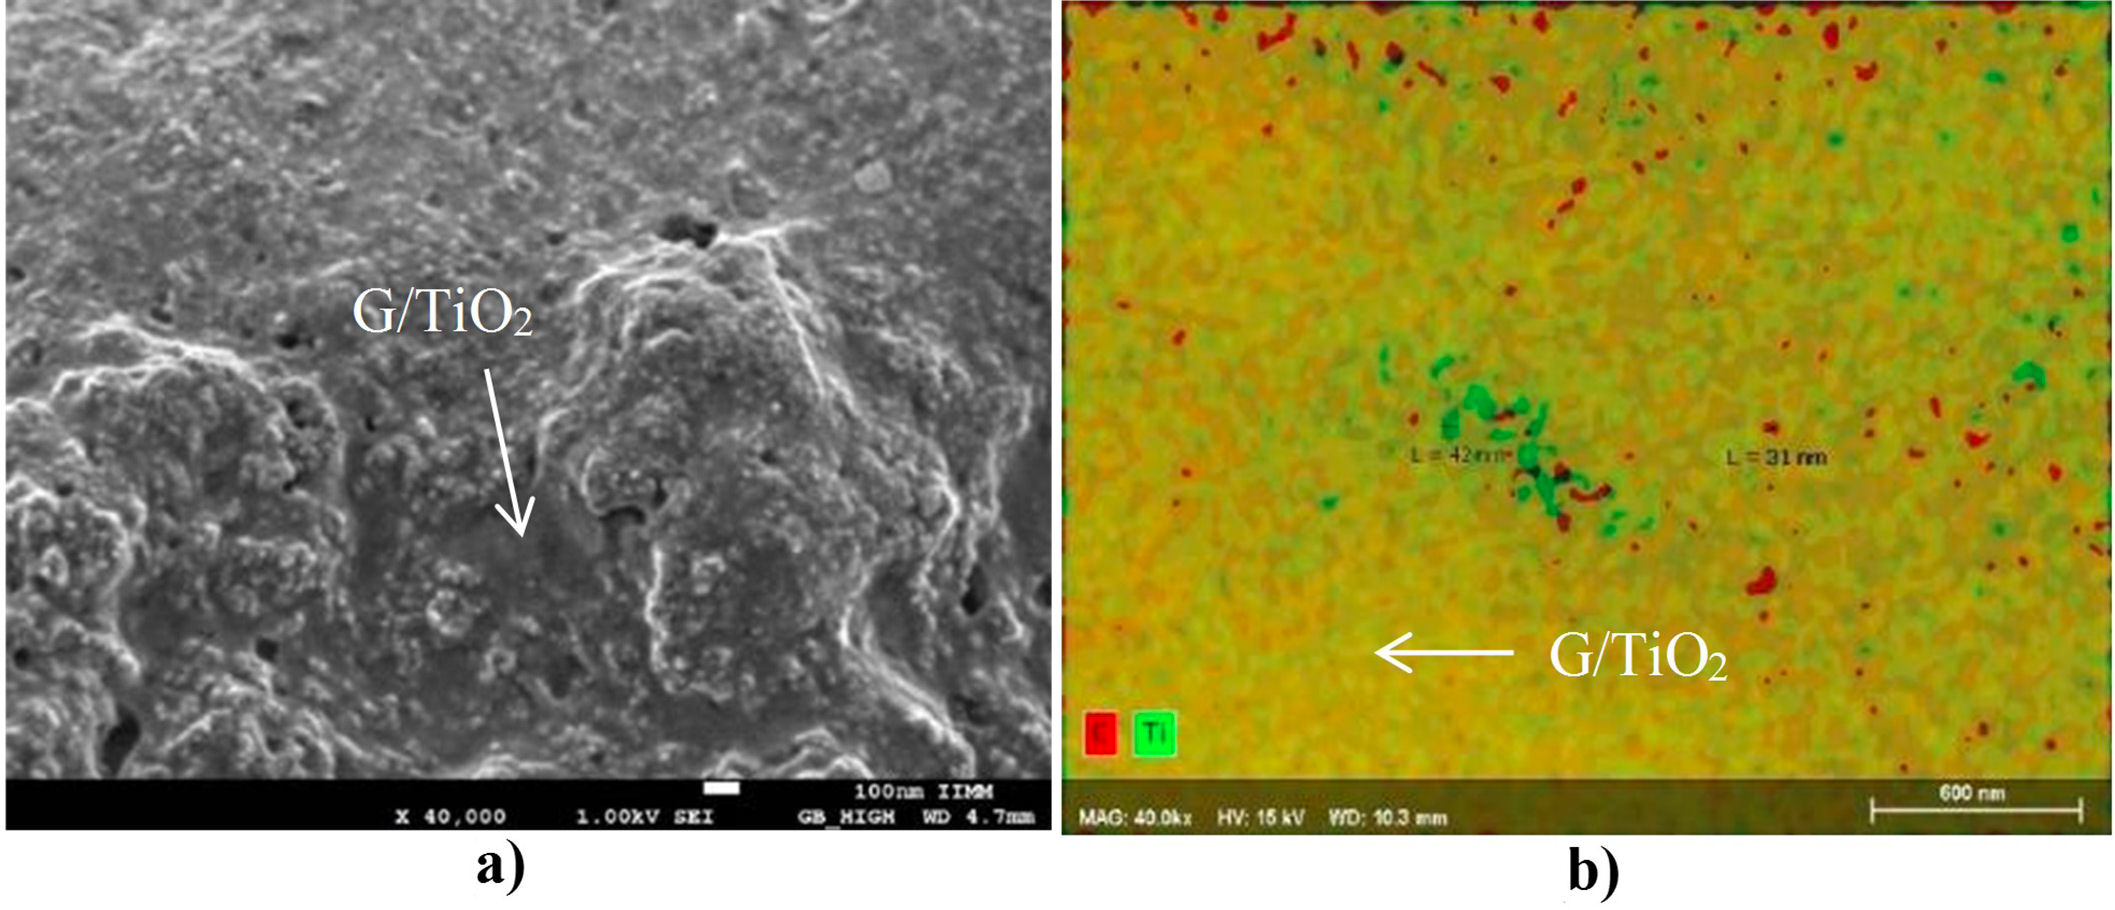
FIGURE 4 FESEM images showing (a) the obtained G/TiO2 nanocomposite at low magnification and (b) EDS maping of the same area showing the nano-scale dispersion and mixing of the TiO2 and graphene phases that constitute de nanocomposite.
The titania-graphene composite mixed by agitation and ultrasound was also analyzed with a Transmission Electron Microscope to observe the interaction between the crystalline phases of the precursors. In Fig. 5a an image is presented at very high amplification of the titaniagraphene composite, where different crystalline planes can be seen, as well as some amorphous areas. By performing a Fourier transform to this image, the pattern of dots and rings showed in Fig. 5b is obtained, from which the different crystalline planes of the sample are indexed. From the rings displayed in the image and determining the interplanar distance to later compare with the databases, the presence of the planes (101), (103), (200), and (211), which correspond to the TiO2 (anatase) precursor is confirmed. The TiO2 nanoparticles have an average length of 6 nm and an average width of 4 nm according to measurements. The graphene diffraction points highlighted in the Fourier transform of Fig. 5c corresponds to an interplanar distance of approximately 0.344 nm, which can be attributed to turbostrophic graphite according to the literature [24,25], that is to say, disordered graphite product of the electrochemical exfoliation process, which has an interplanar spacing greater than that of the ordered graphite (0.335 nm). This means than in the highlighted zone, few-layer graphene is present, alongside a TiO2 (anatase) nanoparticle with an interplanar spacing of 0.351 nm (101).
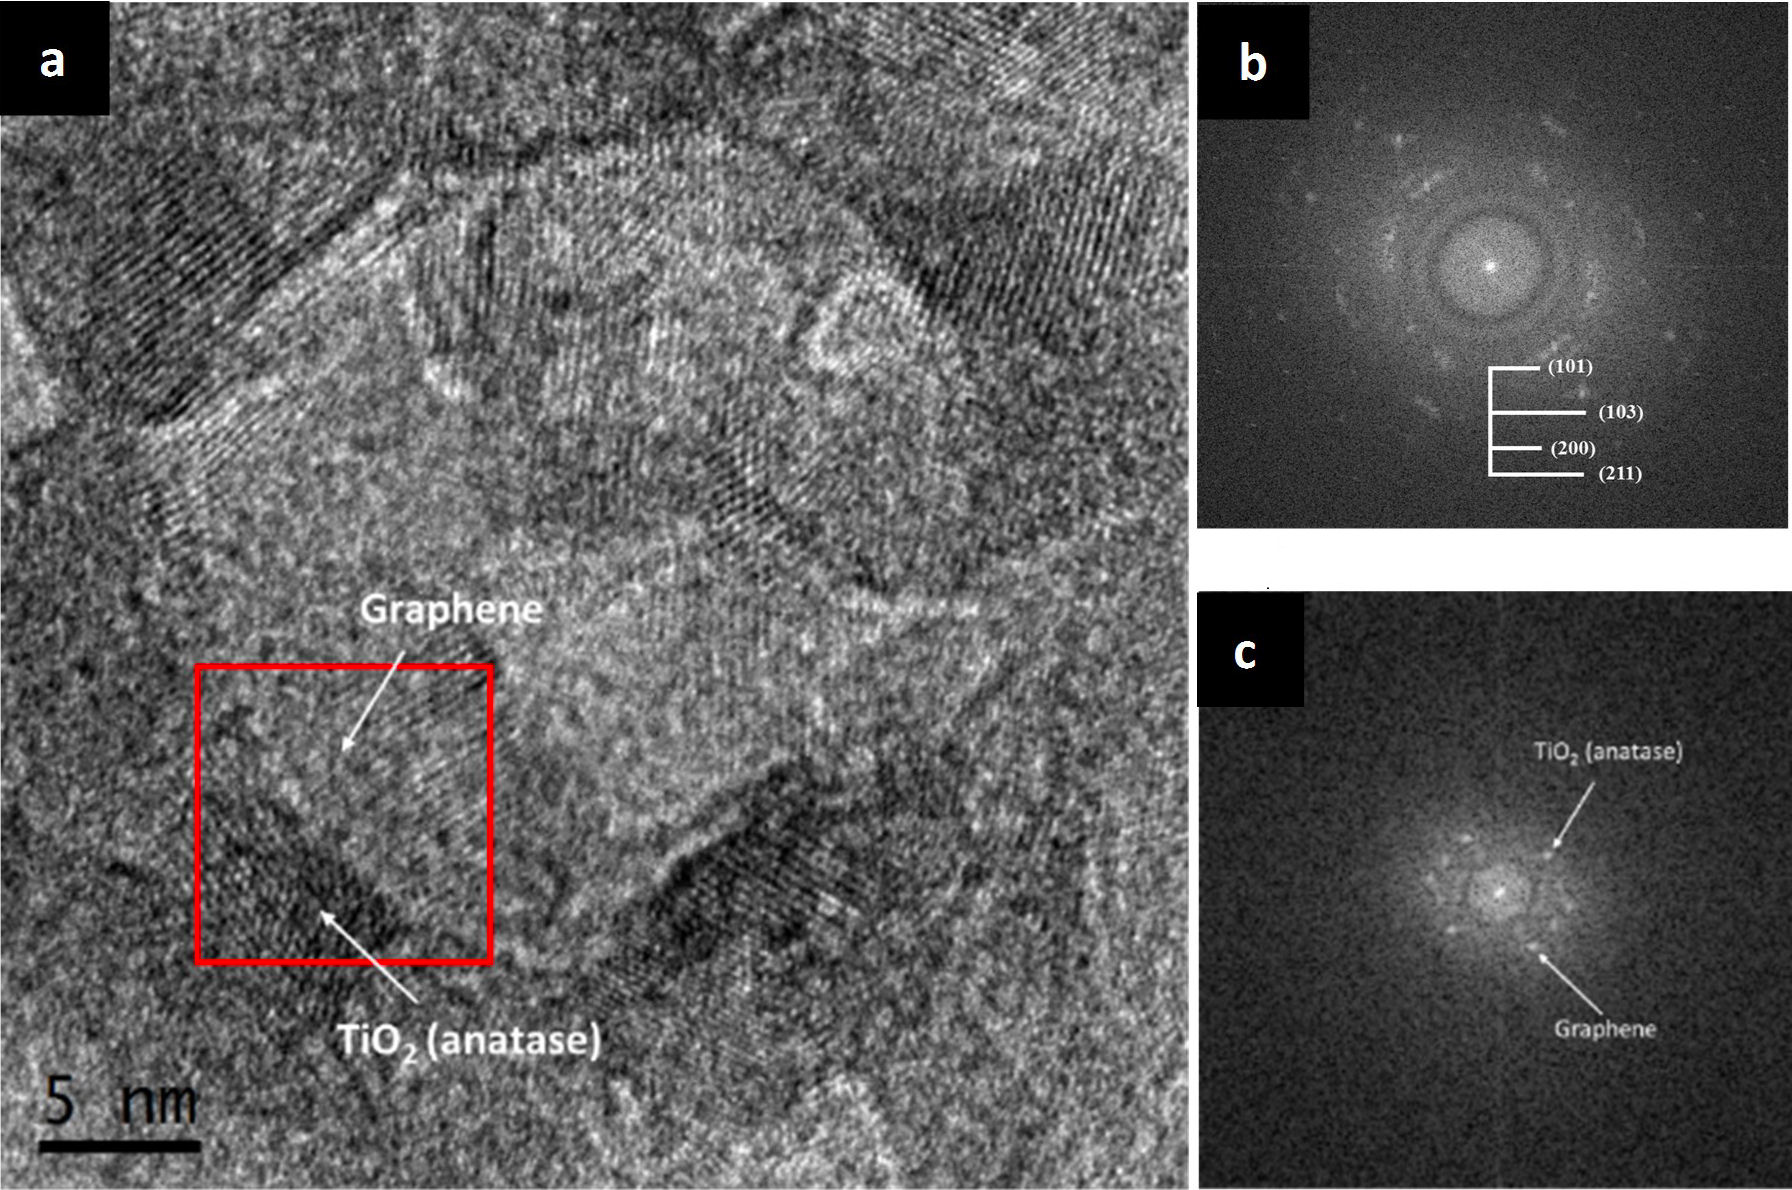
FIGURE 5 TEM images of the anatase and graphene composite mixed with ultrasound (a) general view of the nanocomposite at very high magnifications (b) ring pattern of the anatase crystalline planes, (c) point pattern corresponding to the graphene and TiO2 (anatase) phases.
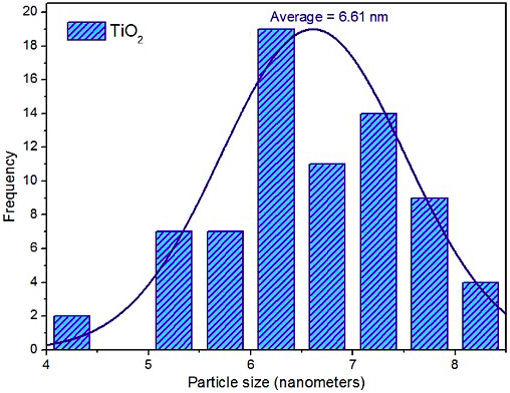
TiO2 nanoparticles were also measured from several TEM micrographs, and the average crystallite size was calculated to be 6.61 nm, as shown in Fig. 6, which is close to the value obtained from the Scherrer equation (6.14 nm). This extremely small TiO2 particle size, coupled with an enhanced transport of electrons on the highly conductive graphene phase, is expected to halt the recombination process of electrons and holes.
3.4. Bandgap energies of TiO2 and graphene/TiO2 nanocomposite
The bandgap energies of TiO2 nanoparticles and G/TiO2 nanocomposite were calculated using Tauc-relation [26,27], as shown in Fig. 7, where α is the absorption coefficient, and hν is the photon energy, which is calculated with Eq. (2). In this equation, λ is the wavelength in nanometers, h is the Planck’s constant (6.626 × 10⁻³⁴ Js), and c is the speed of light (3×10⁸ m/s).
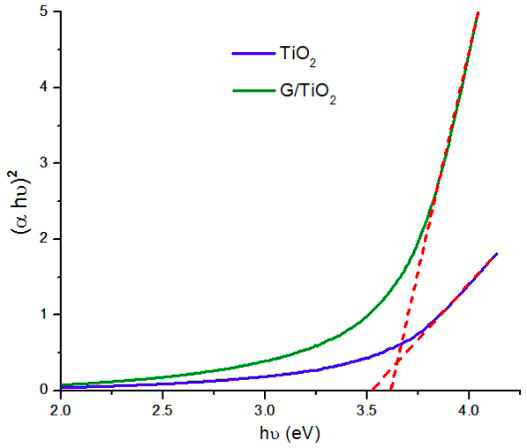
FIGURE 7 Bandgap energies of TiO2 nanoparticles and G/TiO2 nanocomposite calculated using Tauc-relation.
The value of hν extrapolated to α = 0 gives and absorbs energy, which corresponds to a bandgap. For the TiO2 nanoparticles, the bandgap was calculated to be 3.54 eV, which is higher than 3.2 eV for bulk TiO2 (anatase) [28]. This increase in the bandgap value occurs because the synthesized TiO2 nanoparticles have a relatively smaller size compared to bulk TiO2, and it is known that the decrease in particle size produces a larger bandgap [29]. The bandgap energy of G/TiO2 nanocomposite was calculated to be 3.6 eV, which is practically the same bandgap value of the anatase phase. This similarity in bandgap values occurs presumably due to the high concentration of TiO2 nanoparticles surrounding the graphene flakes caused by electrostatic interactions. However it can be expected that in future studies, different concentration ratios of TiO2 and graphene in the nanocomposite will significantly decrease the combined bandgap, as this concentration ratio dependence on the bandgap value has been demonstrated in other graphene/TiO2 nanocomposites [30-32].
3.5. A theoretical model of graphene/TiO2 nanocomposite
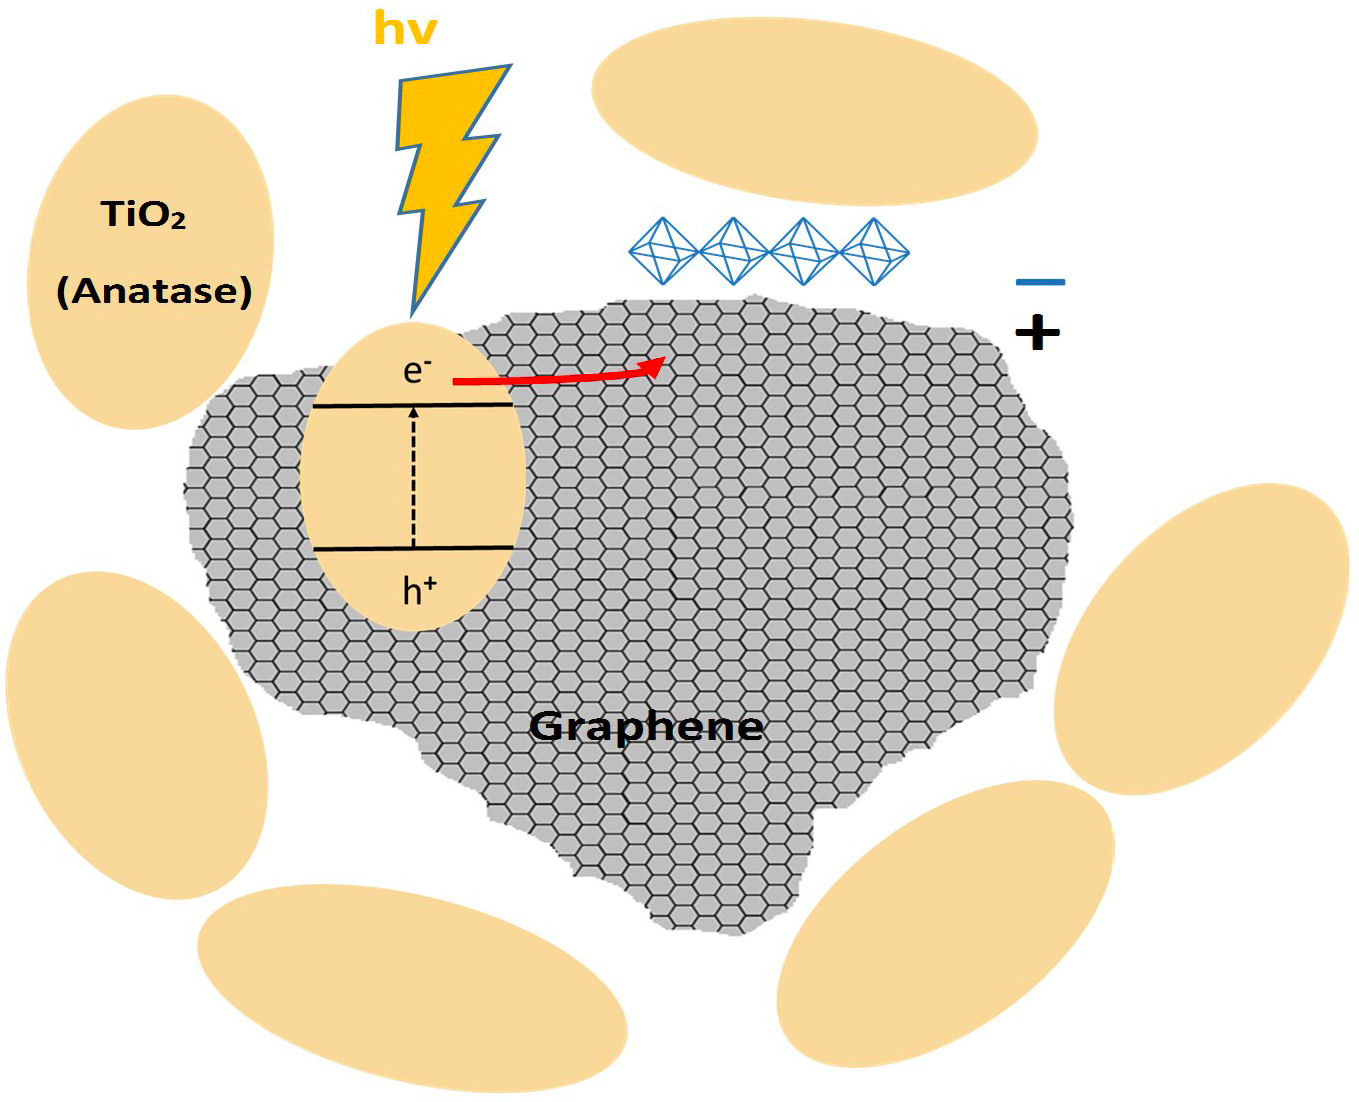
Figure 8 shows a graphene/TiO2 nanocomposite model that was developed from the TEM images. Anatase nanoparticles appear to aggregate around graphene flakes and also on the surface. This attraction between the two phases may be due to the positive charge in graphene and the negative charge in TiO2 particles, generating a weak bond, possibly Van der Waals, that does not generate a chemical reaction but does produce an aggregation of both nanomaterials.
4. Conclusions
The obtained graphene/TiO2 composite structure corresponds to the mechanical mixing of the graphene and titania phases on a nanometric scale, which was confirmed by electronic diffraction (MET), X-ray diffraction and highresolution field emission microscopy in chemical analysis mode. The Raman spectrum of the electrochemically exfoliated graphene sample allowed to confirm that the separation of the graphite layers was performed properly and few-layer graphene was obtained. The produced TiO2 has an extremely small particle size of around 6 nm which even though renders high bandgap energy, has a high specific surface area and provides the potential to stop the recombination process of electrons and holes coupled by an enhanced transport of electrons on the highly conductive graphene. The understanding of the obtained nanocomposite structure led to the development of a conceptual model that includes a two-phase composite held together by Vander Waals electrostatic forces in which the negative oxygen charges are attracted to the positive carbon forces of the graphene network. This nanocomposite configuration is expected to favor the energy collection by the anatase phase and the subsequent injection of generated electrons into the graphene network. Therefore, this nanomaterial may be promising in applications related to photocatalysis.

