


 nueva página del texto (beta)
 Inglés (pdf)
 Artículo en XML
 Referencias del artículo
 Enviar artículo por email
 Citado por SciELO
  Similares en
SciELO
Similares en
SciELO 
 Permalink
1. Introduction
The ability of pulsed lasers to produce cavitation in water is well known [1-3]. For instance, pulsed Holmium and Thulium fiber lasers have been used in the last two decades in laser lithotripsy (destruction of kidney stones). For this application, the typical laser pulse energies are 0.5-1.0 J with pulse durations of 350
The difference between the two techniques can be described as follows. From the heat transfer equation, the characteristic time after which thermal conduction becomes important is [13]
On collapse, as for the pulsed regime, a strong and short ultrasound pulse is produced (typical pressure of few MPa, and pulse duration of the order of 1
In this paper we report the observation of thermoactivated cavitation in pure water induced by a thulium-doped fiber laser, and describe the basic properties of the resulting ultrasound wave.
2. Experimental setup
The experimental setup for cavitation bubble detection is depicted in Fig. 1. A home-made tunable thulium-doped fiber laser (TDFL) was used to generate laser emission near the 1950 nm wavelength region with a tuning range of 44 nm. This TDFL was experimentally demonstrated and characterized in Ref. 18. A thulium-doped fiber (TDF, CoreActive SCF-TM-8/125) with a length of 10 m was used as a gain medium to generate laser emission in the wavelength range of 1950 nm. The laser wavelength selection and discrete tuning was achieved by means of a high-birefringence (Hi-Bi) fiber optical loop mirror (FOLM) as spectral filter whose reflection/transmission periodically modulated spectrum is wavelength displaced by performing temperature variations on the Hi-Bi fiber loop. The output beam was collimated (with a beam diameter about 4 mm) and focused by a simple positive lens of 5 cm focal distance inside a cell filled with deionized water. To control the spot size in the cell, the focusing lens was mounted on a translation stage. The cell was
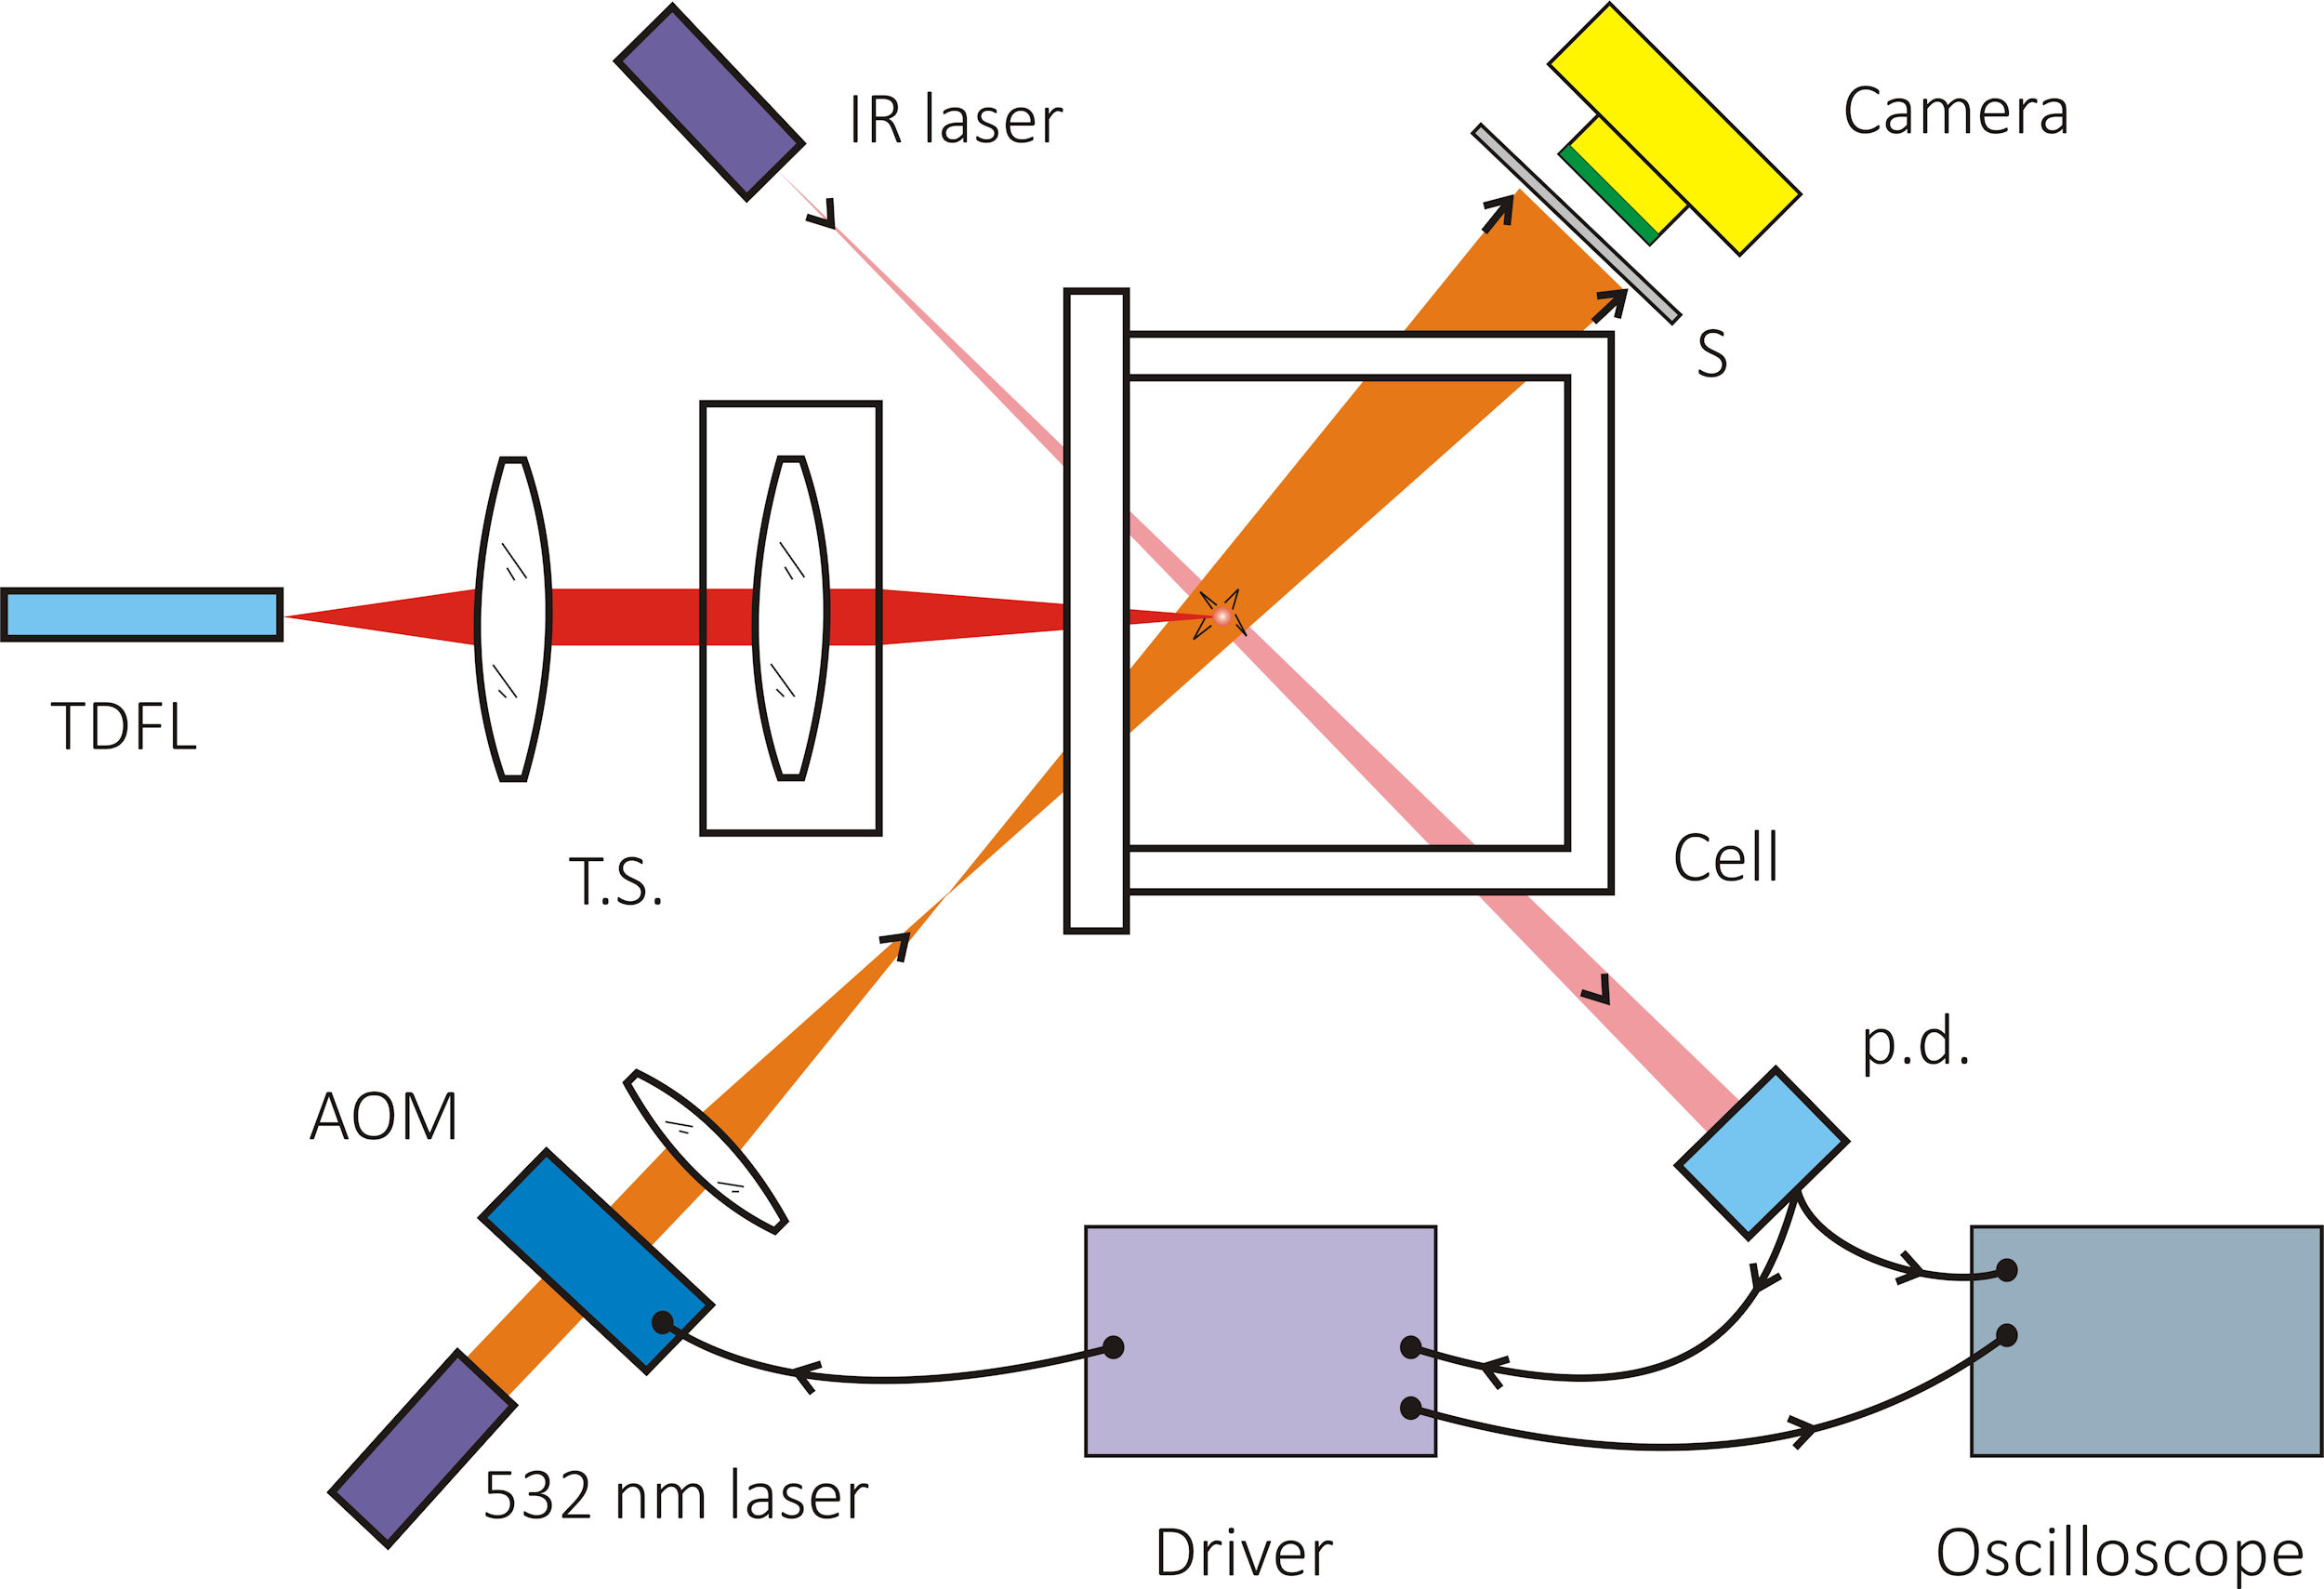
Figure 1 Optical setup employed for detecting cavitation bubbles induced by illumination of a low power, CW thulium-doped fiber laser (TDFL); T.S.: translation stage; p.d.: photodiode; AOM: acousto-optical modulator; S: screen.
The cavitation events produce ultrasound shock waves which are detected by a simple optical system based on the measurement of the deflection that the shock wave induces on a focused probe laser beam, as it is shown in Fig. 2. The probe laser employed in this detection system is a CW laser with emission at 532 nm and power of 50 mW, the estimated diameter of this beam at focus was 90

3. Results
The oscilloscope traces of the photodetector and modulator pulse are shown in Fig. 3; a photograph of the bubble projection is shown in the inset. It is observed that the time from the bubble formation to its collapse is around 300 microseconds, and the calculated bubble diameter is approximately 2 mm. These values are comparable to those reported for pulsed thulium and holmium fiber coupled lasers [4,6], and for thermoactivation in salt solutions [11] and pure water [12]. Note that the bubble shown in the Fig. 3 is close to the maximal size which can be obtained with our setup.
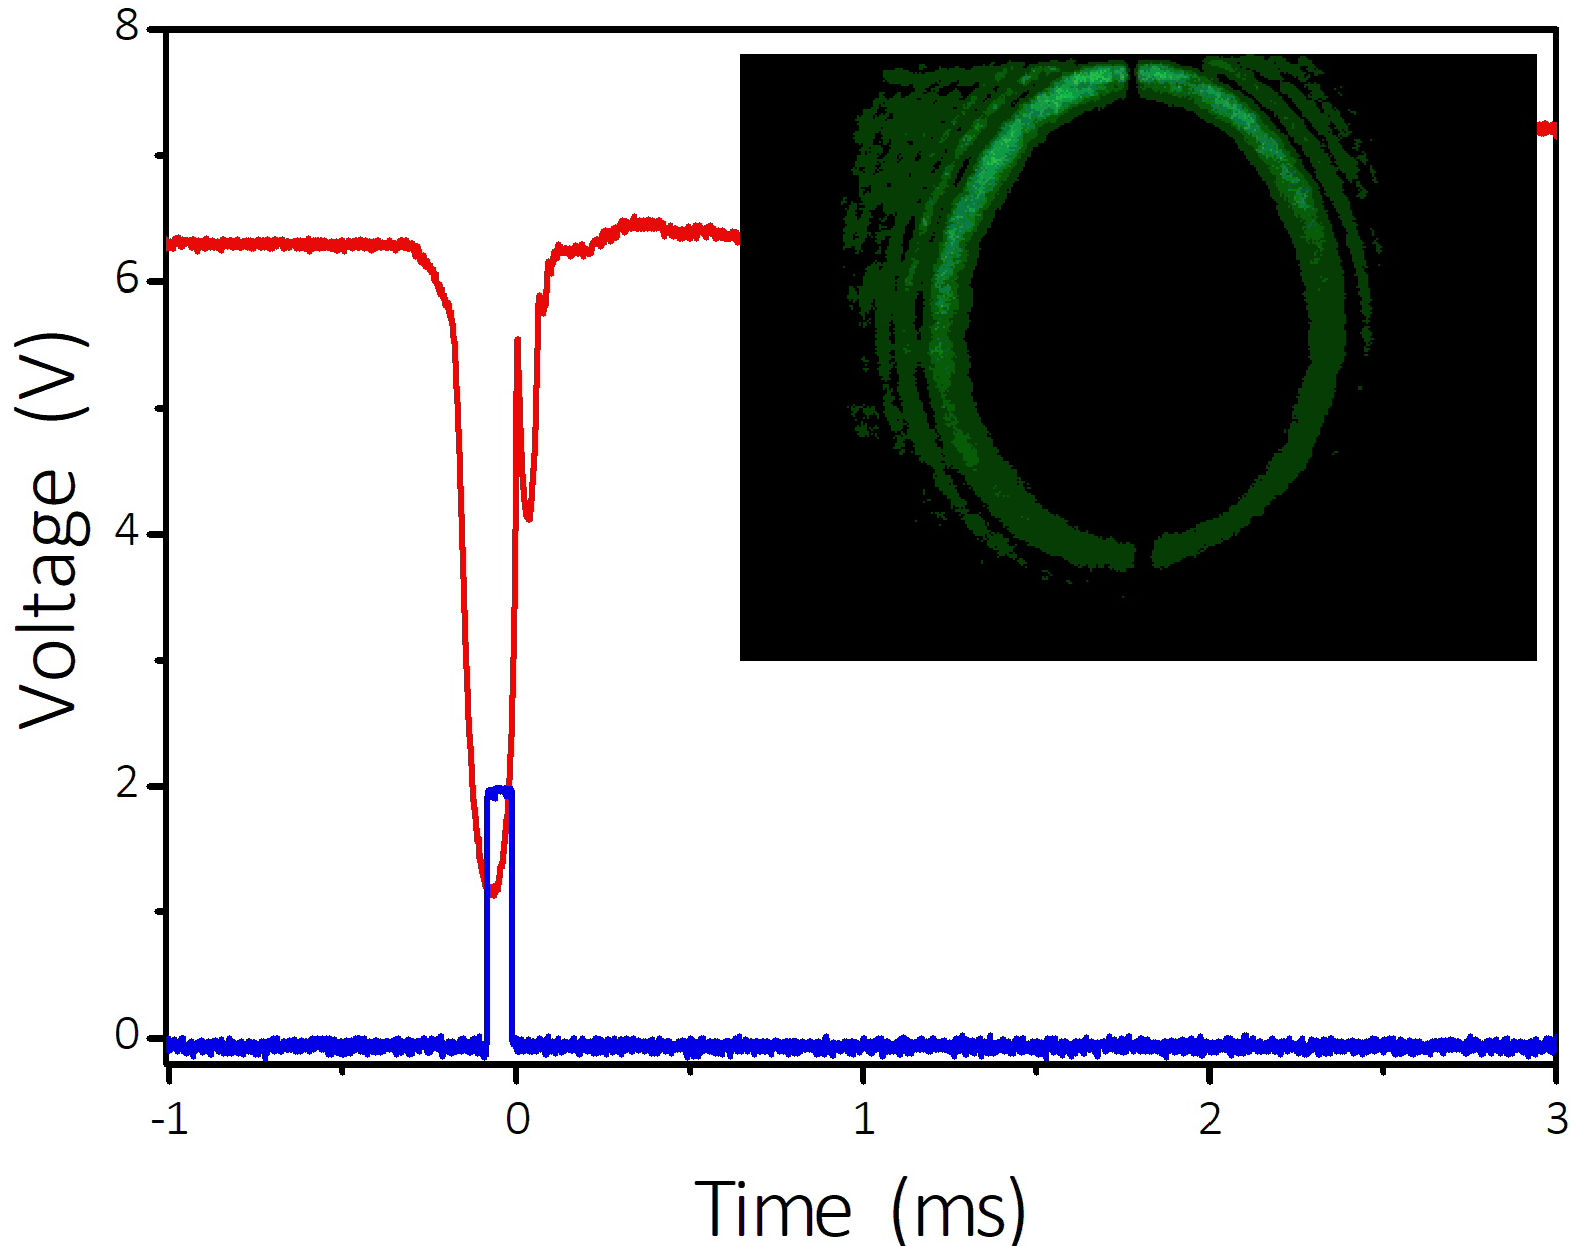
Figure 3 Oscilloscope traces of the photodetector signal (in red) and the modulator pulse. In the inset: photograph of the bubble projection as observed on the screen. The thin vertical line at the image center is an alignment mark on the screen.
Typical ultrasonic signal is shown in Fig. 4. It was obtained near the position of the smallest spot size [see Fig. 5(a)]. It demonstrates a spike due to the first arrival of the shock wave, and some rebounds from the input window surfaces, water-air interface and cell walls. To minimize the rebounds, in this experiment the walls were covered with an ultrasound absorbing material; otherwise complicated waves propagating inside the walls arrive to the measurement spot first, resulting in speckle pattern.
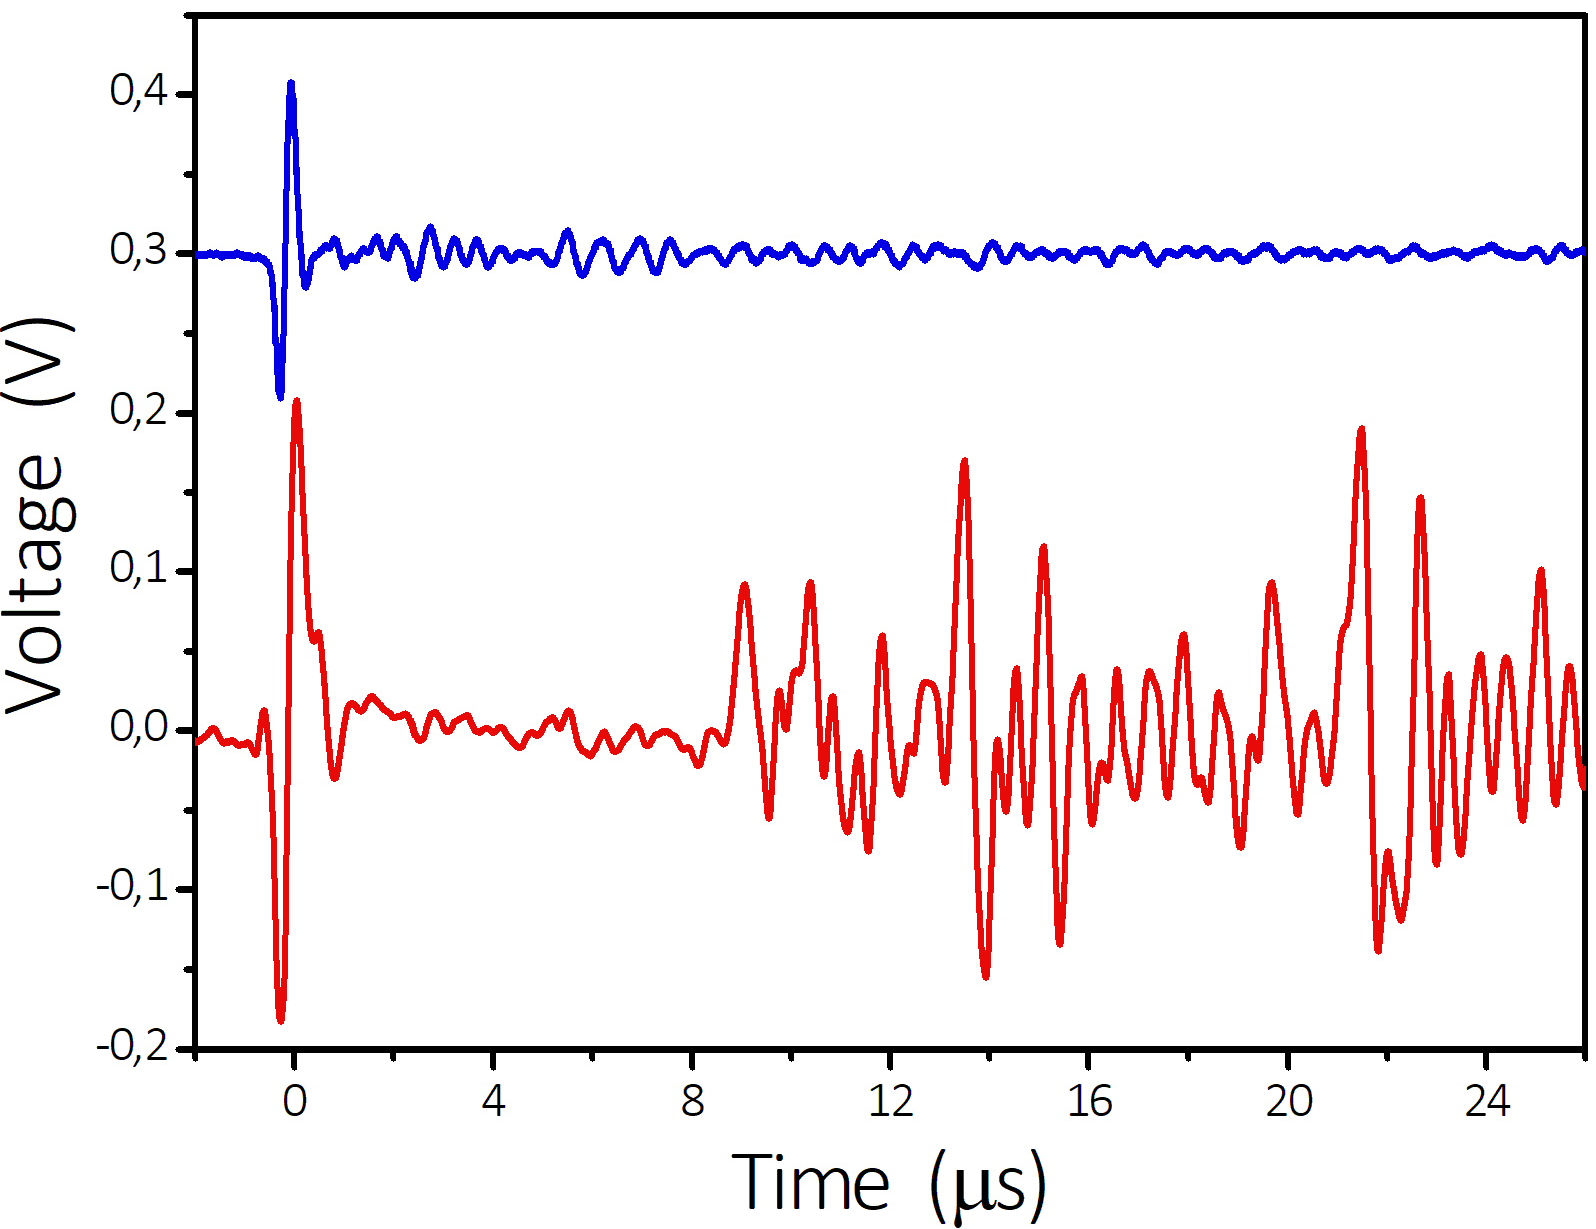
Figure 4 Oscilloscope trace of a ultrasonic signal produced by cavitation at the focusing lens position of -0.50 mm. The wavelength of the incident light was 1932 nm with a power of 220 mW. The triggering is done by the first spike arrival. The lower trace (in red) was obtained by the optical system, and for comparison the upper trace (in blue) was obtained with a piezoelectric transducer.
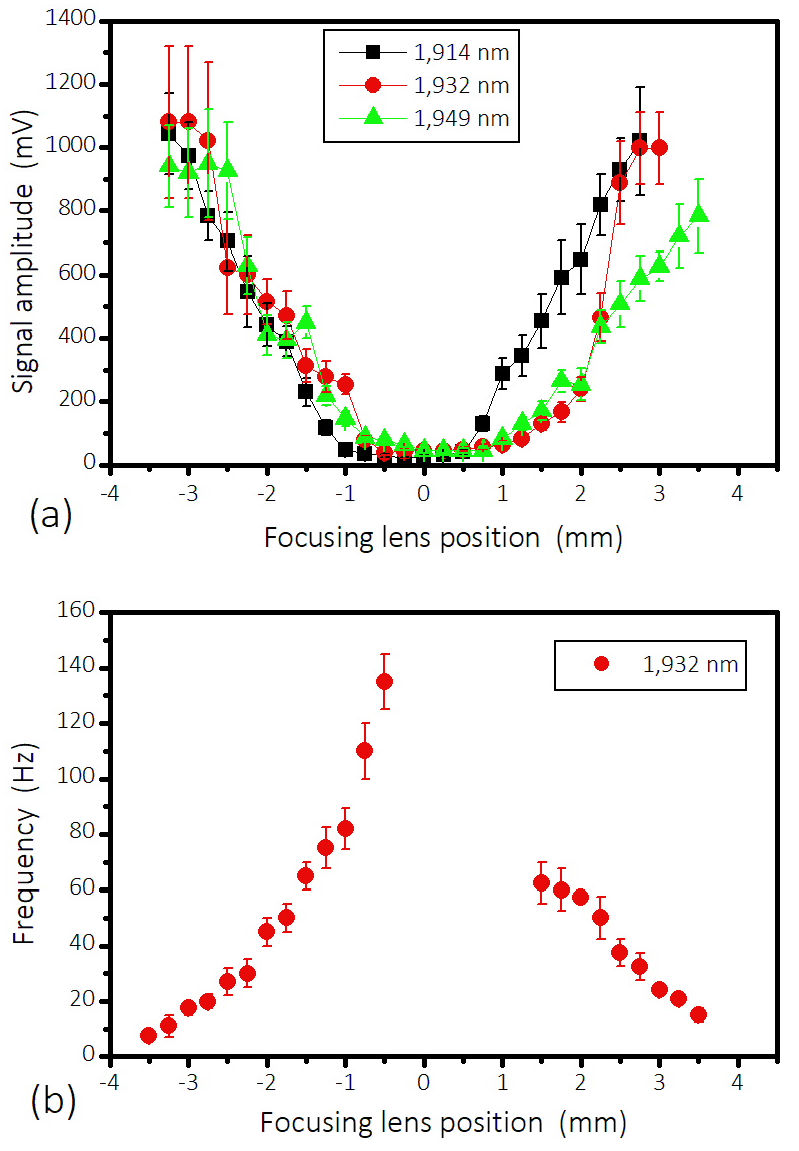
Figure 5 Signal amplitude (a) and repetition frequency (b) as a function of the focal spot size, as given by the focusing lens position. The zero position corresponds to the beam focused at the water-glass interface. The incident light power was 630 mW.
The features of the obtained ultrasound signals are quite similar to those reported earlier for saturated copper nitrate saline solutions [11], which were detected by means of a hydrophone. The main characteristic results are summarized in the next figures.
Figure 5 (a) shows the signal amplitude as a function of the focal spot size, as given by the water-glass interface distance to the lens, for three different illuminating wavelengths (1914, 1932 and 1949 nm); while Fig. 5 (b) shows the repetition frequency as a function of the focal spot size for the illuminating wavelength of 1932 nm. The power of the incident light from the TDFL on the glass window was set to 630 mW. Note that in the region 0.0 to 1.5 mm the microphone employed does not permit to detect correctly the high cavitation frequency.
Figure 6 shows the dependence of the signal amplitude and repetition frequency as a function of the incident light power near positions surrounding the position of the smallest spot size for a wavelength of 1932 nm. Note that the minimal necessary power to start the cavitation process proved to be

4. Discussion
The cavitation phenomenon presented in these experiments is qualitatively very similar to that observed in a solution of inorganic salt reported in Ref.[11]. The characteristic frequencies, amplitude dependences and necessary laser powers correspond well to those observed earlier for solutions and for water illuminated at 1.9
From Fig. 5 (b) it is observed that the pulse repetition frequency is maximal for the exact focus (close to the 0.0 mm position), and it diminishes when the laser spot becomes bigger, but the pulse amplitude, on the contrary, is higher for bigger laser spots [Fig. 5(a)]. So there is a critical laser spot size; when the incident beam is too large, the cavitation does not occur. It is worth noting that the interval between subsequent cavitation events varies with a wide statistical distribution [see errors bars in Figs. 5(b) and 6]; the variation in the interval is especially pronounced for large lens displacements from focus. There is a slight asymmetry (difference for a same beam spot size before and after the focus), which occurs because of slightly different geometry (converging or diverging beam inside the water). Because the absorption length is small, for a lens with a large focal distance this asymmetry is not so pronounced; it is observed more clearly in lenses with short focal distances.
These features are explained by thermoactivation mechanism [9]. For tight focusing, a small volume is overheated rapidly, thus the time between the subsequent events is short. Because of this small volume of overheated region, the cavitation bubble is small, as well as the energy stored; which results in a wave of low amplitude. In fact, for a fixed spot size (as given by the lens distance from the cell window) the pulse amplitude becomes larger for lower intensity levels (see Fig. 6), which was observed for solutions as well [11]. For a bigger illuminated volume, a bigger bubble is produced, which results in higher wave amplitude and lower repetition rate. If the illuminated volume is too big, overheating cannot be achieved, thus no cavitation is produced.
For our wavelength tuning range (1914-1949 nm), the absorption length varies less than 10% and it is approximately 0.09 mm at 1950 nm [19]. Thus, not much variation in signal is observed in function of wavelength [Fig.5(a)].
Multiple cavitation events close to the optical window finally produce damage to the glass surface in form of microscopic dents. This is especially pronounced for ultrasonic waves with large amplitudes and low repetition frequency produced by large laser spots. The damage to the glass can finally distort the input beam up to the point where cavitation stops, but it can be resumed by moving the beam to a fresh point. The cavitation can also be induced by placing the fiber output end directly into the water [12]. However, after a few cavitation events, the fiber output end is affected mechanically as well.
It is interesting to compare CW and pulsed laser regimes for cavitation bubble formation. For thermoactivation mechanism the power of the CW lasers is much lower than the instantaneous power of the pulsed ones (up to two orders of magnitude), and the maximal repetition rate is higher (hundreds of Hz compared with tens of Hz for pulsed lasers ). The maximal ultrasound wave amplitude obtained with CW illumination, as estimated by the bubble size, is similar to that obtained for laser lithotripsy, but the direct laser ablation, which is important also [4,7], is much smaller due to lower average laser power. Generally, the action of thermoactivated and pulse-induced cavitation on biological tissues can be quite different and further investigation is needed. Here we limit ourselves to the demonstration of principle.
The choice of the visualization technique was affected by the available equipment. Most probably images with better quality can be obtained with incoherent stroboscopic illumination, or by a high-speed camera, as reported, for instance, in Refs. 11 and 12 . However, we consider that the resulting image quality is sufficient to estimate the bubble size. Our results, as expected, are very similar to those obtained for water with dyes at other illumination wavelengths [12]. The main contribution of this report is the experimental demonstration of the possibility to work with pure water by the appropriate choice of the wavelength.
5. Conclusions
We have demonstrated that cavitation can be obtained in water using low power CW laser with a wavelength close to 1950 nm, and that the features of the resulting cavitation are quite similar to those obtained for inorganic salt solutions with similar absorption at visible and NIR wavelengths. Different from the effects produced by pulsed lasers systems, thermoactivation mechanism can produce higher repetition rates with smaller bubbles; the bigger bubbles generated by thermoactivation have a size comparable to those obtained with pulsed lasers systems. However, the peak laser power for thermoactivation is much smaller, which potentially can result in more compact, cheaper and safer systems.

