


 nueva página del texto (beta)
 Inglés (pdf)
 Artículo en XML
 Referencias del artículo
 Enviar artículo por email
 Citado por SciELO
  Similares en
SciELO
Similares en
SciELO 
 Permalink
1. Introduction
There has been growing interest in many geographic locations, covering at least five continents, in demonstrating the associations between particulate matter (PM) and premature mortality. For instance, PM has been correlated with several adverse health effects, including but not limited to increased number of hospital admissions and/or emergency department visits, adverse respiratory symptomatology, and increased aggravation of chronic diseases in cardiovascular and respiratory systems.
Although research has been vast in terms of geographic coverage in assessing the deleterious health effects of PM, most studies to date have been conducted in developed countries, namely United States, Canada, and Europe. All of these studies have demonstrated the negative effect of air pollution on population-level health. Relatively few studies, however, are carried out in the context of developing countries such as Mexico, which includes the largest and most polluted metropolitan area in the Western Hemisphere. Furthermore, the lack of sufficient air pollution data to investigate the deleterious impacts of air pollution on the health of a particular population has been a continuous concern, particularly in the context of developing nations (Gutiérrez, 2010; Jayachandran, 2009; Arceo et al., 2016).
This research fills the aforementioned gaps within the literature by deploying a time-series semi-parametric Poisson regression approach to study the short-term associations between PM10 (particles with diameters that are generally 10 µg/m3 and smaller) and daily mortality due to cardiovascular complications, or respiratory disease for seven municipalities: Iztapalapa, Álvaro Obregón, Venustiano Carranza, Tlalnepantla de Baz, Xochimilco, Coacalco de Berriozábal, and Ecatepec de Morelos in Mexico City Metropolitan Area (2001-2013). We utilize natural cubic splines to control for season, temperature, and PM10 variations and consider other pollutants that could affect the daily mortality count. This study is the first to employ the multiple imputations technique to address missing data within air pollution and mortality data, and to create an adequate dataset. We find that there is a strong association between mortality events and increased levels of PM10 and that different municipalities experience different levels of increased risk of mortality due to air pollution in different seasons of the year. Lastly, our results support the World Health Organization’s threshold of 150-155 µg/m3 for PM10, in which surpassing this level of PM10 results in a higher risk of mortality within the assessed municipalities.
The remainder of the paper is organized as follows: sections 2 and 3 present a literature review and the study area, respectively; section 4 describes the municipalities and pollution stations, data, analytic methods, and multiple imputation approach; in section 5, we discuss the regression results. The paper concludes with a discussion of results in section 6.
2. Literature review
Recent estimates suggest that air pollution disease burden is substantial. Many time-series studies of hazardous chemicals associated with PM have been performed to observe the short-term effect of air pollution on the health of individuals. Much of this research has focused on the adverse effects of air pollution on respiratory function and its correlated cardiovascular function (e.g., Romieu et al., 2012). Researchers have also explored long-term effects, focusing on evaluating cumulative exposure to air pollution and the resultant chronic mortality and morbidity (e.g., Beelen et al., 2014). Lim et al. (2013) studied the mortality count due to air pollution worldwide and found that “exposure to PM2.5 contributed 3.2 million premature deaths worldwide in 2010, [mainly] due to cardiovascular disease, and 223 000 deaths from lung cancer”. Studies have also broken down the association between air pollution and premature mortality by age of the cohort: infant (e.g., Hajat et al., 2007), children (e.g., Gouveia et al., 2018), adult (e.g., Osmond and Barker, 2000), elderly (e.g., Kampa and Castanas, 2008), and/or general public (Wang et al., 2017), all of which have found positive association.
In the North American context, Mexico has experienced high impacts of air pollution, especially in its very populous Mexico City Metropolitan Area. Using a time-series approach, Loomis et al. (1999) evaluated the association between high levels of fine particles and infant mortality. The authors identified a positive relationship between fine particulate concentrations and infant mortality in Mexico City. Furthermore, Holguín et al. (2003) identified that ambient levels of PM, as well as ozone, are linked to reductions in high-frequency aspects of heart rate variability in elderly residents of Mexico City. Romero-Lankao et al. (2013) found that health risks associated with atmospheric conditions and pollutants (e.g., PM) existed without boundaries or social conditions in three large cities in Latin American (Bogotá, Mexico City and Santiago). Similarly, Gouveia et al. (2018) investigated the impact of PM10 on the risk of childhood mortality due to respiratory diseases in four large Latin American urban centers (Mexico City, Santiago, Sao Paulo and Rio de Janeiro). These authors found that a 10 µg m-3 increase in PM10 can increase the risk of childhood mortality due to respiratory diseases by 0.47% to 1.38%.
A variety of modeling methods have been used to assess the adverse effect of air pollution on morbidity and mortality. These include the Poisson regression of ecological data (e.g., Wong et al., 2002), autoregressive Poisson models (e.g., Le Tertre et al., 2002), log-linear regression models (e.g., Samet et al., 2000), analysis of time series data (e.g., Katsouyanni et al., 1997), and fixed effects models (e.g., Arceo et al., 2016) have been utilized. These studies examine different pollutants, including particulates (PM10 or PM2.5) (e.g., Harrison et al., 1997), ozone (O3) (e.g., White et al., 1994), sulfur dioxide (e.g. Katsouyanni et al., 1997), nitrogen dioxide (NO2) (e.g., Linaker et al., 2000), or a mix of these pollutants (e.g., Barnett et al., 2005).
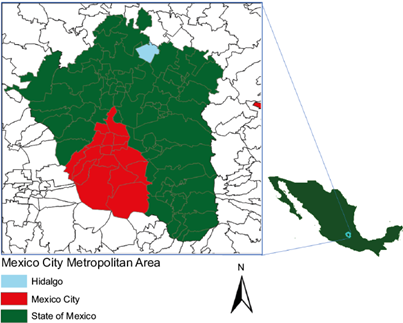
3. Study area: the Mexico City Metropolitan Area
The Mexico City Metropolitan Area (MCMA) is located in the Valley of Mexico (Fig. 1). The MCMA area is massive in terms of geographic coverage, including an area of approximately 1500 km2 at an elevation of 2240 m. The basin of the MCMA is surrounded by mountains on three of its four borders, with an average height of 1000 m above the floor of the valley. The MCMA has a population of more than 21 million people (UN, 2016) with six million cars in circulation (Barcelay, 2007) and expands over three states (Mexico City, the states of Mexico and Hidalgo). It comprises the 16 municipalities of Mexico City, 59 municipalities of the state of Mexico, and one municipality in the state of Hidalgo. More than 20% of Mexico’s entire population lives in the MCMA, and more than 30% of the country’s industrial output is produced within its environs.
The climate is dry, with moderate year-round temperatures and winds primarily from the northwest and northeast. There are distinct seasons throughout the year with it being warm from March to April, cold from November to February, and rainy from May to October. Warm and cold seasons contain dry months, exacerbated by shorter days and morning temperature inversions that are common and drastic (Vega et al., 2003). Prolonged bouts of smog remain over the city much of the year, and thermal inversions occur during the winter, which keeps polluted air close to the ground (Barcelay, 2007). In each season, Mexican standards for O3 and PM10 are often surpassed throughout the year.
These demographic and economic factors, along with topographic and meteorological characteristics, provide a foundation for the MCMA being among the most polluted urban areas worldwide. Luck (2008) ranked Mexico City in the top five world’s dirtiest and most polluted cities. This is the result of industrial and automobile emissions that affect air quality, by generating higher levels of sulfur dioxide, nitrogen oxide, carbon monoxide, fine particulate matter, and other organic compounds like benzene. In 2013, ozone levels in the MCMA failed to meet WHO standards 300 days of the year (Rodríguez-Sánchez, 2014). Such poor air pollution levels not only can exacerbate health illness for the most vulnerable, and those suffering from chronic diseases, but can also contribute to the development of illness in other persons. These can combine to have a significant impact on economic productivity along with other components of the country’s economy. For example, health-related problems caused by PM take away more than 2.5 million working days from the MCMA’s residents per year (Barcelay, 2007).
The current research seeks to study the effects of climate conditions and air quality on health, with specific inclusion of seasonal conditions. A seasonal approach to studying these environmental conditions allows a more meaningful measurement of the impact of emissions on both social conditions and mortality. Highlighting the various nuances of seasonal changes in this region of Mexico will add to the received literature regarding human influence on the health of the environment and climate change.
4. Methodology
We focused on seven municipalities within the MCMA to assess air pollution, temperature, and seasonality’s impacts on premature mortality. While this is not a representative sample of all municipalities in the MCMA, we selected them based upon their ability to represent large segments of the metropolitan area geographically. The identification of these seven municipalities was also shaped by data availability. Using this micro-level approach to understanding air pollution’s deleterious effects on health (e.g., mortality), we can produce a policy-relevant understanding of important factors for future mitigation of air pollution in the MCMA. Lastly, as previously identified, the MCMA still grapples with high levels of air pollution which pose as a serious threat to population-level health dynamics, warranting considerable empirical attention.
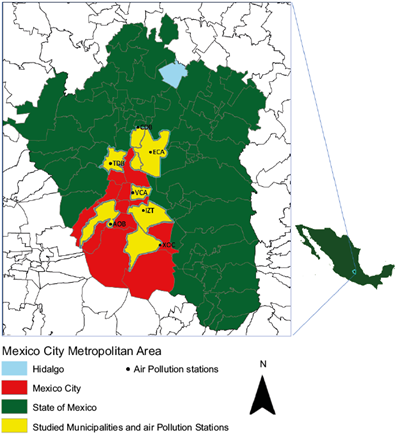
5. Municipalities and pollution stations
The municipalities utilized within our study include Iztapalapa (IZT), Álvaro Obregón (AOB), Venustiano Carranza (VCA), Tlalnepantla de Baz (TDB), Xochimilco (XOC), Coacalco de Berriozábal (CDB), and Ecatepec de Morelos (ECA) (see Fig. 1). Table I describes the air pollution sites included in the current study. IZT and XOC are located in the southeast portion of the MCMA with populations in 2010 of 1 815 786 and 415 007, respectively. ECA and CDB are also located in the northeast portion of the MCMA, with populations in 2010 of 1 656 107 and 278 064, respectively. The remaining sites are located in the southwest (AOB), center (VCA), and northwest (TDB) of the metropolitan area. Populations within these municipalities ranged from 727 034 (AOB), to 664 225 (TDB), and 430 978 (VCA), respectively (see Fig. 2).
Table I Municipalities and sites utilized in this study.
| Municipality | Municipality Abbreviation | Location | Site Name | Population (2010) |
| Iztapalapa | IZT | Southeast | UAM Iztapalapa | 1 815 786 |
| Álvaro Obregón | AOB | Southwest | Pedregal | 727 034 |
| Venustiano Carranza | VCA | Center | Merced | 430 978 |
| Ecatepec de Morelos | ECA | Northeast | Los Laureles | 1 656 107 |
| Tlanepantla de Baz | TDB | Northwest | Tlalnepantla | 664 225 |
| Xochimilco | XOC | Southeast | Tláhuac | 415 007 |
| Coacalco de Berriozábal | CDB | Northeast | Villa de las Flores | 278 064 |
Each municipality has two monitoring stations that measure PM10 and two monitors that measure temperature, except TDB, which has one monitor for each of PM10 and temperature measurements. These monitors operate 24 h, 365 days a year. The mean daily values for PM10 and temperature are used in the current analysis. Lastly, we picked stations at each corner of the MCMA.
6. Data
To analyze the relationship between PM10 and mortality in the seven municipalities of the MCMA, we collected, validated, and assessed air pollution, mortality, seasonality, and temperature data. Following Romero-Lankao et al. (2013), we utilized daily mean temperature data from the meteorological stations within each municipality. Finding pollution data in developing countries can be a challenge. Often, they are either absent completely or fraught with quality and design challenges. However, for our paper, we addressed these challenges by using the Red Automática de Monitoreo Atmosférico (Automatic Atmospheric Monitoring Network, RAMA) dataset. Measures are available for particulate matter under 10 µm (PM2.5 data were notoriously absent for most of the municipalities in our study, thus we did not impute the missing PM2.5 data), O3 (parts per billion), and NO2 (parts per billion). These data are gathered from 37 stations located all over the MCMA and recorded hourly, every day of the year. Pollution and temperature data for each municipality are pulled out from the data set due to the fact that other stations either do not have data regarding the period of interest (2001-2013) or data are notoriously absent to the degree that we do not feel comfortable imputing the missing data by the means of multiple imputation (MI) methods.
Daily mortality data due to respiratory, cardiovascular, and non-accidental causes ranging from January 1, 2001 to December 31, 2013 are collected from the Mexico’s Department of Health. The daily mortality count data are complete throughout the study period, not requiring MI on this data set. We exclude the deaths of the MCMA residents from accidents and those that happened outside the metropolitan area. In order to capture seasonality, we utilized a spline function applied to the data within each municipality. To derive the spline functions, we utilized seven knots per year, which is a common choice for daily mortality data (Bhaskaran et al., 2013).
7. Analytic methods
Using multiple analytic methods, we explored the impact of air pollution, temperature change, and seasonality on the risk of mortality within these seven municipalities. To achieve this, we applied a time-series approach, which facilitated our ability to adequately estimate associations between short-term changes in both air pollution and the mortality count. Hence, the data include daily counts of mortality, concentrations of PM10 and other pollutants, and daily temperature for each municipality. We utilized regression models to assess short-term effects from time-series studies, in which our air pollutant variable of interest (PM10) is included as a lagged effect in the model.
There are several statistical issues in the related literature concerning short-term estimations generated from the analysis of time-series data. As described by Bell et al. (2004), these include: (1) controlling for confounding factors that may impact association between pollution and health (e.g., season, temperature), (2) in the residuals, taking into account serial correlations that might underrate uncertainty of the estimated risk, (3) selecting the exposure variable lag, (4) accounting for measurement error related to exposure, and (5) assessing and reporting uncertainty related to the statistical model itself.
To address these concerns in our estimation, we include potential confounders, such as temperature and other pollutants (O3 and NO2). Personal variables, which may include smoking history, income, occupational pollution exposure, medical care accessibility, and age distribution, are not likely to confound time-series studies because these maintain relative consistency over time within a given geographical region (Bell et al., 2004; Cropper et al., 1997). Moreover, short-term fluctuations are also controlled using an indicator variable for the days of the week and time trend. Additionally, we deployed smoothing and semiparametric approaches, complementing distributed lag models, as detailed in Schwartz et al. (1996) and following Bell et al. (2004). We applied multiple imputations for missing data to also accommodate measurement error (Blackwell et al., 2015; Rubin, 1978). Time-series analyses of semiparametric model specifications for air pollution and health have been exhaustively examined within the published literature (Bell et al., 2004; Dominici et al., 2004; Peng et al., 2006). Thus, we deploy a semi-parametric regression context to develop the PM10-mortality association for the sampled municipalities. The function of daily air pollution measurement (PM10) is the logarithm of daily expected deaths (i.e., mortality), which takes into consideration the presence of temperature, other pollutants, and an indicator variable for the day of the week. Mortality data follow an over-dispersed Poisson distribution. Hence the expected mean and variance of mortality can be assumed as
where ϕ is the overdispersion parameter.
Deploying smoothing and semiparametric (splines) approaches allowed us to control for the effects of daily temperature along with capturing seasonality and long-term trends, respectively, ultimately facilitating our ability to redress the non-linearity of both seasonality and temperature. Consequently, the regression equation can be expressed as:
where Y ij is the daily mortality count for i, which represents each municipality, being j the day, which follows an over-dispersed Poisson distribution. βPM PM10i,j is the PM10 measurement for the ith municipality on the jth day. TEM ij covariates represent time and temperature for the ith municipality on the jth day. Temperature and pollution measurement effects are expressed by unknown smoothing functions g(•) and f(•), respectively, constructed using natural cubic splines. The variable s(Time, 7) is a smooth function of time with 7 degrees of freedom and DOW, which is an indicator variable for the day of the week (DOW does not control for holidays). In this time-series analysis, the number of knots that minimize Akaike Information Criteria (AIC) are used as the degrees of freedom for the natural cubic spline functions. PM10 was of primary interest, but we also consider NO2 and O3 as independent predictors. We do so since there is a high correlation (> 0.3 [Cropper et al., 1997]) among those pollutants, which contributes to our ability to control for unobserved potential influences. The error term is modeled using ϵ ij , which includes residuals from the model. βPM is our parameter of interest, which gives an estimate of mortality change associated with change in one-unit change in PM10 levels.
PM10 exposures on previous days may influence current health outcomes. Thus, mortality counts may be delayed. Distributed lag models allow us to include multiple lagged measures for the impact of PM10 for the previous seven days:
We implemented two series of regression models: (1) without a seven-day lag and (2) with a distributed lagged model.
8. Multiple imputations
To address the issue of missing data, multiple methods may be utilized. The listwise deletion approach (complete case) is the traditional method, where the cases with one or several missing values are deleted. It has been noted that listwise deletion does not supply either valid standard errors and/or confidence intervals (Carlin et al., 2003); however, there have been cases where there is an exception (King et al., 2001). Another problem with this practice is that valid data points that happen to be in the same row as a missing value will be lost, leading to the loss of degrees of freedom in model estimation (Kropko et al., 2014).
To address missing information within our dataset, we used the MI method to create a complete panel data set. While there has been some criticism of MI, it has mostly centered on single value imputation misrepresenting the uncertain estimates (Carlin et al., 2003). However, to represent uncertainty, MI allows us to fill in missing observations with a set of plausible values. Figure 3 provides a graphical representation of the increasing popularity of MI.
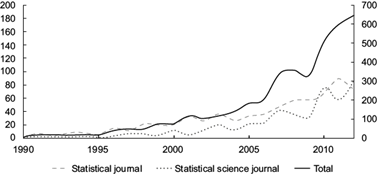
Fig. 3 The left axis displays the number of published papers on multiple imputation in statistical journals and social science journals. The right axis displays the total number of journals. Source: Yang et al. (2015).
The uniqueness of MI, as opposed to other imputation methods, is that it allows us to fill in missing values with a set of values that is better able to attest the uncertainty of estimating the missing values. MI methods also offer us two vital paths for analysis. The first, joint modeling, uses multivariate normal (MVN) that takes non-normal variables into account. The second path is similar to MI by chained equations which utilize conditional univariate models without strict justification. In this research, we plotted histograms of each variable that needed to be imputed to ascertain suitable distributions for the MVN model.
Following Yang et al. (2015), we normalized highly skewed variables. MVN imputation implements an iterative Markov chain Monte Carlo method (data augmentation) for imputing multiple continuous variables under the MVN. The missingness pattern can be arbitrary in MVN, since “there exists no consensus on the acceptable amount of missingness. Analyses using multiple imputations, with low amounts of missingness, can produce similar results to listwise deletion. Conversely, if large amounts of missingness exist within a dataset, it can drive the derivation of point estimates, biasing results” (www.ssc.wisc.edu/sscc/pubs/stata.mi.decide.htm). The results of imputation on each data set were then combined using Rubin’s rules (Little and Rubin, 2019). Table II provides missingness for all exogenous measures. All analyses for the current paper were performed using Stata v. 14.
9. Results
In Table II we report missingness for exogenous measures. Missingness on PM10 ranged from 0.95% in municipality TDB upward to 23.93% in municipality IZT. Missingness on temperature ranged from 0.76to 29.34%. Also, missingness on O2 ranged from relatively low amounts (0.02%) to substantial amounts (81.34%). Missingness on NO2 exhibited similar patterns, with some municipalities having relatively low amounts of missingness (0.11%) while others showed extremely high amounts of missingness (81.00%). We did not use MI when the amount of missingness was greater than 30%.
While variations in mean temperatures of these municipalities are small, there are additional seasonal alterations in the MCMA (see Table III). Air pollution levels throughout the seven municipalities are relatively and consistently high (e.g., ~290 and ~250 µg/m3 PM10 in CDB and ECA, respectively). Noteworthy, there are indications that air pollution and changes in mean regional temperatures, along with other climatic hazards, will intensify within Latin America, including Mexico, due to climate change (Magrin et al., 2007). Table III provides summary statistics for our study. There was a total of 4748 days within the time period (i.e., observations for each municipality). To help illustrate our findings, we describe the results for IZT. However, Table III provides estimates for all municipalities included in the current study. For IZT, PM10 levels ranged from 6.81 to 177.17. The mean of cardiorespiratory death events in IZT was 5.48 incidences. The temperature ranged from 7.37 to 24.51 ºC. Figure 4 shows scatter plots of both the exposure (PM10) and outcome (number of cardiorespiratory deaths) over time for IZT, as an example (scatter plots of daily mortality and PM10 concentrations for the different municipalities can be obtained upon request), for the entire study period (2001-2013). The raw plots show that both PM10 levels and death counts seem to be dominated by annual seasonal patterns, with PM10 and daily cardiorespiratory mortality highest in winter.
Table III Summary statistics.
| Variable/municipality | Minimum | Mean | Standard deviation | Maximum |
| Cardiorespiratory | Number of daily deaths due to cardiorespiratory events | |||
| IZT | 0.00 | 5.48 | 2.88 | 21.00 |
| AOB | 0.00 | 2.92 | 1.92 | 13.00 |
| VCA | 0.00 | 2.48 | 1.72 | 11.00 |
| ECA | 0.00 | 4.35 | 2.51 | 22.00 |
| TDB | 0.00 | 2.52 | 1.73 | 14.00 |
| XOC | 0.00 | 1.27 | 1.21 | 7.00 |
| CDB | 0.00 | 0.64 | 0.82 | 5.00 |
| Cardiovascular | Number of daily deaths due to cardiovascular events | |||
| IZT | 0.00 | 3.96 | 2.32 | 14.00 |
| AOB | 0.00 | 2.13 | 1.60 | 10.00 |
| VCA | 0.00 | 1.88 | 1.47 | 10.00 |
| ECA | 0.00 | 3.06 | 2.02 | 16.00 |
| TDB | 0.00 | 1.80 | 1.42 | 10.00 |
| XOC | 0.00 | 0.94 | 1.02 | 6.00 |
| CDB | 0.00 | 0.47 | 0.70 | 4.00 |
| Respiratory | Number of daily deaths due to respiratory events | |||
| IZT | 0.00 | 1.52 | 1.38 | 10.00 |
| AOB | 0.00 | 0.80 | 0.93 | 9.00 |
| VCA | 0.00 | 0.61 | 0.81 | 7.00 |
| ECA | 0.00 | 1.29 | 1.23 | 9.00 |
| TDB | 0.00 | 0.71 | 0.88 | 8.00 |
| XOC | 0.00 | 0.33 | 0.59 | 4.00 |
| CDB | 0.00 | 0.17 | 0.42 | 3.00 |
| PM10 (µg m-3) | Particle matters with diameters that are generally 10 micrometers per cubic meter and smaller | |||
| IZT | 6.81 | 50.40 | 21.20 | 177.17 |
| AOB | 6.88 | 39.06 | 15.67 | 115.32 |
| VCA | 6.71 | 52.81 | 22.24 | 161.29 |
| ECA | 11.70 | 67.94 | 28.09 | 249.90 |
| TDB | 4.75 | 52.93 | 20.13 | 194.21 |
| XOC | 1.67 | 46.86 | 19.99 | 190.75 |
| CDB | 8.30 | 63.72 | 28.77 | 289.35 |
| O3 (ppb) | Ozone | |||
| IZT | 0.29 | 27.64 | 9.86 | 70.73 |
| AOB | 0.98 | 31.58 | 12.16 | 82.33 |
| VCA | 0.20 | 24.79 | 9.65 | 73.86 |
| ECA | 3.08 | 25.71 | 8.92 | 72.54 |
| TDB | 1.58 | 26.83 | 9.61 | 80.17 |
| XOC | 1.70 | 49.78 | 17.38 | 92.54 |
| CDB | 0.67 | 25.82 | 7.75 | 64.27 |
| NO2 (ppb) | Nitrogen dioxide | |||
| IZT | 3.69 | 31.28 | 9.62 | 78.13 |
| AOB | 6.38 | 27.53 | 9.34 | 71.71 |
| VCA | 8.83 | 37.47 | 11.04 | 82.22 |
| ECA | 5.54 | 29.13 | 9.01 | 74.67 |
| TDB | 7.27 | 33.11 | 10.85 | 88.60 |
| XOC | 2.70 | 21.93 | 6.97 | 45.42 |
| CDB | 1.21 | 18.55 | 7.89 | 55.55 |
| TEMP (°C) | Temperature | |||
| IZT | 7.37 | 16.57 | 2.11 | 24.51 |
| AOB | 5.80 | 16.33 | 2.50 | 24.91 |
| VCA | 7.23 | 17.39 | 2.53 | 25.93 |
| ECA | 3.59 | 16.88 | 2.71 | 25.81 |
| TDB | 2.40 | 16.64 | 2.54 | 25.80 |
| XOC | 7.11 | 16.16 | 2.29 | 23.72 |
| CDB | 5.86 | 16.67 | 2.58 | 24.96 |
IZT: Iztapalapa; AOB: Álvaro Obregón; VCA: Venustiano Carranza; ECA: Ecatepec de Morelos; TDB: Tlalnepantla de Baz; XOC: Xochimilco; CDB: Coacalco de Berriozábal.
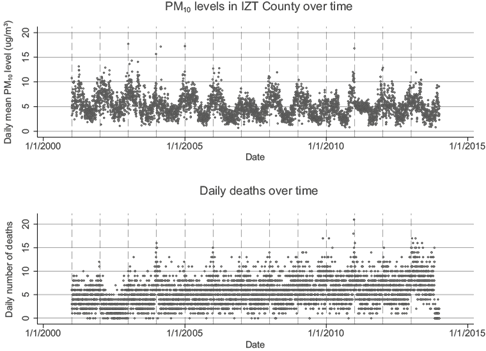
Fig. 4 Raw plot showing cardiorespiratory death and PM10 exposure over time (2001-2013) in the Iztapalapa municipality.
Table IV provides estimates of our regression modeling. We report these results first by providing estimates of the overall effect for models without lags and then with lags. Secondly, we report findings for each season, respectively. In our first set of models, the CDB municipality increase risk of mortality was experienced in terms of respiratory outcomes with a 10 µg m-3 increase of PM10. Additionally, the ECA municipality exhibited an increased risk of mortality from cardiorespiratory and respiratory diseases with a 10 µg m-3 increase of PM10, while the IZT, AOB, and XOC municipalities also exhibited increases in the risk of mortality from cardiorespiratory, cardiovascular, and respiratory diseases with the same increase of PM10.
Table IV Adjusted relative risk of death due to exposure to PM10 in different seasons and municipalities.
| Municipality/disease | Overall aRR1 (CI) | Warm season aRR (CI) | Cold season aRR (CI) | Rainy season aRR (CI) |
| IZT | ||||
| Cardiorespiratory | 1.023 (1.012, 1.033) | 1.028 (1.002, 1.055) | 1.009 (1.000, 1.023) | 1.018 (1.000, 1.046) |
| Cardiovascular | 1.012 (1.001, 1.025) | 1.036 (1.006, 1.067) | .999 (.982, 1.017) | 1.017 (.984, 1.052) |
| Respiratory | 1.033 (1.013, 1.053) | 1.000 (.947, 1.056) | 1.026 (1.000, 1.053) | 1.019 (.964, 1.078) |
| IZT (L.7) | ||||
| Cardiorespiratory | 1.029 (1.008, 1.051) | 1.091 (1.017, 1.170) | 1.016 (.972, 1.061) | 1.030 (.988, 1.075) |
| Cardiovascular | 1.021 (.996, 1.048) | 1.013 (1.004, 1.022) | .999 (.952, 1.049) | 1.026 (.976, 1.079) |
| Respiratory | 1.047 (1.005, 1.091) | .971 (.840, 1.121) | 1.043 (.971, 1.120) | 1.038 (.953, 1.131) |
| AOB | ||||
| Cardiorespiratory | 1.002 (1.000, 1.004) | 1.003 (.998, 1.007) | 1.003 (1.000, 1.005) | .998 (.993, 1.003) |
| Cardiovascular | 1.001 (1.000, 1.004) | 1.004 (.998, 1.009) | 1.001 (1.000, 1.004) | .997 (.992, 1.003) |
| Respiratory | 1.002 (1.000, 1.006) | 1.000 (.992, 1.008) | 1.005 (1.000, 1.011) | 1.001 (1.000, 1.009) |
| AOB (L.7) | ||||
| Cardiorespiratory | 1.053 (1.010, 1.098) | 1.059 (.925, 1.211) | 1.053 (.977, 1.134) | 1.043 (.963, 1.130) |
| Cardiovascular | 1.071 (.989, 1.160) | 1.025 (.873, 1.204) | 1.038 (.947, 1.137) | 1.063 (.969, 1.166) |
| Respiratory | 1.045 (1.000, 1.098) | 1.128 (.877, 1.450) | 1.091 (.949, 1.253) | .990 (.840, 1.166) |
| CDB | ||||
| Cardiorespiratory | 1.015 (.993, 1.036) | 1.002 (.947, 1.061) | 1.023 (.988, 1.059) | 1.068 (1.002, 1.139) |
| Cardiovascular | 1.007 (.981, 1.034) | .995 (.929, 1.065) | 1.028 (.984, 1.073) | .993 (.913, 1.079) |
| Respiratory | 1.032 (1.000, 1.074) | .750 (.524, 1.075) | 1.012 (.943, 1.085) | 1.065 (1.030, 1.192) |
| CDB (L.7) | ||||
| Cardiorespiratory | 1.001 (0.961, 1.043) | 1.017 (.884, 1.170) | .965 (.889, 1.048) | 1.010 (1.001, 1.020) |
| Cardiovascular | 0.977 (0.929, 1.030) | 1.009 (.850, 1.197) | .961 (.869, 1.064) | 1.037 (.936, 1.150) |
| Respiratory | 1.069 (.985, 1.160) | 1.074 (.780, 1.478) | .936(.784, 1.117) | 1.073 ( 1.042, 1.152) |
| ECA | ||||
| Cardiorespiratory | 1.002 (1.000, 1.011) | 1.005 (.984, 1.027) | .997 (.984, 1.009) | .996 (.968, 1.024) |
| Cardiovascular | .997 (.986, 1.008) | 1.006 (.979, 1.034) | .996 (.981, 1.012) | .990 (.957, 1.023) |
| Respiratory | 1.013 (1.000, 1.029) | 1.004 (.962, 1.047) | .994 (.971, 1.017) | .994 (.971, 1.017) |
| ECA (L.7) | ||||
| Cardiorespiratory | 1.020 (1.002, 1.039) | 1.020 (.970, 1.091) | .988 (.958, 1.018) | 1.027 (.987, 1.069) |
| Cardiovascular | 1.020 (1.000, 1.042) | 1.062 (.985, 1.147) | .980 (.943, 1.019) | 1.039 (.991, 1.089) |
| Respiratory | 1.020 (1.003, 1.055) | .949 (.845, 1.066) | 1.007 (.952, 1.065) | .997 (.921, 1.079) |
| TDB | ||||
| Cardiorespiratory | 1.004 (.988, 1.019) | 1.002 (.970, 1.036) | 1.004 (.980, 1.029) | 1.012 (.973, 1.052) |
| Cardiovascular | 1.002 (.983, 1.021) | .993 (.955, 1.033) | 1.005 (.976, 1.035) | 1.005 (.961, 1.052) |
| Respiratory | 1.004 (.975, 1.034) | 1.02 (.957, 1.088) | .996 (.954, 1.040) | 1.035 (.954, 1.122) |
| TDB (L.7) | ||||
| Cardiorespiratory | 1.027 (.995, 1.060) | .964 (.871, 1.067) | 1.079 (1.017, 1.146) | 1.003 (.941, 1.070) |
| Cardiovascular | 1.036 (.998, 1.077) | .941 (.833, 1.064) | 1.011 (1.003, 1.193) | 1.004 (.932, 1.081) |
| Respiratory | 1.006 (.948, 1.068) | 1.022 (.843, 1.240) | 1.022 (.923, 1.131) | 1.009 (.884, 1.152) |
| VCA | ||||
| Cardiorespiratory | 1.000 (.984, 1.016) | .995 (.957, 1.034) | .991 (.968, 1.015) | 1.028 (.986, 1.071) |
| Cardiovascular | .996 (.978, 1.015) | 1.006 (.962, 1.052) | .974 (.945, 1.004) | 1.013 (.966, 1.061) |
| Respiratory | 1.012 (.980, 1.045) | .965 (.901, 1.032) | 1.031 (.983, 1.083) | 1.089 (.999, 1.188) |
| VCA (L.7) | ||||
| Cardiorespiratory | 1.009 (.978, 1.042) | 1.044 (.943, 1.57) | .999 (.932, 1.071) | 1.042 (.977, 1.112) |
| Cardiovascular | 1.012 (.976, 1.050) | 1.089 (.966, 1.227) | .998 (.923, 1.078) | 1.024 (1.007, 1.092) |
| Respiratory | .999 (.936, 1.066) | .957 (.819, 1.118) | .973 (.854, 1.108) | 1.112 (.969, 1.277) |
| XOC | ||||
| Cardiorespiratory | 1.029 (1.001, 1.049) | 1.060 (1.031, 1.123) | 1.006 (.976, 1.037) | 1.064 (1.017, 1.113) |
| Cardiovascular | 1.023 (1.000, 1.046) | 1.055 (1.013, 1.099) | 1.000 (.966, 1.036) | 1.041 (.987, 1.097) |
| Respiratory | 1.040 (1.004, 1.079) | 1.010 (1.004, 1.200) | 1.012 (.958, 1.070) | 1.033 (1.004, 1.087) |
| XOC (L.7) | ||||
| Cardiorespiratory | 1.042 (1.004, 1.082) | 1.012 (.931, 1.100) | 1.059 (.988, 1.137) | 1.026 (1.044 1.215) |
| Cardiovascular | 1.049 (1.004, 1.095) | 1.004 (.912, 1.106) | 1.025 (.952, 1.104) | 1.046 (1005, 1.111) |
| Respiratory | 1.023 (.951, 1.100) | 1.042 (.879, 1.234) | 1.099 (.975, 1.238). | 1.056 (.904, 1.234) |
*100 × (aRR - 1) measures the percent increase in mortality per 10 µg m-3 increase of exposure to PM10.
aRR: adjusted relative-risk ratios; CI: confidence interval.
Numbers in bold represent statistically significant increase in relative risk due to 10 µg m-3 increase in PM10 exposure.
With respect to estimates of findings relative to non-lagged models across the various seasons, during the warm season the IZT and XOC municipalities experienced an increased risk of mortality resulting from cardiorespiratory and cardiovascular outcomes with a 10 µg m-3 increase of PM10. Additionally, in the same season, the XOC municipality exhibited an increased risk of mortality in terms of respiratory outcomes with a 10 µg m-3 increase of PM10. During the cold season, the AOB municipality exhibited an increased risk of mortality from cardiovascular outcomes with a 10 µg m-3 increase of PM10. In the same season, the AOB and IZT municipalities exhibited an increased risk of mortality due to cardiorespiratory and respiratory outcomes with a 10 µg m-3 increase of PM10. As for the rainy season, the IZT, CDB, and XOC municipalities exhibited increased risk of mortality in terms of cardiorespiratory outcomes with a 10 µg m-3 increase of PM10. In terms of mortality as a result of respiratory problems, the AOB, CDB, and XOC municipalities exhibited increased risk of mortality with a 10 µg m-3 increase of PM10.
Regarding the seven-days lagged distributed models, we first derived the optimal numbers of lags for pollutants, as well as temperature variables, by minimizing the final prediction error, the Hannan and Quinn information criterion, and the Akaike information criterion (a Bayesian information criterion). We then applied all the lagged variables into our models simultaneously. In terms of overall mortality resulting from cardiorespiratory complications, the IZT, AOB, ECA, and XOC municipalities exhibited an increased risk of mortality with a 10 µg m-3 increase of PM10. Similarly, the IZT, AOB, and ECA municipalities exhibited an increased risk of mortality resulting from respiratory incidences with a 110 µg m-3 increase of PM10. In terms of mortality resulting from cardiovascular events, the ECA and XOC municipalities exhibited an increased risk of mortality with a 10 µg m-3 increase of PM10.
When assessing mortality during the warm season with the distributed lagged models, the IZT municipality exhibited an increased risk of mortality in terms of cardiorespiratory and cardiovascular events with a 10 µg m-3 increase of PM10. During the cold season, TDB exhibited an increased risk of mortality in terms of cardiorespiratory and cardiovascular events with a 10 µg m-3 increase of PM10. During the rainy season, the CDB and XOC municipalities exhibited an increased risk of mortality resulting from cardiorespiratory events with a 10 µg m-3 increase of PM10, while the VCA and XOC municipalities exhibited an increased risk of mortality due to cardiovascular events with the same increase of PM10. During the same season, the CDB municipality exhibited an increased risk of mortality resulting from respiratory events with a 10 µg m-3 increase of PM10.
We assessed thresholds for the amount of PM10 that results in mortality. As displayed in Figure 5a-c, it appears that in five of the seven municipalities a 150-155 µg m-3 threshold is established, which is the suggested turning point from a safe level to an unhealthy situation for sensitive groups identified by the WHO (PM10 with a concentration of 155 µg m-3, i.e., air quality index of 101, is identified as a “red category”, which implies an unhealthy situation for sensitive groups; see www.airnow.gov/index.cfm?action=airnow.calculator for more information). It is essential to note that geographic variability exists in terms of results. Overall, municipalities located to the south of the MCMA (i.e., IZT, XOC, and AOB) experienced statistically significant mortality results regarding all three outcome measures in non-lagged models. When lagged, the IZT and AOB municipalities did not exhibit a significant result for mortality due to cardiovascular events, whereas mortality due to respiratory complications was not significant in the XOC municipality. The AOB municipality exhibited a statistically significant increased risk of mortality during the cold season for all health outcomes of interest within models that were not lagged. Municipalities located to the northeast of the MCMA (i.e., CDB and ECA), exhibited statistically significant increased mortality risk from respiratory events within models that were not lagged, whilst CDB exhibited a statistically significant increased risk of mortality during the rainy season for cardiorespiratory and respiratory events both in lagged and non-lagged models. On the other hand, ECA exhibited an increased risk of mortality within the lagged and non-lagged models for cardiorespiratory and respiratory events. The TDB municipality, to the northwest of the MCMA, exhibited increased risk of mortality both for cardiorespiratory and cardiovascular events in the cold season within lagged models. Lastly, the VCA municipality, located in the center of the MCMA, exhibited an increased risk of mortality during the rainy season due to cardiovascular events in lagged models.
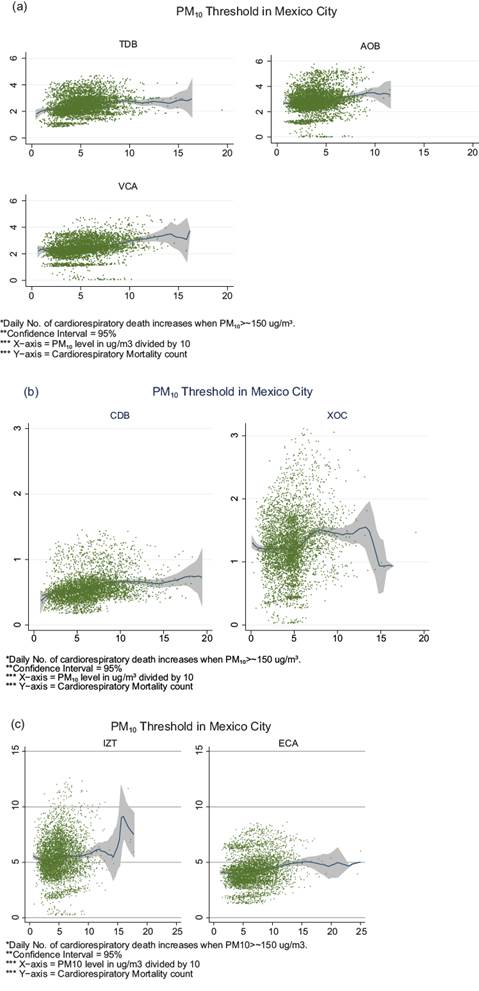
Fig. 5 Semiparametric Poisson regressions results showing a threshold of ~150 µg m-3 in seven municipalities of the MCMA. (a) Tlalnepantla de Baz (TDB), Álvaro Obregón (AOB) and Venustiano Carranza (VCA); (b) Coacalco de Berriozábal (CDB) and Xochimilco (XOC); (c) Iztapalapa (IZT) and Ecatepec (ECA).
10. Discussion
In this paper, we explored the impact of air pollution, temperature, and seasonality on shaping mortality risks among the population of seven municipalities in the MCMA (2001-2013) through a quantitatively driven approach. We deployed semiparametric Poisson regression models, taking into consideration exogenous impacts (i.e., other pollutants) along with temperature variability, seasonality, and air pollution in the form of PM10. To address the limitations of previously published studies, we conducted a time-series approach that incorporated natural cubic splines for temperature. Thus, we were able to evaluate short-term health effects (e.g., mortality) of air pollution.
Our findings demonstrate that capturing differences across seasons is essential when evaluating the effect of an increased level of PM10 in terms of mortality events resulting from all three health outcomes (cardiorespiratory, respiratory, and cardiovascular) assessed within the study. While these results varied between municipalities, it is safe to conclude that there is an association between mortality events and increased levels of PM10. This discrepancy can stem from differences in the composition of PM10 in different municipalities (and perhaps across seasons) (Schlesinger, 2007). Since PM10 includes PM2.5 and even low-concentration PM2.5 exposure is linked to mortality (Shi et al., 2016), the different results that we find across different municipalities may be due to variation in the proportion of PM2.5 in PM10.
Furthermore, our findings highlight the importance of considering distributed lagged models for capturing associations between mortality and air pollution. For example, in the TDB municipality during the cold season, premature mortality due to cardiorespiratory and cardiovascular events is only significant when we control for the level of PM10 exposure in the last seven days (lagged model). We observed a similar pattern in other municipalities during different seasons (e.g., VCA).
We were able to evaluate a threshold for changes in mortality resulting from increased levels of PM10, in which we can visually demonstrate a threshold that has been previously identified by the WHO. Complementing these analyses, we furthermore were able to demonstrate a geographic variability in terms of municipality locations, mortality risk, and increased levels of PM10. It should be noted that we cannot confidently conclude the threshold of 150 PM10 is standard across all the municipalities; however, we can confidently conclude that even smaller amounts of PM10 can be associated with mortality. The AOB municipality provides a perfect example of this relationship between PM10 and mortality. As it can be seen from the results, the IZT, AOB, and XOC municipalities have similar and consistent results, which may be driven by their geographical location in the southern portion of the MCMA.
Furthermore, a negative binomial model was developed in order to check the Poisson model. There was a negligible change in the results using the alternative model. In order to compare feasible scenarios, we performed a sensitivity analysis to test PM10 coefficients. We utilized different types of spline functions and also altered the degrees of freedom in each function. The magnitude of coefficients of interest did not change when utilizing different types of spline functions, such as bspline, mkspline, and frencurv for smoothing the existent trend. Although magnitudes did not change in general, they did change with the varying degrees of freedom approaches. In order to test the model’s sensitivity to outliers, we removed the highest 5% of PM10 values and repeated the regressions. This did not markedly alter either the magnitude of the effect or the statistical significance of PM10. Deviance residuals and partial autocorrelation plots were checked in order to test each model.
While we are confident in our findings, there are noteworthy limitations. First, we did not have complete data (especially on PM2.5) and relied upon reporting systems that could include information bias. Second, we could not extrapolate that our findings were representative of the entire MCMA. Unfortunately, our data were limited to seven municipalities within the metropolitan, thus we cannot assure these seven municipalities are the most representative. Also, if findings were consistent across municipalities and across models with/without distributed lagged effects, we would be able to more confidently conclude that they are representative of the entire MCMA.
Finally, studies have demonstrated reporting errors in terms of mortality data, and even though we are confident in the mortality data, we cannot preclude that such reporting errors were not made before it was used within the current study. In developing countries, limitations resulting from resources contribute to the uneven distribution of sites utilized to capture air pollution data. Thus, geographic variability could additionally introduce bias within our results, although it should be noted that we attempted to redress these issues in our sophisticated modeling approach.
In the light of these limitations, we are still confident that results within the current study can be utilized to inform policy in terms of air pollution in the MCMA. A significant contribution of this paper is the process of imputing the necessary data to assess the association between air pollution and premature mortality in the MCMA. Another substantial contribution is our focus in explaining mortality differences related to various meteorological seasons, which has been a limitation in previous works assessing the effects of air pollution on mortality in the MCMA. Focusing directly on the MCMA allowed us to assess mortality in terms of air pollution within a developing nation. Thus, the current study contributes to much-needed literature assessing the contribution of air pollutions to mortality within developing countries. For further information on modeling and sensitivity analysis, please see the supplementary material.
As for the area of future research, one could update the results by including the most recent dataset and control for long term or chronic morbidity impact of PM pollution. Given that demand for environmental quality is expected to be lower in the context of a developing country, the chronic health impacts might be more substantial and significant for policy-making purposes, thus they need to be explored in future research. Rather than averaging over the entire population, one could divide the population into groups of individuals (e.g., elderly, pregnant women, and infants) and compare data. Further, one could extend the dose-response estimates with a valuation component based on the value of statistical life literature. Lastly, one could utilize the results of the current research and conduct a discrete choice experiment study (Mamkhezri, 2019; Mamkhezri et al., 2020a, b) to assess thr respondents’ willingness to pay for clean air in the MCMA.

