


 nueva página del texto (beta)
 Inglés (pdf)
 Artículo en XML
 Referencias del artículo
 Enviar artículo por email
 Citado por SciELO
  Similares en
SciELO
Similares en
SciELO 
 Permalink
1. Introduction
The distribution of urbanization in Thailand is unbalanced. The rapid growth of urban areas has created high population densities in large cities. The number of new vehicles registered in Thailand has increased around three times from 2000 to 2011 (DLT, 2014). Traffic emissions are recognized as the major source of air pollution in cities (Jinsart et al., 2002; Zhang and Batterman, 2013). Previous studies have shown that the populations of several cities of Thailand are exposed to high levels of particulate matter (PM) such as PM10 and PM2.5 (PM with an aerodynamic diameter less than 10 and 2.5 μm, respectively). These levels often exceed the National Ambient Air Quality Standards (NAAQS) of Thailand (Guo et al., 2014). Several other studies have demonstrated that PM in Thailand is associated with respiratory problems and a wide range of premature mortality causes (Vichit-Vadakan and Vajanapoom, 2011; Qiu et al., 2015). Fine particles are more dangerous than coarse particles. Apart from the size of the particles, other specific physical, chemical, and biological characteristics that can produce harmful health effects include the presence of metals, polycyclic aromatic hydrocarbons (PAHs), and other organic components (Vichit-Vadakan and Vajanapoom, 2011).
Exposure to PM occurs mainly indoors because people spend most of their time inside buildings, especially in their homes (Massey et al., 2013; Du et al., 2011; Yang Razali et al., 2015). Effects of inhaled aerosols depend on the specific chemical species, the concentration, the duration of exposure, and the site of deposition within the respiratory tract (Salma et al., 2002). Particle size is the most important factor determining the location of the deposited particles as well as the mechanism of deposition (Salma et al., 2002; Braniš et al., 2005). In general, airborne fine particles have been considered of greater health significance than other major air pollutants. The heavy metals associated with fine particles have been shown to increase lung cancer and cardiopulmonary injuries in humans (Park et al., 2008). Fine particles carry a higher burden of toxic metals than coarse particles (Shridhar et al., 2010; Massey et al., 2013).
Many studies indicate that indoor air quality is affected by outdoor air intrusion into the indoor environment (Jones et al., 2000; Kuo and Shen, 2010; Leung, 2015; Tunsaringkarn et al., 2015). Outdoor air pollutants can enter buildings through open doors, open windows, ventilation systems, and cracks in structures. Ventilation has a strong influence on indoor PM concentration, but this may also vary due to the difference in the physical nature of pollutants and their source characteristics (Leung, 2015). Several studies have shown a relationship between indoor and ambient air (Jamriska et al., 1999; Jones et al., 2000; Cyrys et al., 2004). In urban areas, high density residential zones and high traffic volume influence the concentration of air pollutants in indoor environment (Agrawal et al., 2003; Massey et al., 2012).
The measurement of indoor PM and its relation to toxicity are essential in order to determine the exposure risk of inhabitants. Thus, the aim of this study was to measure indoor and outdoor PM10 concentrations and their chemical composition in roadside residential buildings of Phitsanulok, a rapidly growing province in lower northern Thailand. This is a pioneering investigation on the probable sources of trace metals in this area and the health risks associated with them. The data is expected to provide valuable information for future mitigation and sustainable urban planning.
2. Methodology
2.1 Sampling site
The Phitsanulok province (16° 50' N, 100° 15' E) (Fig. 1) covers an area of about 10 816 km2 and it encompasses a large city located in the lower north territory of Thailand, with a population of 854 000. Phitsanulok was chosen for this study because it is a rapidly developing area due to the east-west economic corridor linking Thailand with Myanmar, Laos and Vietnam (ADB, 2010). The climate of Phitsanulok is under the influence of monsoon winds of seasonal character. The south-west monsoon (May-October) brings a stream of warm moist air from the Indian Ocean causing abundant rain over the country with temperatures ranging from 23 to 39 °C and relative humidity from 35 to 100%. The northeast monsoon (October-February) brings cold and dry air from anticyclonic conditions on the Chinese mainland with temperatures ranging from 14 to 38 °C and relative humidity from 27 to 98% (TMD, 2014).

Five residential buildings (sites 1-5 in Fig. 1) near the Asian Highway 16 (AH16) and another five (site 6-10 in Fig. 1) near the Asian Highway 13 (AH13) in the municipality of Phitsanulok were chosen as sampling sites. The sampling was conducted from January to June 2014. The houses varied in age from five to 30 years to provide a variable sample of typical indoor and outdoor concentrations. The houses are made of bricks and cement.
2.2 Sample collection
Portable air samplers (MiniVol(tm) TAS 5.0, Airmet-rics, USA) were used for monitoring the indoor and outdoor mass concentration of PM10 at a constant flow rate of 5 L min-1 ± 5% with a controller for continuous measurement during the 8-h simultaneous sampling period (8.00-16.00 LT). The flow rate calibration measurements were performed using a mass flow calibrator during equipment placement and removal activities. The particles were collected on a 47-mm quartz filter paper for chemical analysis. Before and after sampling, the filters were stored in desiccators for 24 h prior to an initial weighing in a clean room under controlled temperature and relative humidity conditions. The indoor sampling instrument was placed at a height of 1.5 m and at locations in the house where the occupants spend most of their time. Inlet heads were positioned as close as possible to head height, in the breathing zone. Outdoor sampling was undertaken 1.5 m away from the boundary of the houses. The device was placed at a height of 1.5 m from the ground. A total of 120 samples were collected from ten houses per month, 60 from the indoor environment and 60 from the outdoor environment of each house on different dates over a six-month period (January to June, 2014). The average mass concentration of PM10 was calculated by the gravimetric method. After collecting, the filters were refrigerated at about 4 °C prior to chemical analysis.
2.3 Analytical procedure
The samples were digested in a mixture of pure concentrated acids (HNO3 and HClO4 in a 4:1 ratio) and diluted with deionized water up to 25 ml, then filtered through a 0.45 μm Millipore filter paper to obtain a clear solution in pre-cleaned volumetric flasks and stored at 4 °C prior to analysis. The chemical compounds of the PM samples were determined via inductively coupled plasma optical emission spectrometry (ICP-OES) (JY 238, Horiba, Japan). All PM samples were analyzed for the following seven elements: Zn, Fe, Pb, Cd, Ni, Cu and Cr.
The limit of detection (LOD) for each of the metals was determined by measuring the signal to noise ratio. The LOD for Zn, Pb, and Fe was 0.10 ng m-3; for Cd and Cr, 0.03 ng m-3; for Ni, 0.13 ng m-3, and for Cu, 0.07 ng m-3. Percentage recoveries of the metals using acid digestion ranged between 98 and 117%. The blank filter sampler was monitored using unexposed filter papers which were processed with field samples. Background contamination of heavy metals was determined by subtracting the field blank values from the concentrations. In this study, the background contamination was used to correct measurements.
2.4 Risk assessment from carcinogenic metals
Excess cancer risks (ECRs) were calculated using the unit risk and the PM-bound concentration of the metals, which can be used to represent their total concentration (Park et al., 2008). The information of carcinogenic types and unit risks of the metals is available from the US-EPA database for IRIS (Integrated Risk Information System). We assumed that a breathing rate for 8-h occupational exposure = 10 m3, and a breathing rate for 24-h continuous exposure = 20 m3 (occupational exposure = 5 days/week; continuous exposure = 7 days/week) (US-EPA, 1998). The typical method for calculating ECRs is by using the following formula (US-EPA, 1998):
2.5 Statistical analyses
Analysis of the experimental data was performed using the Statistical Package for Social Sciences (SPSS v. 11.5, IBM, USA). Descriptive statistics, including the mean concentrations of PM10 and standard deviations, were used to investigate the elemental concentrations of the PM10 samples. Pearson correlations were conducted to evaluate the relationship of the indoor and outdoor PM10 and its metal concentrations.
3. Results and discussion
3.1 PM mass concentrations
The average monthly PM10 concentration and standard deviations obtained in the residential buildings are presented in Table I. The PM10 mass in indoor and outdoor samples ranged from 71.9 to 105.3 μg m-3 and 95.6 to 145.1 μg m-3 for AH16, and from 41.5 to 65.5 μg m-3 and 95.2 to 105.6 μg m-3 for AH13, respectively. The trends of PM10 concentrations were higher in outdoor samples compared to indoor samples. Overall, the houses at AH16, a six-lane highway, showed higher average monthly PM10 concentrations compared to those at AH13 (a four-lane highway), except for the outdoor PM10 concentration in May. There are significant differences in PM10 concentrations recorded at the different sampling sites (p < 0.05). However, statistical analysis performed with the t-test shown no significant difference (p > 0.05) between the mean concentrations of indoor and outdoor PM10 in the five houses located on each road site, indicating that similar sources lead to the generation of particulate pollutants in these environments (Massey et al., 2013).
The results indicate that PM10 in indoor and outdoor environments is mainly affected by particle emissions from the roadside area. Traffic volume can increase in the wider highway (AH16), so it is expected to contribute to higher concentrations of PM10 inside and outside roadside buildings due to high traffic density and congestion in this area. The higher PM10 concentrations at the sampling sites may be emitted by vehicles, depending on the locations and prevailing winds. Generally, the contribution from cross-border sources is less significant in urban areas due to the increased distance from the pollution sources (Cheng et al., 2009). However, urban air quality is highly affected by city design. Densely distributed buildings, deep street canyons, and buildings with high ratios of height to road width, can block and weaken the approaching wind, thus reducing air dispersion (Cheng et al., 2009; Li et al., 2009).
As there is no indoor air quality standard for public buildings in Thailand, we compared our results with the indoor air quality standards of other Asian countries. The concentrations of indoor PM10 presented in this study were below the guideline for Singapore (150 μg m-3 for 8-h averaging time) (NEA, 1996). The PM10 concentrations recorded in this study are classified as good according to the Indoor Air Quality Objectives for Offices and Public Places in Hong Kong (180 μg m-3 for 8-h averaging time) but exceeded the excellence class value at 20 μg m-3 (EPD, 2003).
3.2 Seasonal variation of PM 10
In this study, the seasonal variation was divided into two seasons: dry (January-March) and wet (April-June) based on the regional meteorological conditions from the Thai Meteorological Department (TMD, 2014). Fig. 2 shows the average seasonal concentrations of PM10 in indoor and outdoor environments of the AH16 and AH13 sites. The mean variations of PM10 at the AH16 and AH13 sites show similar seasonal trends. In the dry season, the mean concentrations of PM10 in indoor and outdoor environments at AH16 were 89.0 and 131.4 μg m-3, respectively. For AH13, the average PM10 concentrations were 49.2 and 102.6 μg m-3. In the wet season, the mean concentrations of PM10 in indoor and outdoor environments at AH16 were 87.5 μg m-3 and 115.5 μg m-3, respectively. For AH13, the average PM10 concentrations were 60.7 μg m-3 and 99.1 μg m-3, respectively. The overall seasonal trends showed significantly higher PM10 concentrations in the dry season in comparison to the wet season (p < 0.05), except for indoor PM10 at AH13. Lower PM10 concentrations were obtained in the wet season due to the washout of particles in the atmosphere (Saha and Krishna Moorthy, 2004). The higher PM10 concentrations were recorded at the AH16 site, indicating outdoor particulate levels have an impact on the indoor environment via infiltration. Similar results were reported by Chao and Wong (2002). The average indoor PM10 concentrations in homes near a minor road in Hong Kong were higher than those of the homes far away from the traffic, while they were higher for the homes near a main road than for homes near a minor road. High indoor PM concentrations were observed in homes close to heavy traffic. This indicates that high outdoor PM concentrations originating from vehicle and industrial exhaust, as well as wind-blown dust pose a great impact on indoor PM concentrations (Chao and Wong, 2002).
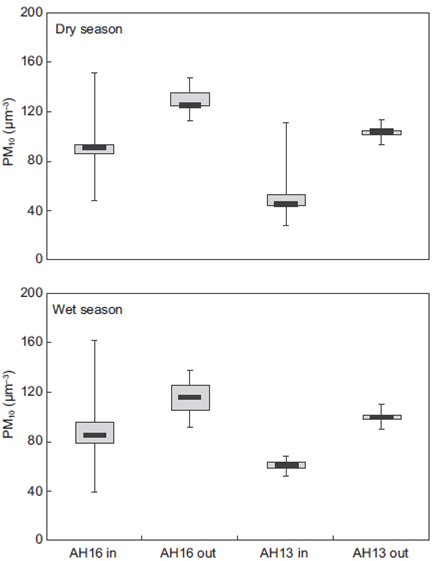
Fig. 2 Seasonal variation of PM10 in indoor and outdoor environments. The first quartile (Q1 or 25th percentile) is the median of the lower half of the data set. The third quartile (Q3 or 75th percentile) is the median of the upper half of the data set.
Comparing this study with the results from other Asian countries, it was found that the average indoor and outdoor PM10 concentrations of households in rural areas of India were 242.5 and 217.76 μg m-3 (Massey et al., 2013). Massey et al. (2012) also found that annual average concentrations of PM10 in indoor and outdoor environments in Agra, India were 247 and 255 μg m-3 in roadside houses, and 181 and 195 μg m-3 in urban houses. A study in homes of Delhi, India reported that the average indoor and outdoor PM10 concentrations ranged from 104 to 506 μg m-3 and from 100 to 598 μg m-3, respectively (Kulshreshtha and Khare, 2011). The results from India are about 2-3 times higher than those from this study. Chao and Wong (2002) reported that the mean indoor and outdoor PM10 concentrations in houses in Hong Kong were found to be 63.3 and 69.5 μg m-3, respectively, which are about 1-2 times lower than in this study.
3.3 Indoor/outdoor ratios (I/O)
The indoor/outdoor ratio (I/O) has been widely used for evaluating the difference between indoor and outdoor concentrations as an indicator of indoor sources strength (Kulshreshtha and Khare, 2011). Indoor air pollutant concentrations are affected by the infiltration of outdoor pollutants into the homes and by pollutants from indoor sources. Therefore, the I/O ratios of PM10 were calculated to quantify the impact of outdoor air and indoor sources on indoor air quality. The I/O ratio is defined as the ratio Cin/Cout where Cin and Cout are the indoor and outdoor concentrations of PM, respectively (Chen and Zhao, 2011). The I/O ratio can vary largely due to factors such as location, building design and different activities of the occupants (Massey et al., 2012).
The I/O ratios of PM10 were presented in Table I. They ranged from 0.6 to 0.8 and from 0.4 to 0.6 for AH16 and AH13, respectively. The I/O ratios of all the sampling sites were less than one, indicating that the PM originated from vehicle induced emissions from the nearby congested roads, which directly enter the indoor environment of homes increasing their concentration levels (Oosterlee et al., 1996). Pathways of outdoor air pollutants to the indoor environment depend on ventilation and infiltration. The ventilation of a dwelling by fan or air conditioner, or by individual or central air conditioning systems, draw in air from outdoors through fresh air intakes (Leung, 2015). The prevailing wind provides natural ventilation whenever the doors and windows are open. Infiltration can also occur through cracks and leaks in the building, which may be significant for a building with poor sealing (Leung, 2015). Due to these mechanisms, air pollutants from outdoors can penetrate into the indoor environment, and can either be diluted or accumulated according to the ventilation condition (Leung, 2015).
3.4 Trace elemental concentrations and enrichment
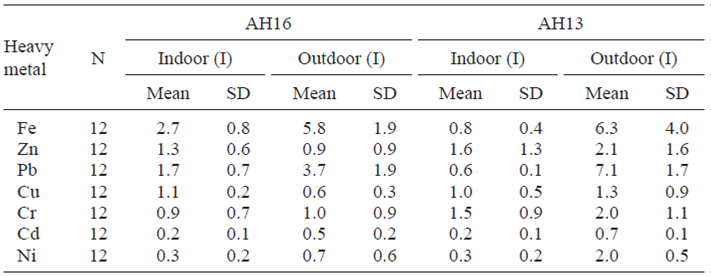
The chemical elemental concentrations associated with indoor and outdoor PM10 are given in Table II. The results show the mean concentration of PM10 and the standard deviation of each metal at individual sites. No trend of monthly changes in metal concentrations was observed for individual metals. The overall trends of indoor and outdoor metal concentrations at AH16 were Fe > Pb > Zn > Cu > Cr > Ni > Cd and Fe > Pb > Cr > Zn > Ni > Cu > Cd, respectively. For AH13, the concentration trends of indoor and outdoor metal concentrations were Zn > Cr > Cu > Fe > Pb > Ni > Cd and Pb > Fe > Zn > Cr = Ni > Cu > Cd, respectively. Compared with other metals at AH16, Fe concentrations were the highest in both indoor and outdoor environments. In the present study, Pb concentrations were found to be higher outdoors, compared to the indoor environment. Higher Pb concentrations at the roadside on these sites may be due to the mixing of residual Pb in soil and its resuspension in the air due to motor vehicles and community activities such as outdoor painting, automobile repair shops, battery manufacturers and recycle shops (Srithawirat and Latif, 2015). Soils in older areas of the cities are highly contaminated by lead, largely due to past use of lead additives in gasoline, the use of lead in exterior paints, and industrial lead sources. Laidlaw et al. (2012) sustain that automotive traffic turbulence plays a significant role in the resuspension of contaminated roadside soils and dusts, and resuspended soil appears to be a significant underlying source of atmospheric Pb (Zahran et al., 2013).
Table II. Statistical analysis of trace metal concentrations in PM10 at roadside buildings (in μgm-3).
Mineral and stone materials used in road building may contain Cd, Cu, Fe, Ni, Pb and Zn, which are released to the environment as the road surface wears (Lindgren, 1996). After the prohibition of leaded gasoline in Thailand, lead-based paint could be considered a major exposure source of Pb in houses, as it is very commonly used in existing residences, such as on walls, toys and furniture (Lin et al., 2009). Fergusson and Marsh (1993) suggested that worn construction, furnishing and carpet materials can lead to elevated heavy metal content.
Sources of metals in aerosols are reported differently by different researchers. Lindgren (1996) reported that engine wear releases Cr, Cu, Mn, and Ni. Cr is derived from yellow paints in roads and alloys in automobiles (Madany et al., 1994); it is also emitted by municipal waste burning outdoors (Massey et al. , 2013). Zn in outdoor urban environments may be released from galvanized steel road equipment, such as crash barriers, road signs and lamp posts, as a corrosion product (Yuen et al., 2012). Rubber underlays, carpets, and galvanized iron roofing are considered as important sources of Zn in indoor environments (Kim and Fergusson, 1993).
The correlations between chemical elements found in indoor and outdoor environment are presented in Table III. The statistical analysis of data from indoor environments indicates that there are positive and negative correlations at the 99% confidence level. A strong positive correlation was found between Zn and Cu, Zn and Ni, and Cu and Ni in indoor environments (r = 0.858, 0.888 and 0.916). For outdoor environments, a strong correlation was observed between Zn and Cu, Zn and Ni, Pb and Cu, Cu and Ni, and Cd and Ni (r = 0.852, 0.783, 0.788, 0.831 and 0.961, respectively). The results indicate that these metals may originate from similar sources, such as automobile emissions, street dust and other related industrial activities.
Enrichment factors (EFs) were calculated to determine whether the PM originated from crustal or non-crustal sources. They were estimated for individual elements over the average elemental composition of the upper continental crust (Hernandez et al., 2003). Typically, the EF method normalizes the measured heavy metal content with respect to a sample reference metal such as Fe or Al (Ravichandran et al., 1995). The EFs of an atmospheric element were calculated using the following equation:
where x is the concentration of an element measured in the atmosphere and Cref is the concentration of the reference element. Fe was used in this study as a reference because it is a major constituent of clay minerals and has been successfully used by several researchers. Deely and Fergusson (1994) reported that Fe is an acceptable normalization element to be used in the calculation of the EF, since its distribution is unrelated to other heavy metals. The average element concentrations in soil were obtained from Taylor and McLennan (1985). EFs close to one point are considered to have a crustal origin, while it is assumed that those greater than 10 have a non-crustal source (Nolting et al., 1999). Further, EFs can also assist in the determination of the degree of metal contamination (Yongming et al., 2006). The contamination categories are recognised on the basis of the EF. EFs of more than five indicate that they are significantly enriched and contaminated (Yongming et al., 2006). For both roadside environments (AH16 and AH13), Zn, Cu, Pb, Cr and Ni in PM10 showed EFs of less than one which means that the metals analyzed in indoor particles have penetrated from outdoor sources (Kulshrestha et al., 2014). Only the enrichment of Cd was found to be greater than one at all sites, which may be due to indoor dust at these sites, associated with paint and related indoor activities.
3.5 Risk assessment from carcinogenic metals
Among the heavy metals in indoor and outdoor PM10 on the roadside residential areas of this study, Cr, Cd, Ni and Pb are known carcinogenic agents that can cause serious health risks when people are exposed through the inhalation pathway (US-EPA, 1998). According to the US-EPA classification of carcinogens, Cr (VI) is categorized in group A as a known human carcinogen by exposure through the inhalation route. A previous research has acknowledged that the measured total Cr concentration was assumed to be a mixture of carcinogenic (Cr [VI]) and non-carcinogenic (Cr [III]) agents in a 1:6 concentration ratio in ambient air (US-EPA, 2004). Mancuso (1997), forming the basis for the estimation of cancer potency for Cr compounds, suggests that in an urban area one-seventh of the total chromium concentrations is hexavalent (Cr [VI]). Therefore, in this study the concentration of Cr (VI) was assumed to be one-seventh of the total Cr concentration for the carcinogenic risk assessment (Park et al., 2008; Hieu and Lee, 2010; Massey et al., 2013;Taner et al., 2013). Cd is classified as a group B1 human carcinogen. Ni dust form refineries and nickel subsulfide are also known human carcinogens. The concentrations of PM10 analyzed in this study may contain nickel subsulfide, nickel oxide and metallic nickel, which are classified as group A carcinogens. Pb is a probable human carcinogen categorized in group B2, but the ECR for Pb was not calculated due to inadequate evidence on its carcinogenic effect on humans and to its unit risk currently being amended by the US-EPA.
The ECR of PM10-bound carcinogenic trace elements in the indoor and outdoor environments for the average values, as well as the 95th percentile values of Cd, Cr and Ni are presented in Table IV. The ECRs calculated for the average values of Cr (VI), Cd and Ni concentrate in indoor and outdoor PM10 were multiplied by 106 to compare the risks to a one in a million standard (US-EPA, 1998). Cr showed the highest ECR followed by Cd and Ni in indoor and outdoor environments, due to the much higher unit risk of Cr (VI), ranging from seven to 50 times compared to the unit risk of Cd or Ni. The total ECRs based on the average values of Cd, Cr (VI) and Ni in indoor and outdoor environments were 14 832 and 19 404, respectively. These results indicate that 14 832 and 19 404 people out of one million are at risk of developing cancer from exposure to the carcinogenic metals in the PM10 fraction of indoor and outdoor particulates in this area. The ECRs trend was found to be higher in outdoor than in indoor environments, indicating that the occupants' exposure to toxic heavy metals in outdoor areas results in an increased cancer risk in comparison to the indoor environment.
4. Conclusions
This study determined the concentrations of PM10 and their metal composition in indoor and outdoor environments at roadside residential locations in Phit-sanulok, Thailand. The results showed that the concentrations of PM10 ranged from 41.5 to 105.3 μg m-3, and from 95.2 to 145.1 μg m-3 for indoor and outdoor environment, respectively. The seasonal variation showed that PM10 levels were significantly higher in the dry season in comparison to the wet season (p < 0.05). Precipitation washout of PM10 concentrations in the atmosphere was considered a factor causing lower concentrations during the wet season. The trends of PM10 concentrations were higher in the outdoor environment in comparison to the indoor environment. The high density traffic and congestion was thought to contribute to the concentrations of PM10 in roadside buildings. The I/O ratios of all the sampling sites were less than one, indicating that PM originated from vehicle emissions, which enter the indoor environment by ventilation and infiltration. The average concentrations of PM10 in this study were found to be lower than the values set by the Singapore NEA and the Hong Kong Guidelines for Offices and Public Places. PM-bound heavy metals Zn, Fe, Pb, Cd, Ni, Cu and Cr were detected in PM10. Cr was found to have the highest carcinogenic risk among the trace metals in residential areas. This study suggests that there is a need to address the issue of fine particulate monitoring (i.e. particulate matter with diameter size below than 2.5 μm [PM25]) and its toxic effects should be comprehensively investigated, considering different locations as well as the pattern in resident's activities in order to design control and mitigation strategies.

