


Servicios Personalizados
Revista
Articulo
 Inglés (pdf)
 Artículo en XML
 Referencias del artículo
 Enviar artículo por email
Indicadores
-
 Citado por SciELO
 -
 Accesos
Links relacionados
-
 Similares en
SciELO
Similares en
SciELO
Compartir

 Permalink
Atmósfera
versión impresa ISSN 0187-6236
Atmósfera vol.19 no.4 Ciudad de México oct. 2006
Principal Component Analysis to study spatial variability of errors in
the INSAT derived quantitative precipitation estimates over
Indian monsoon region
S. K. ROY BHOWMIK and S. SEN ROY
India Meteorological Department
New Delhi–110003, India
Corresponding author: S. K. Roy Bhowmik; e–mail: skrb@imdmail.gov.in
Received September 18, 2005; accepted April 14, 2006
RESUMEN
En este trabajo se aplicó el Análisis de Componentes Principales para investigar la variabilidad espacial de los errores de las estimaciones cuantitativas de precipitación derivadas (QPE) del INSAT en la región monzónica de la India. Para esto, se utilizó el análisis diario de precipitación (a la misma resolución), durante el periodo del 1 de junio al 3 0 de agosto, correspondiente al monzón de verano de 2001. El estudio muestra que los errores QPE tienen cierta variabilidad espacial. La lluvia orográfica es subestimada a lo largo de los Ghats occidentales y las estribaciones de los Himalayas, en los que la raíz cuadrática media de los errores es también muy grande. Por otra parte, el desempeño de las QPE es razonablemente bueno en el resto de la región. El primer componente principal, que explica cerca del 5.1 % de la varianza, corresponde a la fase inicial del monzón. El segundo componente principal explica aproximadamente el 4.2 % de la varianza y tiene una fuerte carga positiva en la presencia intermitente, sobre las partes centrales del país, del sistema de baja presión del monzón. El tercer componente principal, que explica el 3.3 % de la varianza, se asocia con la vaguada del monzón en la posición normal, y el cuarto componente principal, que explica un 3.1 % de la varianza, se asocia con la vaguada del monzón en la posición sur.
ABSTRACT
In this paper, Principal Component Analysis has been applied to investigate the spatial variability of errors in the INSAT derived quantitative precipitation estimates (QPE) over the Indian monsoon region, using daily rainfall analysis (at the same resolution) for the period from 1 June to 30 August of summer monsoon 2001. The study shows that the QPE errors have certain spatial variability. The orographic rainfall is significantly underestimated along the Western Ghats and along the foothills of the Himalayas, where the root mean square errors are also very large. Otherwise, the performance of the QPE is reasonably good over the rest of the region. The first principal component, which explains about 5.1% of the variance, corresponds to the onset phase of the monsoon during June, when strong positive loadings dominate over the southern parts of the country. The second principal component explaining about 4.2% of the variance, has strong positive loading in the intermittent presence of the monsoon low pressure system over the east central parts of the country. The third principal component which explains 3.3% of the variance is associated with the monsoon trough at the normal position, and the fourth principal component which explains 3.1% of the variance is associated with the monsoon trough at the southern position.
Keywords: Principal Component Analysis, quantitative precipitation estimates, Indian monsoon.
1. Introduction
The technique of Principal Component Analysis (PCA) has been widely used in meteorology and climatology during the last two decades with the aim of detecting elementary features of physical phenomena by simplifying huge data sets. This is especially significant in the context of precipitation to understand its spatial and temporal variability over a particular region (Bedi and Bindra, 1980; Mazumdar, 1998; Krishnamurti and Shukla, 2000). The tool, which is one of the most effective methods for isolating various modes into uncorrelated components, has not been applied to understand the systematic errors of the Indian Geostationary Satellite (INSAT) derived Quantitative Precipitation Estimates (QPE).
In the present study the Spatial mode (S–mode) of PCA has been applied to understand the spatial variability of INSAT derived QPE over the Indian monsoon region. Since the QPE at each grid point is not independent of its value at other neighboring grid points, the corresponding error in the QPE is also dependent on the errors of surrounding grid points. Hence the method of principal components is appropriate to investigate the independent modes of error of a region.
2. Data sources
Despite the great demand of high quality precipitation data sets from both meteorological and hydrological communities, accurate quantification of regional rainfall pattern remains incomplete. This is due to the large spatial and temporal variability in rainfall and the lack of a comprehensive observing system. The major existing source of large scale rainfall data includes gauge observations and estimates inferred from the satellite observations, and each of these data sets has advantages and disadvantages.
Rain gauge gives relatively accurate point measurement of rainfall, but observations are not available over most unpopulated land areas and over oceanic areas. Another problem with the land rain gauge observations is the sampling error if the network is not adequately dense.
Satellite observations of infrared (IR) and microwave radiance have been used successfully to retrieve precipitation information over many parts of the globe. But the accuracy of the product is limited (Xie and Arkin, 1996) due to the indirect relationship of the cloud top temperature and precipitation. Because of this consideration, Janowiak (1992) made an inter–comparison of the Geostationary Operational Environmental Satellite (GOES) data for the global tropics, with reference to short range precipitation forecast of the National Centre for Environmental Prediction (NCEP) and the European Centre for Medium Range Weather Forecasting (ECMWF) model, and for Japan, with reference to ground observations. A similar study for the Australia region was made by Ebert and Marshall (1995). Arkin et al. (1989) examined the performance of INSAT derived precipitation estimates over the Indian region for the southwest monsoon season of 1986 utilizing subdivisional monthly mean rainfall. In a recent study, Roy Bhowmik and Sud (2003) examined the performance of INSAT derived QPE with reference to land rain gauge observations for varying synoptic situations. The verification was carried out based on areal average rainfall at the resolution of 5° × 5° lat./long. As the rainfall has large spatial and temporal variability, and there are high quality gridded rainfall data from daily observations from a high dense rain gauge network, the study warrants, for further investigations, quantification of systematic errors of these estimates.
There are various key factors like topography, prevailing synoptic situation and its interactions with mesoscale systems, lack of rainfall observed data, etc., which posses difficulties in analyzing rainfall for any region and so Indian monsoon region is not an exemption. A very recent study of Roy Bhowmik et al. (2005) showed that daily rainfall analysis (gridded data) generated at the resolution of 1° × 1° lat./long. over the India region, using high dense land rainfall observations, has the potential to capture synoptic scale as well as mesoscale structure of the monsoon precipitation system. Availability of this high quality gridded data set has motivated the authors to examine the performance of INSAT derived precipitation estimates (generated at the same resolution of 1° × 1° lat./long.) over the Indian region during monsoon 2001.
There are 576 synoptic stations all over India, from which real time rainfall observations are available on an operational basis. For the optimum data coverage, in the present study about 1330 daily raingauge observations received from synoptic, as well as District–wise Rainfall Monitoring Scheme (DRMS) network of India Meteorological Department (IMD), are utilized to generate daily rainfall analysis over the Indian land areas. The objective analysis is based on the scheme described by Thiebaux and Pedder (1987).
QPE from the INSAT are derived at the grid resolution of 1° X 1° lat./long. following the algorithm described by Arkin et. al. (1989). The approach is identical with one used to obtain such estimates for GOES (Arkin and Meisgner, 1987). According to this algorithm the rainfall estimates are given by:
R = 3 × f × h
where R is areal rainfall estimates in mm,f is the fraction of IR pixels with temperature less than 235° K and total number of pixels within the square grid, and h is time in hours. The constant rain–rate of 3 mm/h provides the best correlation of the regression relation (Richard and Arkin, 1981).
PCA has been applied to investigate the spatial pattern of errors (QPE–analysis) in the INSAT derived precipitation estimates over the Indian monsoon region from the use of daily rainfall analysis (at the same resolution) for the period from 1 June to 30 August of summer monsoon 2001.
3. Principal component analysis
Principal Components Analysis is a multivariate procedure which rotates the data such that maximum variabilities are projected onto the axes. Essentially, a set of correlated variables are transformed into a set of uncorrelated variables which are ordered by reducing variability. The uncorrelated variables are linear combinations of the original variables, and the last of these variables can be removed with minimum loss of real data. The main use of PCA is to reduce the dimensionality of a data set while retaining as much information as possible. It computes a compact and optimal description of the data set. The first principal component is the combination of variables that explains the greatest amount of variation. The second principal component defines the next largest amount of variation and is independent to the first principal component. There can be as many possible principal components as there are variables. It can be viewed as a rotation of the existing axes to new positions in the space defined by the original variables. In this new rotation, there will be no correlation between the new variables defined by the rotation. The first new variable contains the maximum amount of variation, the second new variable contains the maximum amount of variation unexplained by the first and orthogonal to the first, etc.
PCA is often used as a pattern recognition technique. The procedure involves constructing a correlation operator for the grid point errors in rainfall estimation over time. The domain selected for this study covers only the land areas over the domain from equator to lat. 40° N and long. 60° E to 100° E. The daily errors (QPE–analysis) for each grid are computed using these two compatible data sets. In order to investigate the spatial significance of the error, a correlation matrix C(xi, xj) of the errors for each grid point is constructed that contains the spatial relationship of the errors over time. This matrix C(xi, xj) is decomposed into its eigenvalues and eigenvectors in two parts. The first employs the trireduction technique to reduce the matrix C(xi, xj) to a symmetric tridiagonal matrix (Martin et al., 1968). The second part employs an algorithm to find the eigenvalues λj and eigenvectors ej of the tridiagonal matrix. These eigen vectors are orthonormal basis vectors arranged in order of decreasing variance that reflect the spatial relationship of events in time. If one divides the corresponding eigen values, by the sum of the eigen values, the result is that percentage of the variance explained by that particular mode. The actual program for computation of the principal components is based on the program http://astro.u-strasbg.fr/~fmurtagh/mda-sw/pca.f.
4. Climatological features of the Indian summer monsoon
The climatological features of the Indian summer monsoon are described based on the studies of Rao (1976). The seasonal (summer monsoon) rainfall pattern over India shows that large values of rainfall occur along the west coast and over the northeast India, where blocking effects of topography induce upward vertical velocity and enhance precipitation in the windward side and suppress precipitation in the lee side. The rain shadow due to Western Ghats (west coast) spreads over a large area over the peninsular India. The subdivisions in northwest and southeast get the least amount of rainfall. The local scale features and passage of synoptic scale monsoon systems further modify this gross picture.
Monsoon rainfall is dominated by meso–scale β type disturbances such as orographic heavy rainfall along the west coast (Western Ghats) of India and synoptically induced mesoscale systems during the passage of monsoon low pressure systems. Monsoon low pressure system is the main rain producing system of summer monsoon over Indian region, it forms over the northwest Bay of Bengal and moves northwestwards across the country giving rise to heavy to very heavy falls during its passage. Along the west coast of India heavy rainfall occasionally occurs in association with offshore troughs. In some occasions the offshore trough becomes so well marked that offshore vortex also could be located. Monsoon trough is another important rain producing system which occasionally causes heavy rainfall over most parts of the country.
5. Results and discussion
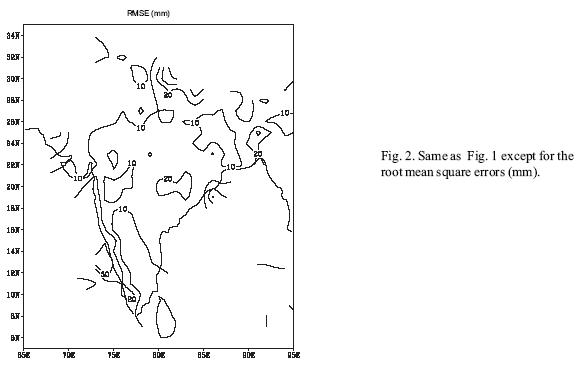
The spatial distribution of means and the root mean square errors of QPE errors for the entire data period are shown in figures 1 and 2. The mean error shows that the orographic rainfall along the Western Ghats and along the foothills of Himalayas are significantly underestimated (by 15–30 mm). However, the rainfall over east central parts of the country and over the domain of eastern parts of the monsoon trough are overestimated (5 mm). The day to day variation of the error of the QPE as quantified by the root mean square errors (RMSE) ranges between 20–30 mm in some pockets along the west coast, over the domain of eastern parts of the monsoon trough and along the foothills of Himalayas. Otherwise, the RMSE remains within 10 mm over the region.
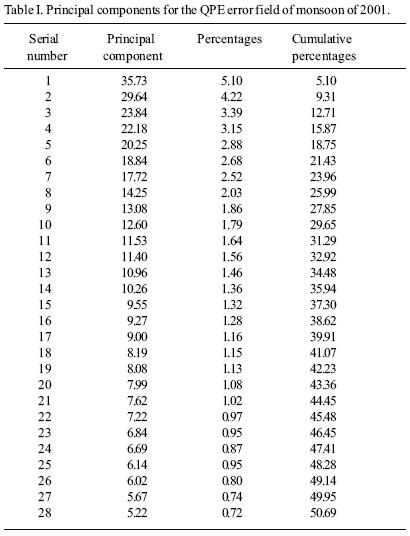
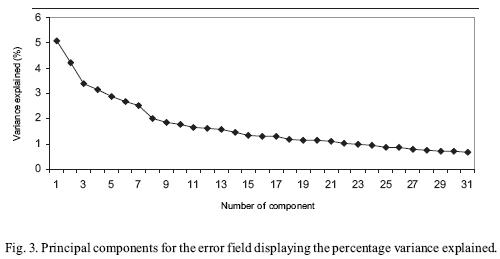
Eigen values and cumulative total variance accounted by first 28 PCs have been tabulated in Table I. The cumulative variance for first 28 PCs explains about 50% of the entire spatial variation. Their variation is displayed in Figure 3. The first four PCs have been selected for the detailed study. This is because, for higher modes, sampling errors become large enough to result in mixing of higher eigen components, making interpretation difficult (North et al., 1982). Hence, higher modes of the error field are not considered.
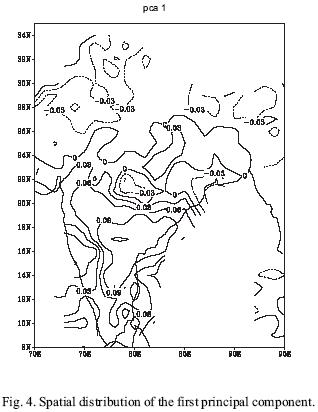
The first principal component (Fig. 4), which explains about 5.1% of the variance, has strong positive loadings over southern parts of the country. This corresponds to the onset phase of monsoon during June when heavy rainfall activity dominates over southern peninsular India.
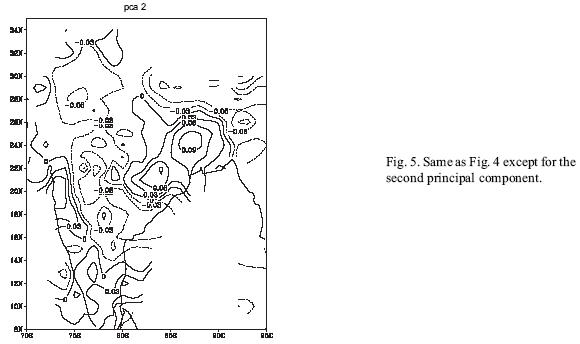
The second principal component (Fig. 5) explains about 4.2% of the variance and has strong positive loading over eastern parts of the country (Gangetic West Bengal, Orissa, and adjoining, and some parts of Madhya Pradesh). The strong positive loading also prevailed over the Western Ghats. This pattern corresponds to the situation of active monsoon condition, when heavy rainfall occurs over the east central parts of the country in presence of the monsoon low pressure system which forms over the north bay and moves westnorthwestwards across the country. Heavy rainfall also occurs along the Western Ghats due to orographic lifting caused by strong lower tropospheric westerlies.
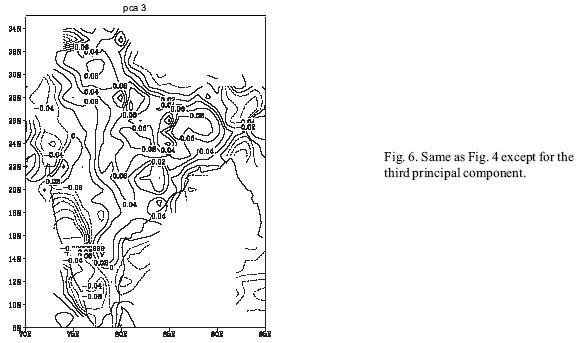
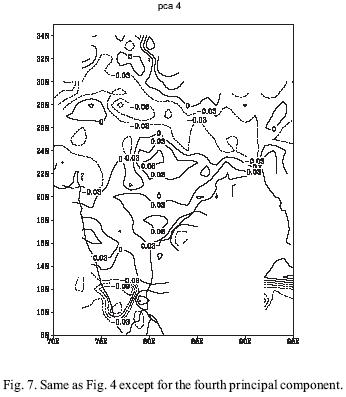
The third principal component (Fig. 6), explains about 3.3% of the variance and also has strong positive loadings over the domain of monsoon trough. This pattern corresponds to the active phase of monsoon in presence of monsoon trough at the normal position. The fourth principal component (Fig. 7) explains about 3.1% of the variance and positive loadings over the southern position of monsoon trough. This pattern corresponds to the situation when monsoon trough locates south of its normal position.
6. Concluding remarks
This paper makes an investigation into the spatial variation of errors in the INSAT derived QPE. The study shows that the rainfall is significantly underestimated along the Western Ghats and foot hills of the Himalayas, where the root mean square errors are also very large. The performance of the QPE is reasonably good over the rest of the region, particularly over the domain of monsoon circulations, where the root mean square errors are less.
The PCA of the error field reveals that the error is of a systematic nature and corresponds to a particular synoptic condition. The first principal component which explains about 5.1% of the variance corresponds to the onset phase of monsoon during June over the country, when strong positive loadings dominate over the southern parts of the country. The QPE performs well to capture rainfall associated with this situation. The second principal component explaining about 4.2% of the variance has strong positive loading over the domain which is characterized by the intermittent presence of a monsoon low pressure system. The third principal component, which explains 3.3% of the variance, corresponds to the situation of active monsoon condition in presence of monsoon trough at the normal position. The fourth principal component which explains 3.1% of the variance, corresponds to the synoptic situation when the monsoon trough locates south of its normal position.
Acknowledgements
Authors are grateful to the Director General, India Meteorological Department, New Delhi, for providing all facilities to carry out this work.
References
Arkin P. A. and B. N. Meisner, 1987. The relationship between large–scale convective rainfall and cloud top temperature over the western hemisphere during 1982–84. Mon. Wea. Rev. 115, 51–74. [ Links ]
Arkin P.A., A. V. R. K. Rao and R. R. Kelkar, 1989. Large–scale precipitation and out–going longwave radiation from INSAT–1B during 1986 south–west Monsoon season. J. Climate 2, 619–628. [ Links ]
Bedi H. S. and M. M. S. Bindra, 1980. Principal components of monsoon rainfall. Tellus 32, 296–298. [ Links ]
Ebert E. and J. L. Marshall, 1995. An evaluation of infrared satellite estimates techniques over Australia. Aus. Meteorol. Mag. 44, 177–190. [ Links ]
Janowiak D. E., 1992. Tropical rainfall: A comparison of satellite derived rainfall estimates with QPE precipitation forecast, climatologies and observations. Mon. Wea. Rev. 120, 448–462. [ Links ]
Krishnamurthy V. and J. Shukla, 2000. Intraseasonal and Interannual variation of rainfall over India. J. Climate 13, 4366–4377. [ Links ]
Martin R. S., C. H. Reinsch and J. H. Wilkinson, 1968. Householder's tridiagonalization of a symmetric matrix. Numer. Math. 11, 181–195. [ Links ]
Mazumdar A. B., 1998. Southwest monsoon rainfall in India: Part I, Spatial Variability. Mausam 51, 71–78. [ Links ]
North G. R., T. L. Bell, R. F. Cahalan and F. J. Moeng, 1982. Sampling errors in the estimation of empirical orthogonal functions. Mon. Wea. Rev. 110, 699. [ Links ]
Rao Y. P., 1976. Southwest Monsoon. India Meteorological Department, Meteorological Monograph No. 1/1976, p. 367. [ Links ]
Richard F. and P. Arkin, 1981. On the relationship between satellite observed cloud cover and precipitation. Mon. Wea. Rev. 109, 1081–1093. [ Links ]
Roy Bhowmik S. K. and A. M. Sud, 2003. Seasonal and spatial characteristic of QPE errors over Indian region. Mausam 54, 653–658. [ Links ]
Roy Bhowmik S. K., D. Joardar, S. Roy Soma and H. R. Hatwar, 2005. Meso scale features of monsoon precipitation system as revealed by the objective analysis of rainfall from the use of high dense land rainfall observation. Mausam 56, 543–548. [ Links ]
Thiebaux H. J. and M. A. Pedder, 1987. Spatial objective analysis with applications to atmospheric sciences. Academic Press, London, UK, 299 p. [ Links ]
Xie P. and P. A. Arkin, 1996. Analysis of global monthly precipitation using gauge observation, satellite estimates and numerical QPE precipitation. J. Climate 9, 840–858. [ Links ]

