


Servicios Personalizados
Revista
Articulo
 Inglés (pdf)
 Artículo en XML
 Referencias del artículo
 Enviar artículo por email
Indicadores
-
 Citado por SciELO
 -
 Accesos
Links relacionados
-
 Similares en
SciELO
Similares en
SciELO
Compartir

 Permalink
Atmósfera
versión impresa ISSN 0187-6236
Atmósfera vol.15 no.3 Ciudad de México jul. 2002
Some numerical solutions of the barotropic vorticity equation applied to the Gulf of Mexico
E. E. VILLANUEVA, V. M. MENDOZA and J. ADEM
Universidad Nacional Autónoma de México, Centro de Ciencias de la Atmósfera, Circuito Exterior, Ciudad Universitaria, 04510. México D. F., México
(Manuscript received Sept. 3, 2001; accepted in final form Dec. 4, 2001)
RESUMEN
Se presentan soluciones numéricas de la ecuación de vorticidad barotrópica bajo forzamiento producido por el esfuerzo del viento y por el transporte de masa entre las cuencas del Mar Caribe y el Golfo de México.
En la primera parte de este estudio, la ecuación se resuelve para el estado estacionario con un fondo plano a 200 m, líneas de costa y resolución horizontal de 25 km. En la segunda parte, se adiciona la batimetría de fondo y la ecuación se resuelve para los estados estacionario y no-estacionario.
En el estado no-estacionario, se encuentra que la Corriente de Lazo penetra en el Golfo y dobla hacia el oeste en una configuración inestable para dar lugar a un régimen periódico de desprendimiento de vórtices en el cual los vórtices anticiclónicos se propagan hacia el oeste como ondas de Rossby solitarias. El tiempo de vida de esos anticiclones es de cerca de 120 días con una magnitud de entre 275 y 440 km y una rapidez de propagación de cerca de 7.3 km día-1.
ABSTRACT
Numerical solutions of the barotropic vorticity equation under forcing by wind stress, and mass transport between the basins of the Caribbean Sea and the Gulf of Mexico, are shown, in the first part of this study, the equation was solved for a steady flow with a flat bottom of 200m depth, realistic coastlines and horizontal resolution of 25 km.
In the second part, we added the bottom bathymetry, and the equation was solved for the steady-state and non-steady-state.
In the non-steady regime, we found that the Loop Current (LC) penetrates into the Gulf and bend westward into unstable configuration to give rise to a periodic eddy shedding regime, in which the anticyclonic eddies are shedded of the Loop Current and propagated westward as solitary Rossby waves. The lifetime of these anticyclonic eddies is about of 120 days; they have a size from 275 to 440 km and propagation speed of about 7.3 km day-1.
Keywords: Barotropic vorticity equation; eddy shedding; Gulf of Mexico.
1. Introduction
The eddy shedding phenomenon in the Gulf of Mexico, has been studied to understand the role of the eddies in producing fluxes of momentum and heat (Elliot, 1982; Vukovich and Maul, 1985; Kirwan et al., 1984; Lewis and Kirwan, 1987; Sturges, 1992). Hurlburt and Thompson (1980) carried out a numerical and analytical study of the circulation in the Gulf of Mexico, using a two-layer primitive equations model covering a wide range of the model parameters and forcing. A significant result of this work is the existence of a natural quasi-annual flow cycle due to the internal dynamics within the Gulf. Sturges et al. (1993) explained the separation of a single typical eddy from the LC in the Gulf of Mexico, using a primitive equations model that simulates the vertical structure of the currents with more than two degrees of freedom, concluding that the separation of anticyclonic eddies is a long gradual process involving recirculation between the eddy and the main flow.
Oey (1995) centered his researches on the importance of gulf-scale forcing on shelf processes, and he used a numerical model to explain how the circulation and the mixing in the northern part of the Gulf of Mexico are influenced by wind, eddies and bouyancy. Furthermore, using a version of Blumberg and Mellor (1983) 3D-primitive equations ocean model, Oey (1996) examined the variability of the LC and the LC eddies, obtaining realistic results for a certain range of values of the horizontal diffusion coefficients. He also reported that the inclusion of at least a part of the Caribbean Sea may be necessary in modeling the LC dynamics.
Molinari (1978) carried out an important analysis of the variability both in the circulation and in the thermal patterns of the Caribbean Sea and Gulf of Mexico using the vorticity equation forced by the curl of the wind stress. Following this study, in this paper we have carried out a simulation of the meso-scale circulation in the Gulf of Mexico. First, we obtain a steady-state solution of the barotropic vorticity equation with a flat bottom of 200 m depth, realistic coastline boundaries and open boundaries in the Caribbean Sea and Atlantic coast of Florida. Then, we search a stationary and non-stationary solutions of this equation taking into account the bottom bathymetry.
2. The model
The governing equations for an incompressible fluid in the hydrostatic equilibrium are vertically integrated over the ocean depth assuming a free-surface flat and homogeneous atmospheric pressure at sea level. Therefore we have the following equations:
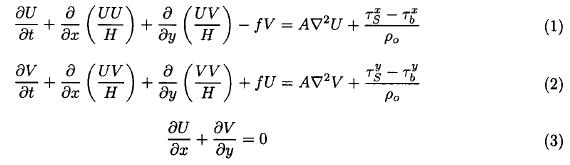
where U and V are the transports of water through the ocean layer of depth H, in the x and y directions, respectively, so that
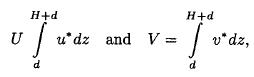
where d is the variation of the bottom height, f = f0 + βy is the Coriolis parameter for the beta-plane approximation, f0 = 5.91 x 10⁻⁵ s-1 and β = 2.1 x 10⁻¹¹ m-1s-1; τs = (τsx, τsy) and τb = (τbx, τby) are the wind stress vector at the surface and stress vector at the bottom, respectively; A is the constant diffusion coefficient and ∇2 is the Laplace operator.
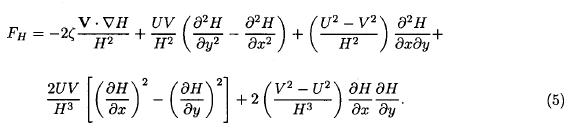
Differentiating Eq. (1) with respect to y and Eq. (2) with respect to x, subtracting the second result from the first one and using the continuity equation (3), we obtain the barotropic vorticity equation:

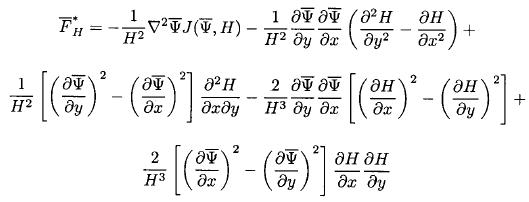
where  is the vorticity; V = (U, V) is the vector transport; and FH is expressed as:
The wind stress vector at the sea surface is calculated by:
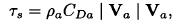
where ρa is the air density at the sea surface, CDa is the drag coefficient taken as 1.5x 10⁻³, and Va = (ua, va) is the wind vector at the sea surface, representing the climatological value in January taken from the NCEP reanalysis data set. For the stress vector near the bottom, we assume that:
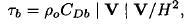
where CDb is the drag coefficient near the bottom, which in accordance with Ramming and Kowalik (1980), is taken as 3.5 x 10⁻³.
For the case when H is a constant, the term FH in Eq. (4), given by Eq. (5), is equal to zero, while τb = ρoCoV, where C0 = 1.0 x 10⁻⁶s-1 (Haltiner and Williams, 1980). Then Eq. (4) can be expressed as:
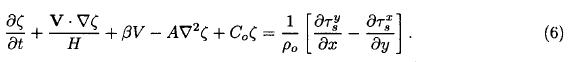
Assuming that the flow is stationary and neglecting the vorticity advection and diffusion terms, the barotropic vorticity Eq. (6) is reduced to:
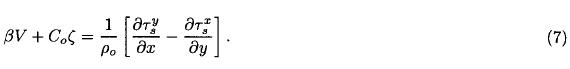
Equation (7) was solved analytically by Stommel (1948) for a rectangular basin representing the Northern Atlantic.
We will use an implicit scheme for integrating the barotropic vorticity equation, and will express Eqs. (4), (6) and (7) as:

In Eq. (8) we have expressed the transport components as  and
and  where
where  is the transport streamfunction. For Eq. (4), Co* = Δt-1 where Δt is the time interval taken as one hour and

where
where  and
and  is the streamfunction evaluated at the previous time step.
For Eq. (6), Co* = Δt-1 and

and for Eq. (7) Co* = Co and  .
.
Equation (8) is integrated by the Liebmann over-relaxation method, using centered finite differences on a regular grid of 25 km and the Arakawa's Jacobian for  and
and  , which conserves square vorticity and kinetic energy. The model domain includes the Gulf of Mexico, the northwestern portion of the Caribbean Sea and the Atlantic coast of Florida (Figure 1).
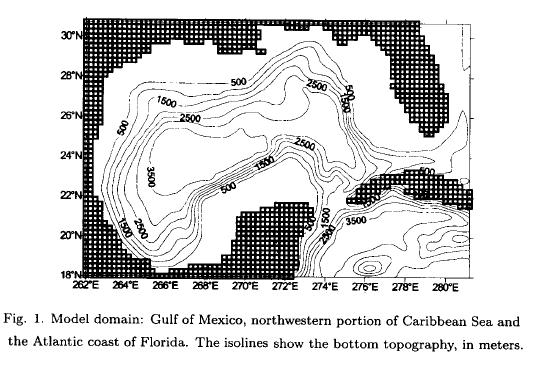
Depending on the experiment, we used a total inflow in the Caribbean of 30 Sv (Sv ≡ 106 m3 s-1) as in Oey (1996) when the bottom topography is included, or 5-Sv as in Molinari (1978) when H is a constant. The total inflow is divided at the open boundaries located in 18°N and 272.5° to 274.0°E; and in 18° to 20°N and 281°E in the Caribbean Sea. The open boundary conditions used in the model is in agreement with the mean temperature distribution at 150 m for January, April, July and October, observed in the charts of Robinson (1975). A total outflow of 30 Sv or 5 Sv is required by mass conservation. This outflow is located in 30 °N and 279° to 281°E in the Atlantic coast of Florida (Oey, 1996), for the remaining points we use closed boundary conditions. Therefore at the open boundary points (18°N, 272.5° to 274°E), we assume that the transport streamfunction is increased from 0 to 15 Sv (or from 0 to 2.5 Sv), this value of 15-Sv (or 2.5 Sv) remaining constant for the closed boundary points. At the open boundary points (18° to 20°N, 281°E), the transport streamfunction is again increased from 15 Sv to 30 Sv (or from 2.5 to 5 Sv), the closed boundary points remain with a constant value of 30 Sv (or 5 Sv). The open boundary points located in 30°N and 279° to 281°E take values decreasing from 30 Sv to 0 Sv (or 5 Sv to 0 Sv), we assume a null value for the transport streamfunction across all the closed continental boundary points, as well as, for the Laplacian of the streamfunction at all boundary points of the integration area.
In all the experiments, we assume that the ocean is initially at rest (i.e., = 0 in all interior points) and this transport streamfunction for the first time-step is a first guess solution in the relaxation of Eq. (6), for the following time-steps, we assume as first guess solution in the relaxation, the one obtained in the previous time-step; this method reduces the number of cycles of relaxation in each time-step.
3. Results
We present a set of solutions for the transport streamfunction obtained with the barotropic vorticity Eqs. (4), (6) and (7).
In Table 1 we show the characteristics of the experiments carried out, besides the experiment is identified in the first column while the corresponding number of figure is given in the second column.
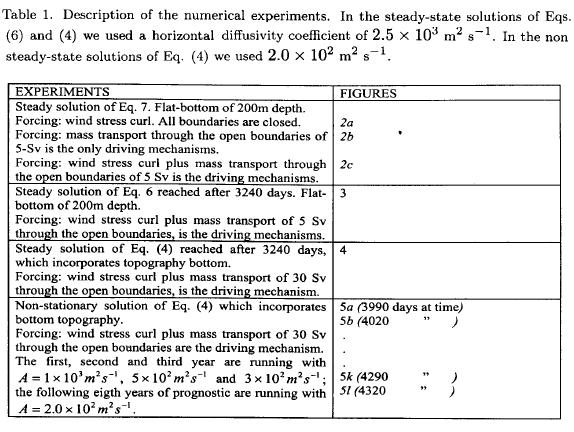
In Figure 2, we show the circulation patterns for different solutions of Eq. (7). Figure 2a shows that the curl of the wind stress establishes two anti-cyclonic gyres, one in the Caribbean Sea and another in the Gulf of Mexico. A weak cyclonic gyre is also observed in the Bay of Campeche.
The vorticity equation (7), establishes in the most part of the Gulf of Mexico a balance between the β-term and the curl of the wind stress, called Sverdrup balance (Stommel, 1948). This circulation pattern is strongly asymmetric in the east-west direction establishing a western boundary current that returns the flow toward the north of the Gulf, with a length scale of
Figure 2b displays the circulation when the mass transport through the open boundaries is the only driving mechanism. In this case we obtain an intensified circulation pattern in the western Caribbean Sea and on the west coast of Florida, which is mainly due to the β-effect.
Figure 2c shows the circulation, when both the curl of the wind stress and the flow through the boundaries are included. In this case, the western boundary current and the exchange of mass between the two basins are intensified.
The results shown in Figures 2a, 2b, and 2c are similar to those obtained by Molinari (1978) for an idealized rectangular basins of the Gulf of Mexico and the Caribbean Sea. However, our results show a cyclonic ring generated in the Bay of Campeche by the curl of the wind stress.
Figure 3 displays the circulation pattern for the solution of the complete vorticity equation (6), when the curl of the wind stress and the mass transport through the open boundaries are included. In this case, the current pattern is very similar to that obtained with the vorticity equation (7), which means that both the β-term and the frictional term are balanced by the curl of the wind stress.
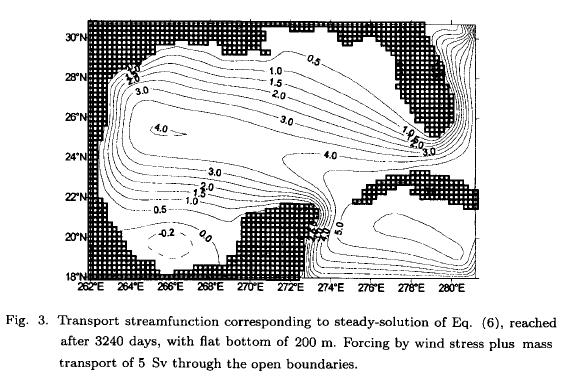
Figure 4 exposes the steady solution of the barotropic vorticity equation (4). In this case we obtain a cyclonic eddy on the northwest of the Gulf and an unbroken circulation which is westward bending drawing a contour of 1 Sv with an anticyclonic eddy of 3 Sv superimposed. This case can be considered as an eddy-shedding transition regime in accordance with Hurlburt and Thompson (1980).
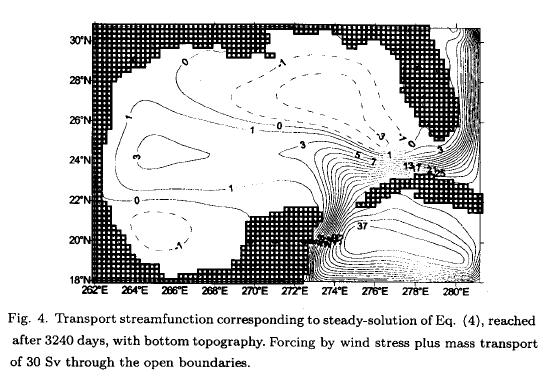
Figure 5 shows an eddy shedding regime. This non-stationary case was obtained by decreasing the diffusion coefficient from 2.5 x 10³ to 2.0 x 10² m2 s-1. Figures 5a to 5l (5b, 5c, 5d, 5e, 5f, 5g, 5h, 5i, 5j, 5k) display the average streamfunction of the last five days of each 30-day period. The anticyclonic eddies which are shedded off the LC are propagated westward as solitary Rossby waves until they interact with the western boundary and dissipate as is shown in Figures 5b to 5c, 5e to 5f and 5i to 5j. The anticyclonic eddies have a lifetime of 90 to 120 days and eddy shedding period of 120 days (Figures 5b to 5f ) (5c, 5d, 5e), sizes of 275 to 440 km and a propagation speed of about 7.3 km day-1 . The circulation patterns have a repetition period of 210 days (Figures 5a to 5h) (5b, 5c, 5d, 5e, 5f, 5g). Some similitudes are found when comparing the barotropic streamfunction for t = 2915 to t = 3050 with the streamfunction (not shown here) obtained with a 3D-model of primitive equations of Oey (1996; Experiment C2). For example, Oey also found anticyclonic eddies with sizes from 200 to 400 km and with lifetime of between 100 and 200 days, however he found a more height propagation speeds from 3 to 5 km day-1, maybe due that his solution contain the barotropic and baroclinic modes.
In Figure 5, associated with each eddy shedding, in the northern part of the Gulf, a cyclonic eddy of 120-day period appears, which is propagated westward. This cyclonic eddy is formed by the intrusion of the LC toward the north of the Gulf over the Florida shelf (Figs. 5c, 5g and 5k). These cyclonic eddies have been observed by Vukovich and Maul (1985).
4. Conclusions
The numerical solution of the barotropic vorticity equation with flat bottom, demonstrates a Sverdrup balance in the most part of the Gulf of Mexico, when the wind stress is the only driving mechanism.
We have found that the exchange of mass between the two basins, the Caribbean and the Gulf of Mexico, is enhanced by the wind stress curl and that the barotropic vorticity equation with bottom topography captures the essential features of the LC and the LC shedding eddies obtained by the other authors (Sturges et al., 1993; Oey, 1996) with 3D-models based on primitive equations.
Acknowledgments
This work was supported by CONACyT (Consejo Nacional de Ciencia y Tecnología, México) Projet No. 3722P-T. We are grateful to Berta Oda Noda for her valuable comments and to Thelma del Cid for the technical revision of the manuscript.
REFERENCES
Blumberg, A. F. and G. L. Mellor, 1983. Diagnostic and prognostic numerical circulation studies of the South Atlantic Bight. J. Geophys. Res., 88, 4579-4592. [ Links ]
Elliott, B. A., 1982. Anticyclonic rings in the Gulf of Mexico. J. Phys. Ocean., 12 (11), 1292-1309. [ Links ]
Haltiner, G. J. and R. T. Williams, 1980. Numerical prediction and dynamic meteorology. Second Edition. John Wiley & Sons. Inc., 447 pp. [ Links ]
Hurlburt, H. E. and J. D. Thompson, 1980. A numerical study of Loop Current intrusions and eddy shedding. J. Phys. Ocean., 10, 1611-1651. [ Links ]
Kirwan, A. D., W. J. Merrell, J. K. Lewis, R. E. Whitaker and R. Legeckis, 1984. A model for the analysis of the drifter data with an application to a warm core ring in the Gulf of Mexico. J. Geophys. Res., 89, 3425-3438. [ Links ]
Lewis, J. K. and A. D. Kirwan, 1987. Genesis of a Gulf of Mexico ring as determined from kinematic analysis. J. Geophys. Res., 92, 11727-11740. [ Links ]
Molinari, R. L., 1978. The relationship of the curl of the local wind stress to the circulation of the Cayman Sea and the Gulf of Mexico. J. Phys. Ocean., 8, 779-784. [ Links ]
Oey Lie-Yauw, 1995. Eddy and wind forced shelf circulation. J. Geophys. Res., 100, C5, 8621-8637. [ Links ]
Oey Lie-Yauw, 1996. Simulation of mesoscale variability in the Gulf of Mexico: sensitivity studies comparison with observation and trapped wave propagation. J. Phys. Ocean., 26, 145-175. [ Links ]
Ramming, H. G. and Z. Kowalik, 1980. Numerical modelling of marine hydrodynamics. Application to dynamic physical processes. Elsevier Scientific Publishing Company. [ Links ]
Stommel, H., 1948. The westward intensification of wind-driven ocean currents. Trans. Am. Geophys. Union, 29, 202-206. [ Links ]
Sturges, W., 1992. The spectrum of Loop Current variability from gappy data. J. Phys. Ocean., 22, 1245-1256. [ Links ]
Sturges, W., J. C. Evans, S. Welsh and W. Holland, 1993. Separation of warm-core rings in the Gulf of Mexico. J. Phys. Ocean., 23, 250-268. [ Links ]
Vukovich, F. M. and G. A. Maul, 1985. Cyclonic eddies in the eastern Gulf of Mexico. J. Phys. Ocean., 15, 105-117. [ Links ]

