


 nueva página del texto (beta)
 Inglés (pdf)
 Artículo en XML
 Referencias del artículo
 Enviar artículo por email
 Citado por SciELO
  Similares en
SciELO
Similares en
SciELO 
 Permalink
Introduction
One of the most elusive objectives for seismology is being able to predict an earthquake in the short term. There are numerous studies reporting relationships between earthquakes and physical phenomena, such as significant mechanical effects in the focal area of an earthquake, whether rock changes or deformation; changes in rock properties and stress-deformation state; changes in the chemical composition and/or temperature of the groundwater; electrophysical properties of the medium; increased emanations of natural radon and excitation of seismic signals: all of this affects the regimes of geophysical fields (Hayakawa et al. 2010; Takeuchi et al. 2012, Varotsos et al., 2013; Spivak and Riabova, 2019).
The geomagnetic field is no exception. It was repeatedly observed that geomagnetic field disturbances occurred during the preparation stage of an earthquake (Kushwah et al., 2009; Ruiz et al., 2011; Takla et al., 2018).
The geomagnetic field that is measured on the earth's surface is the vector sum of various constituent fields, each of which has a different origin and varies differently in time and space. It is mainly made up of two constituents: a global one with great amplitude, whose source is within the earth, and the other one, with a much lesser amplitude, created by more superficial sources. Onlapping them is the outer field caused by electric currents circulating in the ionosphere and the magnetosphere which, when varying in time, generate induced fields. (Mandea and Purucker, 2005, Tackla et al., 2018).
Over 90 percent of the measured field is generated in the outer core of the earth. This part of the geomagnetic field slowly varies in time and can be described by means of mathematical models, such as the International Geomagnetic Reference Field (IGRF) and the World Magnetic Model (WMM) (Alken et al., 2021, Rother et al., 2021).The intensity of the magnetic signal from rocks is usually below 1 percent of the intensity of the earth's main magnetic field. However, with a geomagnetic field model (for example, the IGRF), these small signals may be recovered from the data measured (Skordas and Sarlis, 2014). Geomagnetic studies can contribute to providing information on the subsoil and the process involving an earthquake.
There are a lot of studies on the mechanisms (Ryu et al. 2014) that cause the ionospheric disturbances coupled to seismic activities. Furthermore, recent statistical studies using ground and satellite data have provided convincing correlations between the seismic activities and the ionospheric disturbances preceding earthquakes [Fujiwara et al., 2004; Liu et al., 2006, Larocca et al., 2019].
The analysis of indices of solar and geomagnetic activity serves to account for how rapid variations of geomagnetic activity influence data processing. Dst, Ap and F10.7 cm indices are usually used to monitor this phenomenon (Tsurutani et al., 1997, 1999). The intensity of the equatorial magnetic field, measured by the Dst index, is directly related to the total kinetic energy of the ring current particles (Rostoker et al., 1997), thus, the Dst index is also often used to determine whether or not a storm occurred, to define the duration of a storm, and to distinguish between quiet and disturbed geomagnetic conditions. Ap index characterizes the intensity of geomagnetic activity at planetary scale from the measurement of the horizontal component of the magnetic field observed in 13 stations, of which 11 correspond to the northern hemisphere and two to the south and the solar index F10.7cm measures the radio emissions F10.7cm that originate in the upper atmosphere (Perrone & De Franceschi, 1998).
The subduction zone of the South American plate beneath the South Sandwich plate, located in the South Atlantic, is one of the areas with highest seismic activity in the planet -within a year, over 300 seismic events of Mw > 4.1 may occur. This small plate is bounded to the north and east by the South American plate; to the south, by the Antarctic plate; and to the west, by the Scotia plate. The subduction zone shows an active volcanic and tectonically simple intra-oceanic arc. The active arc is largely built on the oceanic crust of the small South Sandwich plate, which was formed approximately 10 Ma ago in the spreading center of the East Scotia ridge (Leat et al., 2003). The arc is being formed in response to an inclined subduction of the South American plate beneath the South Sandwich plate at a velocity of 67-79 km / Ma (Thomas et al., 2003); within a year it accounts for a relative displacement of 7 to 8 cm.
This paper sets out to examine the occurrence of any changes in the earth's magnetic field associated with seismic events of the small South Sandwich plate, in a one-year period from May 17, 2018 to the same date in 2019. To this end, magnetic data records of three observatories closest to the study area were studied, namely King Edward Point (KEP), located in the vicinity, Port Stanley (PST) on the Malvinas islands, and Orcadas (ORC) on the Orcadas del Sur islands, located farther away, in the cited period based on filter processing and wavelet analysis of their differences.
Data and Methodology
This paper used the value of the International Geomagnetic Reference Field available at https://www.ngdc.noaa.gov/geomag/data.shtml as a reference value for the three magnetic observatories, which was then subtracted from their daily observations for the one-year period between May 17, 2018 and May 17, 2019. Data were acquired per minute from observatories King Edward Point (KEP) (54.3° S; 36.5° W), located in the vicinity of the transcurrent margin, Port Stanley (PST) (51.7° S; 57.8° W), and Orcadas (ORC) (60.7° S; 44.7° W). These data were obtained from the International Real-time Magnetic Observatory Network (INTERMAGNET) with a 1-minute resolution, available at https://intermagnet.github.io.
Nearly 300 seismic events of Mw > 4.4 and their respective depths, as extracted from the United States Geological Survey (USGS, https://earthquake.usgs.gov/earthquakes/), were analyzed (Figure 1).
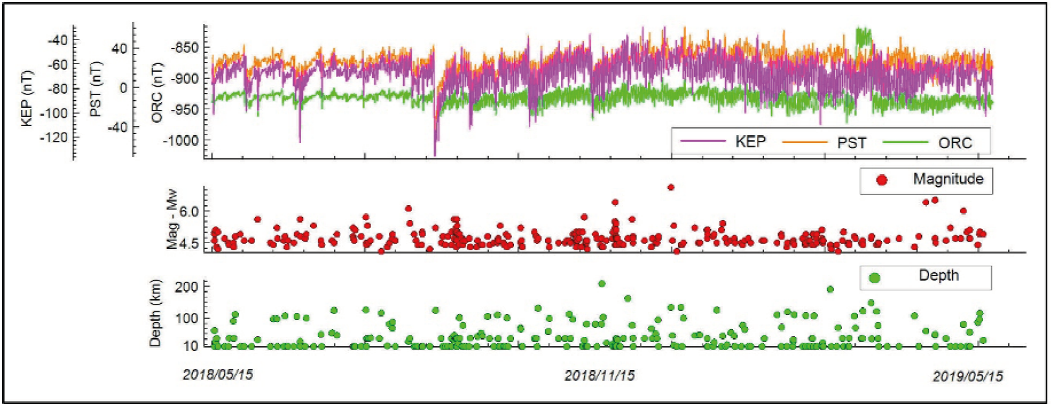
Figure 1 Daily variations of the H component of the earth's magnetic field in PST, KEP and ORC observatories. Magnitudes of earthquakes and their depths during the year of study.
In addition, in order to take into account the rapid variations of the geomagnetic field, this study included information from geomagnetic indices Dst, Ap and the solar index F10.7cm. Dst -monitoring the variations of the horizontal component of the earth's magnetic field due to an increase in the ring current derived from a network of geomagnetic observatories symmetrically located in the equatorial area, and measured in nT. The value of the Dst index is statistically zero on days considered quiet. Dst index is reported by Kyoto University in hourly values. During a geomagnetic storm, its value falls to a minimum value and then recovers to zero. According to the minimum value reached, the onset of an intense storm is considered if Dst> -100 nT (Sugiura and Chapman, 1960; Sugiura, 1964), which does not occur in our study period. Ap index is reported daily, nevertheless its sampling rate is supposed to be three hourly. Values of Ap > 40 nT provide a maximum disturbance measure useful to identify major geomagnetic storms (Perrone and De Franceschi, 1998) but in these periods of time, they are lowest; and F10.7cm solar index is an excellent indicator of the solar activity originating high in the chromosphere and in the corona of the solar atmosphere, and it is reported in "solar flux units" (sfu); as obtained from the Geomagnetic Data Service of Kyoto (http://wdc.kugi.kyoto-u.ac.jp/wdc/Sec3.html). On the other hand, the value of the radio flux index was always below 70 sfu.
The methodology used involved studying intervals with a length from 7 to 10 days, which included seismic events, throughout the year. Because the closest Geomagnetic observatory to the study area is KEP Observatory, it was decided to focus the study on the analysis of the data recorded there.
The technique to identify potential anomalous variations of the earth's magnetic field implied examining the wavelet power spectra of magnetic data from KEP Magnetic Observatory, separately analyzing the horizontal and vertical components of the magnetic field measured, and subsequent! analyzing the horizontal component with the application of a low pass filter to attenuate the diurnal anomaly (Grinsted et al., 2004) and to be to identify anomalous frequencies around the earthquake detection time.
In addition, in such intervals, for the purposes of isolating the magnetic field caused by the local geomagnetic variation due to solar variability, the field differences (Δ) between KEP and ORC observatories (ΔKEP-ORC) were calculated, the value of the reference magnetic field corresponding to the time and location of each observatory was subtracted. This procedure was used to accentuate the effects of seismic activity given KEP's proximity to the South Sandwich plate. Afterwards, wavelet (wt) were applied with Morlet exponential decay to the time series obtained from the difference of the data recorded (only the horizontal component of the geomagnetic field is analyzed as it is most susceptible to its rapid variations).
Results
Seven representative seismic events were chosen to describe the results obtained (Table 1). These events were selected due to their closeness to King Edward Point observatory (less than 350 km).
Table 1.Selected seismic events close to King Edward Point geomagnetic observatory.
| No. | Date | Time | Lat. (°) | Long. (°) | Depth (km) | Mag | Type of Mag. | Place |
|---|---|---|---|---|---|---|---|---|
| *1 | 5/24/2018 | 12:47 | -54.9892 | -32.118 | 10 | 4.5 | Mb | 294km ESE of Grytviken |
| *2 | 7/05/2018 | 19:23 | -55.096 | -30.9409 | 10 | 4.4 | Mb | 240km ESE of Grytviken |
| *3 | 9/21/2018 | 19:07 | -55.0491 | -33.4245 | 10 | 4.5 | Mb | 216km ESE of Grytviken |
| *4 | 9/26/2018 | 05:28 | -55.3485 | -31.3375 | 10 | 4.5 | Mb | 298km WNW of Visokoi Island |
| *5 | 9/26/2018 | 14:31 | -55.0642 | -31.3753 | 10 | 4.4 | Mb | 298km WNW of Visokoi Island |
| *6 | 10/11/2018 | 09:49 | -55.1947 | -30.9411 | 10 | 4.6 | Mb | 287km NW of Visokoi Island |
| *7 | 4/05/2019 | 16:14 | -55.9206 | -27.856 | 58.6 | 6.4 | Mb | 95km NW of Visokoi Island |
The events selected occurred during periods characterized by the absence of significant magnetic activity manifestations, resulting from the analysis of the geomagnetic indices Dst, Ap and the solar index F10.7cm as qualitative indicators of the activity, as shown on Figure 2. During the solar minimum the large-scale dynamics of the interplanetary medium is dominated by the stream interaction regions, which they produce most of the small and moderate geomagnetic storms during this period. The space weather events during the solar minimum, are mainly associated with stream interaction regions. Then the geomagnetic activity is not produced by solar flares o coronal mass ejections, but by interaction regions.
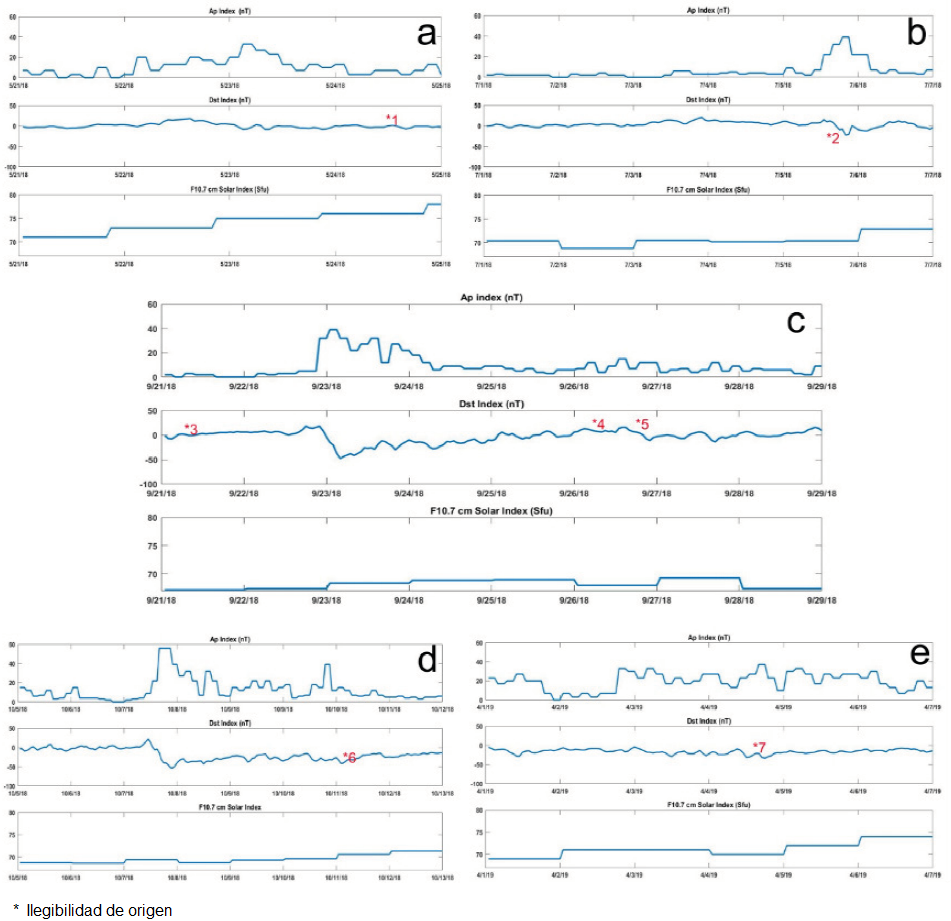
Figure 2 Solar indices Ap (nT), Dst (nT) and F10.7 cm (SFU=10-22 Wm-2 Hz-1) corresponding to periods 21-26 May, 2018; 1-7 July, 2018; 20-27 September, 2018; 5-13 October, 2018; and 1-7 April, 2019.These indices account for a low solar activity period.
Storm type according to Loewe & Prolss (1997) can be classified: a weak storm if it has -30 nT > Dst > -50 nT, a moderate storm if it has -50 nT > Dst > -100 nT, a strong storm if it has -100 nT > Dst > -200 nT, a severe storm : -200 nT > Dst > -350 nT, and a great storm with Dst < -350 nT. Then, in the selected periods, only two weak storms were observed on 9/22/18 and 10/8/18 with Dst ~-48 nT. The study shows that the small geomagnetic variations, presumably associated with seismic events, there were not in fact driven by solar wind stream interactions hitting the Earth's environment because they do not temporarily match those chosen for observation.
For the seven events selected, the magnetic field determined in KEP observatory was plotted, including both its horizontal and vertical components, showing anomalous variations in both components before a seismic event, although with better resolution in the horizontal component. In order to subtract the contribution of the diurnal solar variation and some weak events associated with space weather phenomena, the difference between the horizontal components from KEP and ORC observatories was calculated, and it was subsequently applied a low-pass filter (filtered signal). For the purposes of finding small field variations, the differences between ΔKEP-ORC and the filtered signal, were calculated (Figure 3). In all the seismic events, peaks were seen both in the H and Z components, as well as in the filtered variation, as shown on Table 2.
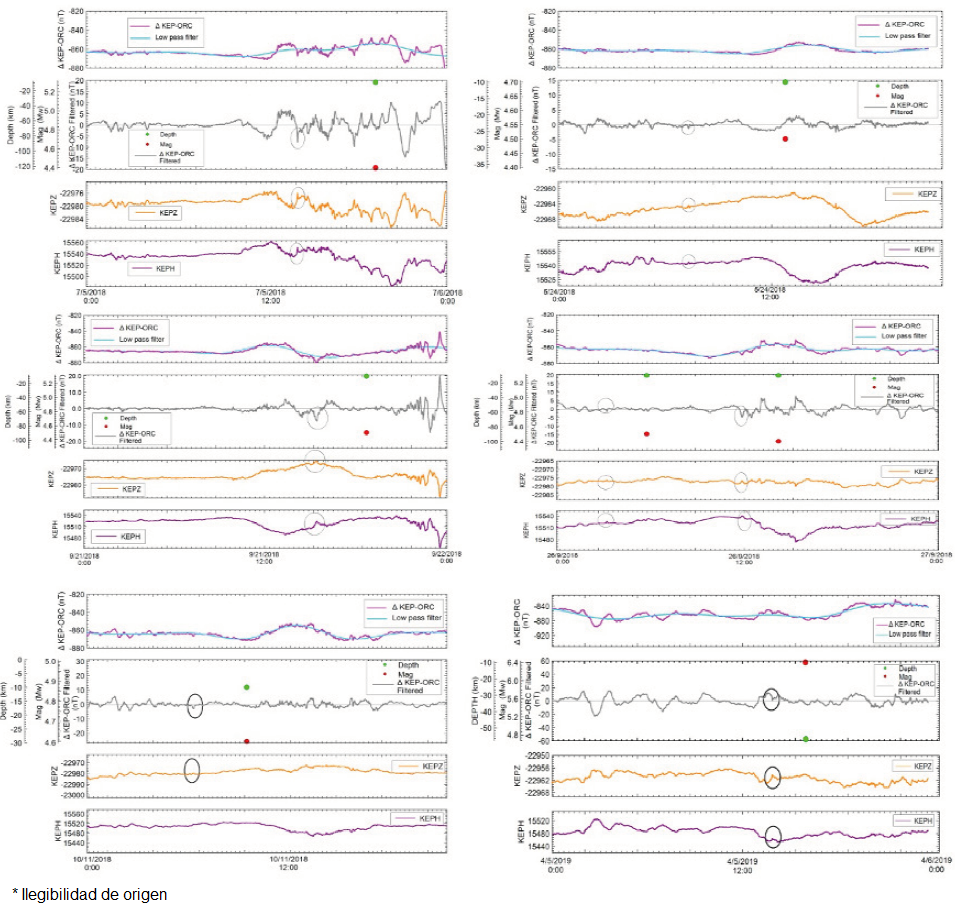
Figure 3 Magnetic data of 24 May, 2018; 5 July, 2018; 21 and 26 September, 2018; 11 October, 2018; and 5 April, 2019. Difference between magnetic data from KEP and ORC observatories.
Table 2 Intensity of the peaks observed in figure 3 on the difference of the magnetic data recorded in the KEP and ORC observatories and their anticipation to seismic events.
| No. | Date | Magnitude | Peak intensity (nT) | Anticipation (hours) |
|---|---|---|---|---|
| *1 | 05/24/2018 | 4.5 | 1.56 | 2h 47m |
| *2 | 07/05/2018 | 4.4 | 4.4 | 5h 10m |
| *3 | 09/21/2018 | 4.5 | 7.58 | 3h 30m |
| *4 | 09/26/2018 | 4.5 | 1.49 | 3h 00m |
| *5 | 09/26/2018 | 4.4 | 3 | 2h 30m |
| *7 | 04/05/2019 | 6.4 | 3.1 | 2h 07m |
In addition, the continuous wavelet transform (WT) was applied both to ΔKEP-ORC (Figure 4) and to each H and Z component of the magnetic field observed in KEP (Figure 5). The Morlet wavelet (with ω0 = 6) was used, as it provides a good balance between the time and frequency location. Figures 4 and 5 show the periodic oscillation of these magnetic data from 21 to 24 May, 2018; from 2 to 6 July, 2018; from 18 to 28 September, 2018; from 5 to 12 October, 2018; and from 3 to 6 April, 2019.
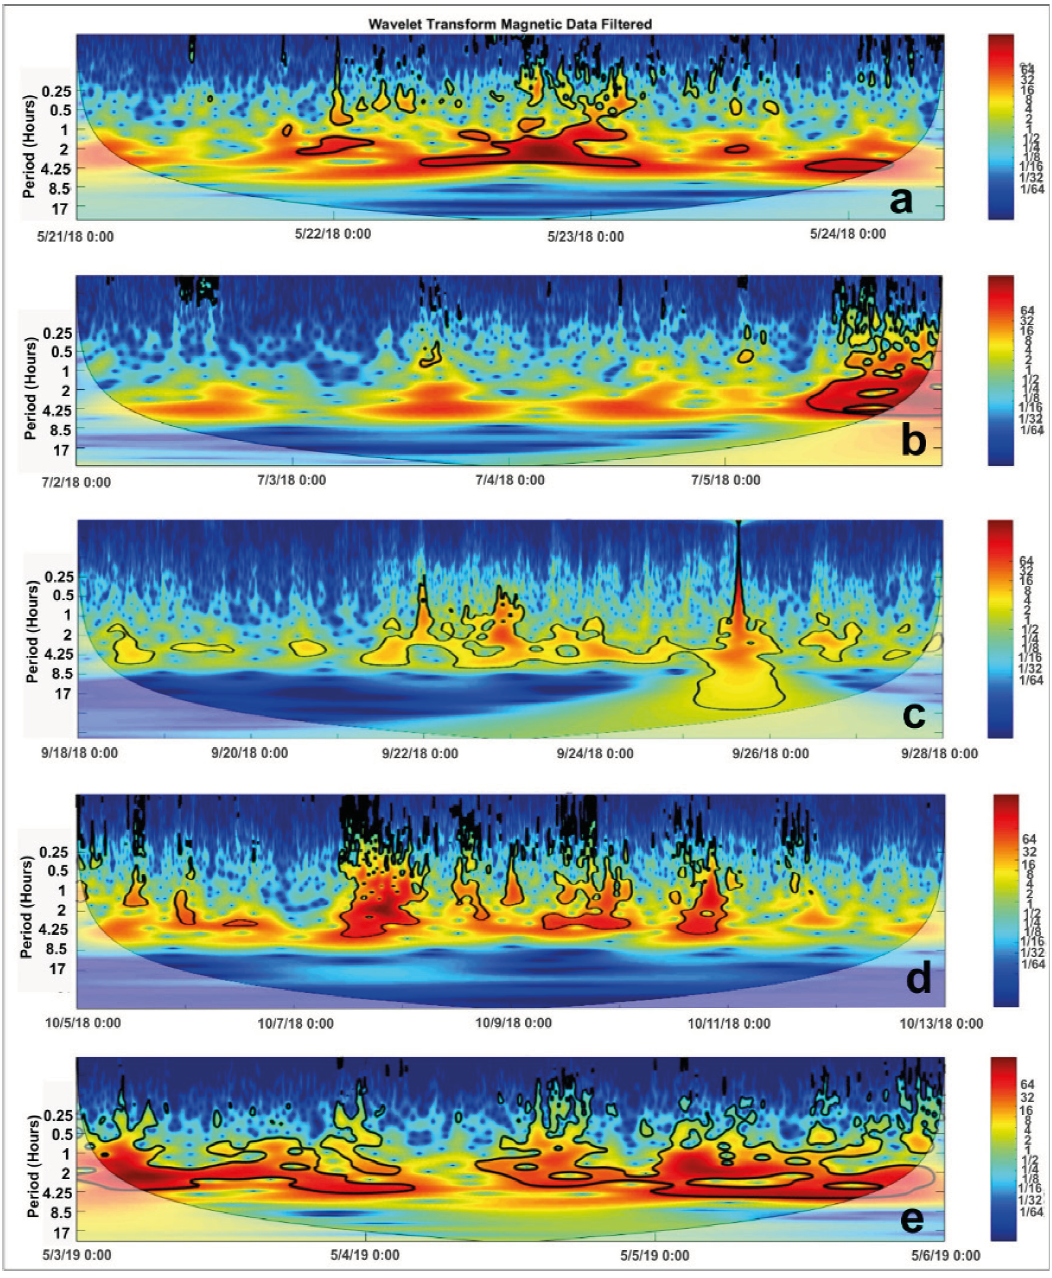
Figure 4 Continuous wavelet transform of the periods from 21 to 24 May, 2018; from 2 to 6 July, 2018; from 18 to 28 September, 2018; from 5 to 12 October, 2018; and from 3 to 6 April 2019 for ΔKEP-ORC The data shown corresponds to the difference between the horizontal components of the magnetic records of the KEP and ORC observatories, where the corresponding local IGRF contribution had already been discounted. These data were called: Filtered data in the figure. The thick black contour shows a 5% significance level against the red noise background, and the cone of influence (COI) where the edge effects may distort the image is blurred.
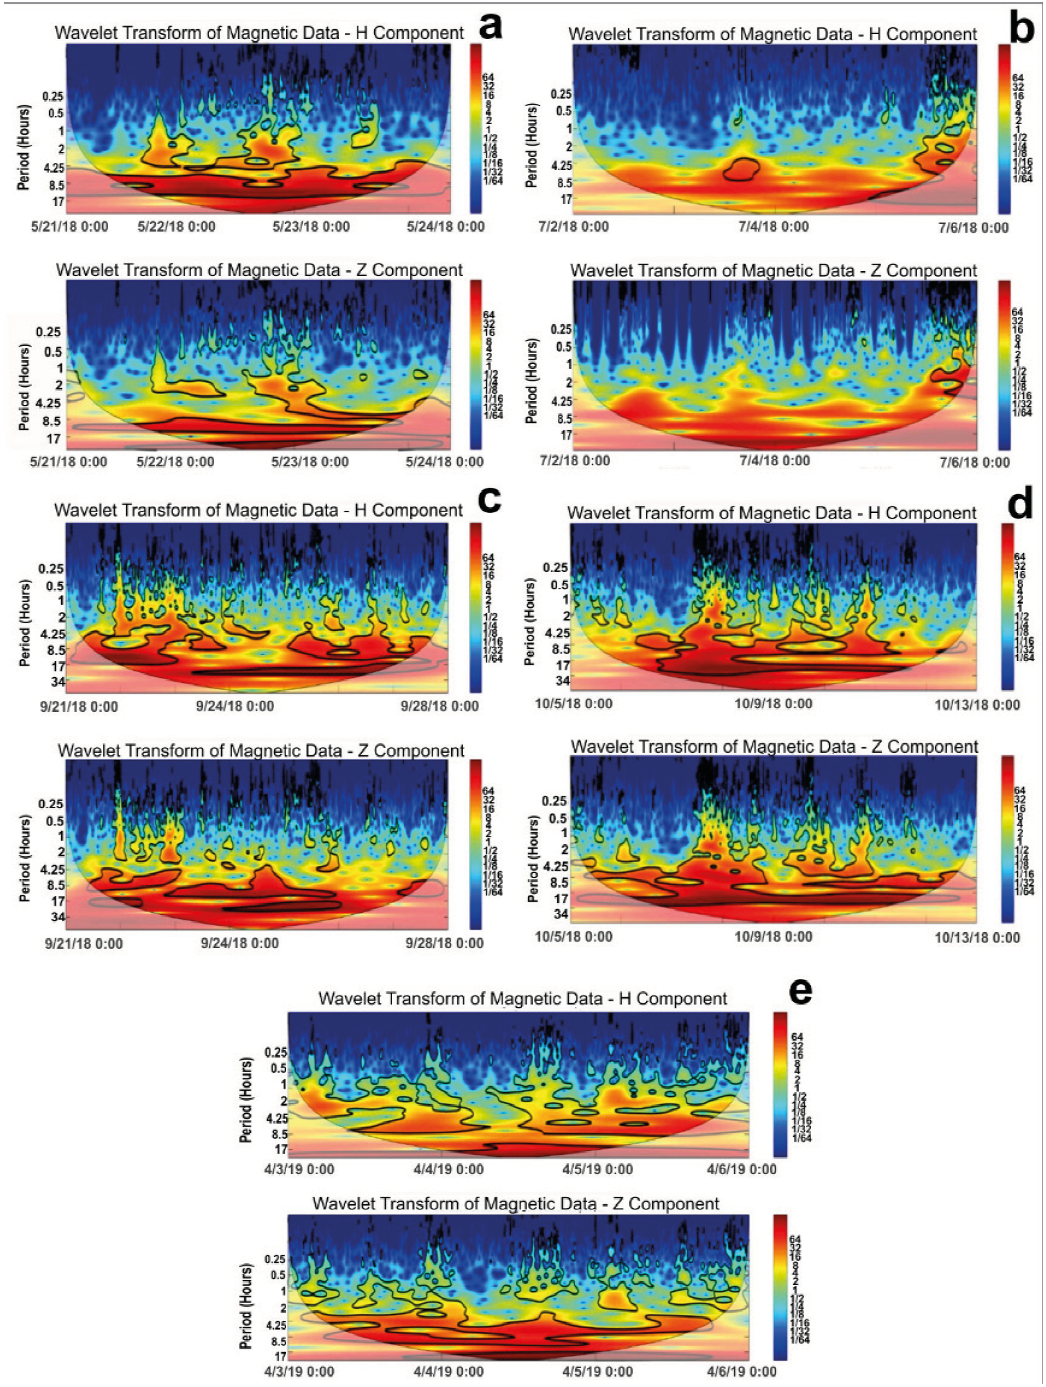
Figure 5 H and Z from 18 to 28 September corresponding to the periods from 21 to 24, May 2018; from 2 to 6 July, 2018; from 18 to 28 September, 2018; from 5 to 12 October, 2018; and from 3 to 6 April, 2019.
We examined two time series whose interval had the earthquake occurrence moment as a common instant. For the purposes of correlating periodicities between both series, we inspected these series together so as to find common frequencies. Based on their WTs, we constructed the Cross Wavelet Transform (XWT), which exposes their common power and relative phase in the time-frequency space. We used the corresponding software at http://noc.ac.uk/using-science/crosswavelet-wavelet-coherence. Figure 6 shows the result.
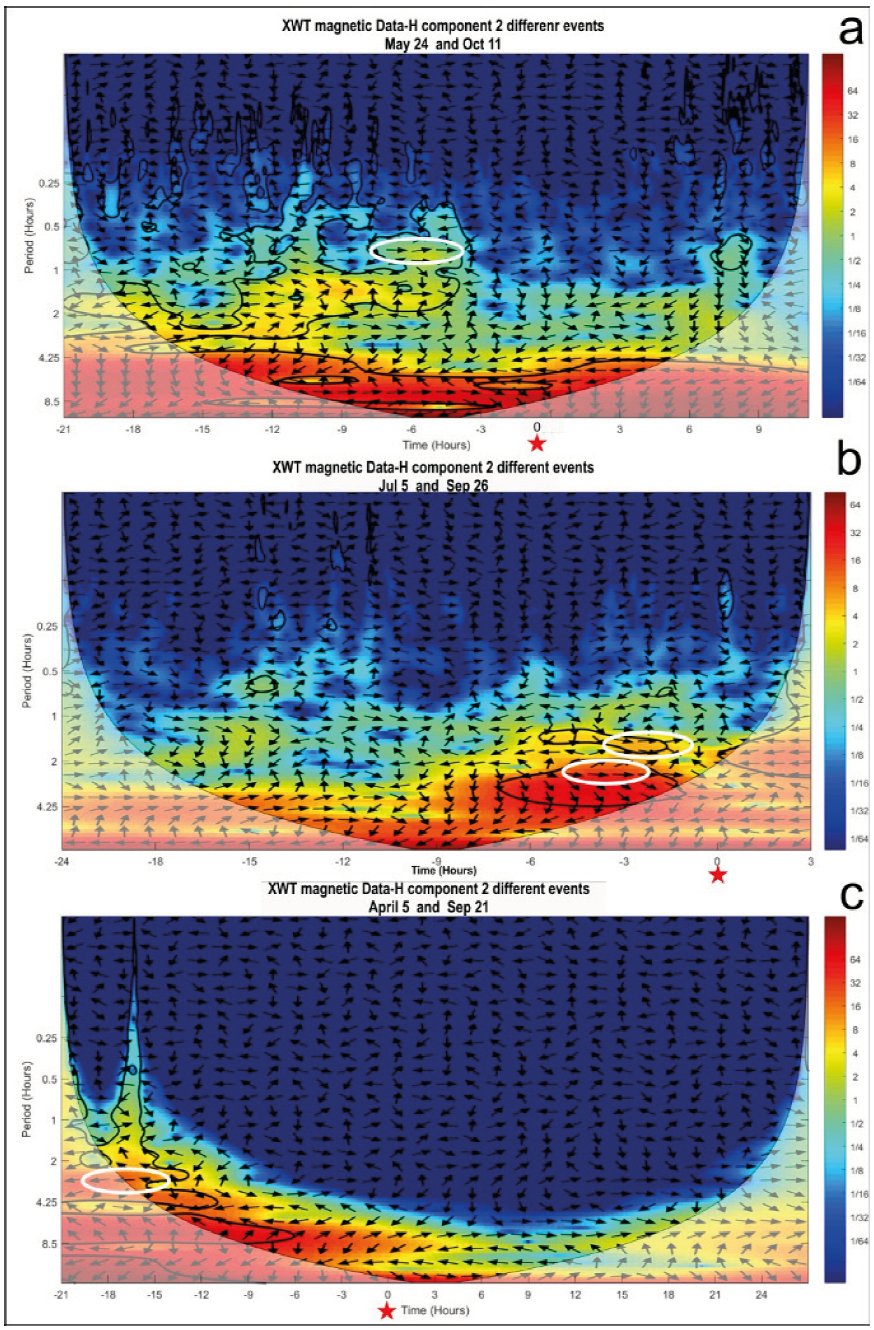
Figure 6 Geomagnetic field XWT from KEP observatory for the following events: a) 24 May and 11 October, 2018; b) 5 July and 26 September, 2018; and c) 21 September, 2018 and 5 April, 2019. Seismic event coincidence instant (red star) and coherent phase (white oval). The arrows show the relative phase (with the phase pointing to the right and the anti-phase pointing to the left).
We applied a measure of the coherence between both WTs, referred to as wavelet transform coherence (WTC), so as to find significant coherence. If both series are physically related, we should expect a consistent or slowly varying phase. Monte Carlo methods are used to assess the statistical significance against red noise backgrounds.
There are clearly common characteristics in the wavelet power of the paired series, showing on Figure 6a) and b) very good correlation in the interval between 6 and 4 hours before the occurrence of an earthquake corresponding to a period between 2 and 0.5 hours. For Figure 6c), the correlation is inverse and it occurs more than 15 hours earlier.
Conclusions
Potential magnetic precursors could be identified for events with a magnitude above 4.4 Mw.
In all the events, peaks between 1.5 and 4.4 nT were observed in the filtered variation around 3 hours before a seismic event, and a 7.58 nT peak corresponding to the earthquake closest to KEP observatory outstands. Their association with solar storms is ruled out as this is a solar minimum period.
The filtering operation to yield the filtered variation was effective, as the wavelet transform studies do not show periods for 24 hs, 12 hs or 6 hs.
When observing the wavelet transform both in the horizontal H and vertical Z components, high coherence was found around the corresponding 2 to 0.25 hour band, which increases over a period near the occurrence of a seismic event, but, as no filters were applied in this case, the diurnal and semi-diurnal components are those with highest energy.
The study of time correlation among seismic events, such as those on 24 May and 11 October, 2018; 5 July and 26 September, 2018; and 21 September, 2018 and 5 April, 2019, using an independent method based on the Cross Wavelet Transform (XWT) (Grinsted et al., 2004), showed that, in a period from 2 to 3 hours before an earthquake, there is high coherence between both analyses, which may be characterizing an alteration in the magnetic field due to seismic activity. This period increases to over 15 hours when the comparison involves a deeper and more intense earthquake, but farther away from the location where the magnetic field is recorded.
It would be inferred that there is a connection between geomagnetic variations and seismic events, nevertheless some signals show similar signatures as those highlighted and not associated to earthquakes.
Further evidence is needed for a better assessment of potential geomagnetic phenomena associated with earthquakes, which is why continuous monitoring is intended over a longer period, including more significant events making it probable to find possible correlations with seismic activity.

