


 nueva página del texto (beta)
 Inglés (pdf)
 Artículo en XML
 Referencias del artículo
 Enviar artículo por email
 Citado por SciELO
  Similares en
SciELO
Similares en
SciELO 
 Permalink
Introduction
Fruits belonging to the citrus genus were brought to the Americas by the Spanish and Portuguese since the very beginning of the colonial period; they introduced these fruits through the Antilles, Mexico, Florida and Brazil [1]. Nowadays, among the main citrus producing countries, Mexico is in the top five, only behind China, Brazil, United States and India [2]. Among the regions where the citrus production is plenty in Mexico, the state of Veracruz stands out as the most important producer of this kind of fruits [3]. This state contributes around two thirds of the national production of the Persian lime (Citrus latifolia), better known in Mexico as “limón sin semilla” (lemon without seeds). Fresh lime consumption is the common way to intake it. When we do this, our organism supplies with ascorbic acid, vitamin A, thiamin, riboflavin, niacin, pectin and minerals such as Fe, K, Ca, Na and P, nutrients that the citrus genus fruits are rich [4]. Being Persian lime a juicy fruit, its moisture content is around 90% inside its segments, evidently. Lime juice is also rich in flavonoids, mainly flavanones and flavones [5]. Instead, the lime rind is much less rich in water percentage than the juicy endocarp. The outermost layer of the rind is called flavedo due to its high containing in flavonoid compounds. In fact, the flavedo contain around 60 types, belonging mainly to the classes: flavones, flavanones, flavonols and flavans [6]. Essential oils are other components in this part of the lime rind, at least 62 types have been identified, where limonene is the major component, followed by γ-terpinene and/or β-pinene, and/or sabinene and so on [7]. By the way, in a recent work, it has been studied the citrus essential oils thermal properties using photothermal techniques [8].
In view of the fact that Persian lime has a great nutritional content, that is necessary to preserve during postharvest in order to ensure the best prices in market; therefore a change in the prevalent use of the empirical methods to get a good quality control in the Persian lime production is required by the Mexican farmers [3,9]. Thus, in this work, we will focus into characterize Persian lime samples by means of PAS. Using this technique, we have shown recently, that the nutrimental content in fruits can be monitored as a fruit ripens or dehydrates by means its optical absorption spectrum [10]. In the present research, by using PAS, it was obtained both the optical absorption spectra of the juice and the flavedo. Also by using another photoacoustic configuration we have measured the water vapor permeability of the albedo.
Experimental details
The samples were taken from a packing house so that all the fruits come from orchards located around the municipality of Cuitlahuac, at the Veracruz state, Mexico. In agreement to the Mexican quality standards, Persian limes were divided into four categories (see Figure 1): the highest quality Persian lime, the so-called “limón extra” (Sample HQ); the second-class Persian lime, “limón de segunda” (Sample SC); the third-class Persian lime, “limón de tercera” (Sample TC); and waste-class, “desechos” (Sample WA). In Figure 2 we show microscope images taken in an optical microscope Motic®, BA310 model. Our pictures have an image magnification 40x, so they do not show too many details about the flavedo, but there are remarkable differences in color and texture between each sample and a more detailed discussion of these microscopic images is given in the Results and Discussion section.
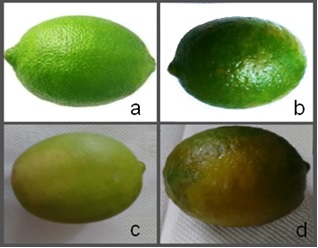
Figure 1 Persian Lime samples showing four different kinds of quality. (a) Sample HQ, (b) Sample SC, (c) Sample TC, (d) Sample WA.
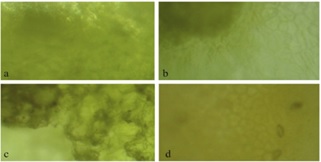
Figure 2 Persian Lime samples micrographs of the four different kinds of quality. (a) Sample HQ, (b) Sample SC, (c) Sample TC, (d) Sample WA.
Persian lime’s optical absorption spectra were obtained with a homemade photoacoustic spectrometer. In this spectrometer the light beam, from a 1000 W Xenon lamp, was focused into a monochromator in order to obtain a monochromatic beam which was modulated, by using a mechanical chopper at fixed frequency of 17 Hz, and then focused into an optical fiber in order to guide this beam to the photoacoustic (PA) cell, through a transparent window. The PA cell was built from a solid brass block equipped with an electret microphone. The output from the microphone was amplified by a two-phase lock-in amplifier, which was interfaced with a PC to record the PA signal amplitude and phase, as a function of the beam wavelength. The PA signal was obtained in the wavelength range from 300 nm to 800 nm. Graphite powder was used to normalize the photoacoustic signal, in order to take into account the emission spectrum of the Xe lamp. More details about the experimental setup are in a recent work [10].
The photoacoustic (PA) technique, in another configuration was used to obtain the water vapor diffusion (WVD) coefficient in the lime rinds (albedo). In the PA experimental setup, see also reference [10], a light beam from a 250 W tungsten lamp was mechanically modulated and focused on a cylindrical PA cell with a quartz window at one end. A piece of aluminum foil (12 μm thick) was painted black and attached to the inside of the quartz window to absorb the incident light beam. The opposite end of the PA cell was covered by the sample under study. In this way, thermal waves were used to detect pressure variations occurring in the PA cell. The outside of the sample was exposed to a PVC recipient containing distilled water providing a constant RH (100%). An electret microphone coupled to the PA cell through a narrow column sensed the pressure fluctuations generated in the PA chamber, due to periodic heating caused by the absorption of the incident light beam in the aluminum foil. The output voltage from the microphone was connected to a lock-in amplifier and finally the PA signal was displayed in a PC as a function of time. The measurements were performed at 24 Hz of light modulation frequency. The basic principle of the photothermal detector of water vapor permeability was reflected by this result. When the reservoir contained a solution at 100% RH, water vapor molecules diffused through the albedo towards the PA chamber. Accordingly, the molar concentration in the transducer gas was increased proportionally to the amount of diffused water vapor and consequently there is an increase in the pressure fluctuations in the PA cell resulted from the modulated heating of the gas, caused by the periodic diffusion of heat generated in the aluminum foil.
Results and discussion
Our samples are clearly different at first sight (see Figure 1). The HQ sample shows a beautiful green color, which is supported by the color uniformity observed in the microscopic image. At first sight, SC and TC samples are less uniform in color than HQ sample. In fact, SC sample begins to show certain degree of ripeness, but the TC sample shows a higher degree of ripeness due to its yellowish color. Microscopic images (see Figure 2) of SC and TC samples clearly show dark regions likely due to irreversible changes on this part of the fruit, in higher degree in TC sample than SC sample. The rind of the WA sample shows a real damage in aspect and its microscopic image has lost totally the original green color shown in the first three samples. However, it is not clear if the juice still could be good or not for human consume until.
The optical absorption spectrum of the flavedo for each one of the samples is shown in Figure 3. First, it can be seen an UV optical absorption region because as we already said before, the flavedo’s composition is rich in flavonoids.
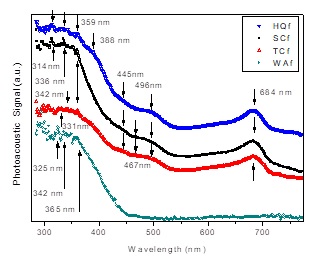
Figure 3 Optical absorption spectra obtained by PAS on the Persian lime flavedo of all samples under study. We have used the subscript f to remark we refer to this layer of the rind.
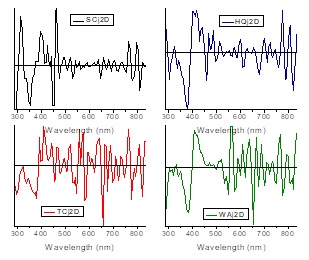
Literature reports that UV spectra of flavanones in Citrus species show a maximum absorption peak in the range 280 -290 nm, while flavones show the highest absorbance peak in the range 304-350 and flavonols do the same between 352 -385 nm [5,11]. Unfortunately, we cannot do any discussion about flavanone maximum peaks (band II) in our spectra due to these are localized in the lower limit of our measuring range. Nevertheless, the band located at 336 nm in our spectra of HQ and SC samples could be associated to the band I of neohesperidin [11]. However, hesperidin band I (330 nm) could be convolved inside the neohesperidin band, which has been determined doing the second derivative on the HQf spectrum, see HQf2D spectrum in Figure 4, where the maximum values of the bands are represented by the minimum of the inverted peaks [12]. With respect to the absorption band in flavones, mainly diosmin has been found in lime flavedo [11], which has a wide band centered at 350 nm [5], so we may say this band could be associated to the peak at 359 nm shown in HQ, SC and TC samples. Due to in lime we did not found reports about absorption peaks in connection with flavonols [11], the shoulder centered at 388 nm in HQ sample could correspond to flavonoid glycosides [5]. The flavonoid degradation process is already obvious in the TC sample, which is a band less intense with respect to the band corresponding to the chlorophyll band at 684 nm present in HQ, SC and TC samples. In the waste-class sample the flavonoid band is the only one that still remains, but this wide band is quite noisy. Thus, the bands located at 325 and 342 nm shown in the WAf spectra and in the second derivative spectrum WAf2D have not enough reliability. Likely, the only reliable band in WAf spectra is that located at 365 nm, which could correspond to quercetin [5,10]. If we take a second look at the flavonoid band, we should remember that essential oils have absorption bands inside the same interval of flavonoids. It has been reported a strong absorption to induce photolysis in lemon oil with UV irradiation at 314 nm, a wide band in the range 300 - 350 nm corresponding to the lemon oil decays in a matter of minutes [13]. This band at 314 nm is quite clear in HQ and SC samples, but not for the rest of the samples.
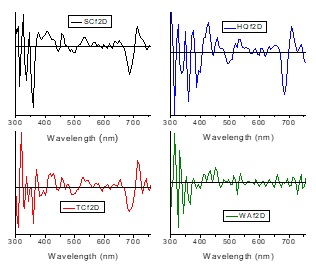
About the spectra interval from 400 nm to 500 nm, it has been reported a poor content of the carotenoid compounds in lime, as much in rind as in juice, being both contents correlated. However the band located at 445 nm in HQ, SC and TC samples could correspond to β-carotene and zeaxanthin due to they are the carotenoid compounds found in higher percentage in C. latifolia [14]. This hypothesis is reinforced due to there is a band at 467 nm in SC and TC samples, as well as the band centered at 496 nm in HQ, SC and TC samples [15]. We have already mentioned the presence of the chlorophyll-a band at 684 nm; which perfectly match with data reported in vivo [15]. There are also bands equally present in HQ sample that surely correspond to chlorophyll-a: 599 and 622 nm [10,15]. The same occurs for the SC and TC samples that show bands at 593 and 628 nm; 593 and 622 nm; respectively, see Figure 4. Returning to the band at 445 nm, this band surely is convolved with the chlorophyll-a highest peak. The TC sample has a great PA signal decrement with respect to the HQ and SC samples, so as we said before, the TC sample has predominantly a yellowish color very likely related to the flavonoid and essential oil degradation combined with a relatively long life of chlorophylls shown in the spectra [10,16]. Finally, in the case of the “waste-class” sample, the chlorophyll bands do not appear due to the degradation of this pigment is evident. The last, corroborate the color change on the rind into brown as a signal of decomposition.
The optical absorption spectrum of the lime juice for each one of the samples is shown in Figure 5. Due to lime juice is quasi-transparent, the absorption spectra was obtained doing light transmission inside the PA cell. These spectra are smoother to the obtained for the flavedo at least in the flavonoid’s band interval, however the spectrum shape not suffers smooth changes between the HQ sample compared to the other samples, it seems the all bands suffer spectacular changes not easy to describe, being TC and WA juice spectra more alike between them. We should remark that in the juice spectra, we do not observe a degradation of the pigments as well occurred in rind’s spectra, they are showing several chemical transformations in the pigments instead. As we can see in Figure 5, the peaks of the bands of flavonoids not present the same regularity shown in flavedo’s spectra, this band shows simultaneously an increasing in the PA signal as the sample ripens. Obviously, this part of the PA signal begins to decay in WAj spectrum but still far from being at the level of the WAf spectrum. Figure 6 shows the second derivative treatment to the juice spectra. With the exception of WAj spectrum, we can see in Figure 5 that the carotenoid compounds are also present in juice spectra as occurred in the flavedo’s analysis. A carotenoid band around 530-536 nm that is more evident in TCj and WAj spectra, give us the idea that this could imply revisit the studies about not reported carotenoids in Persian lime as capsorubin: 488, 523 nm; capsanthin: 483, 518 nm; which is a similar phenomenon occurred during ripening of chilli pepper [10,14]. The bands located at 679 nm for the HQ sample; and 648 nm for the SC sample show that chlorophylls are likely present in juice, but this is reinforced in samples TC and WA.
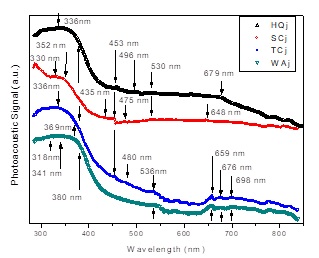
Figure 5 Optical absorption spectra obtained by PAS on the Persian lime juice of all samples under study, where the subscript j it has been used to refer to this colloidal suspension.
Table 1 Experimental parameters measured from the permeability of the albedo.
| Sample | Experimental parameter | ||
| Thickness (mm) | Characteristic diffusion time (s) | Water vapor diffusion coefficient (10 -7 cm2/s) | |
| HQ | 140 ± 0.04 | 855 ± 53 | 1.15 ± 0.10 |
| SC | 185 ± 0.04 | 1886 ± 31 | 0.91 ± 0.04 |
| TC | 143 ± 0.04 | 1593 ± 05 | 0.63 ± 0.04 |
| WA | 127 ± 04 | 590 ± 09 | 1.17 ± 0.08 |
With respect to the WVD measurements, we found a slow linear decreasing in the WVD coefficient as the fruit ripens, however the WA sample has totally the same WVD coefficient value as the HQ sample. Thus, we may say that this parameter remains almost constant in average. From this point of view, we may say the albedo is a very strong protective barrier, a last shell against external agents even so when the flavedo be seriously damaged. Our results agree partially with literature, that states in albedo occur changes that becomes softer and easy to separate from the segments [4]. This could be true about texture changes but partially true with respect to the permeability, which remains impermeable until before the fruit loss the good taste.
Conclusions
Four samples of Persian lime graded in agreement to the Mexican quality standards were characterized using PAS. Absorption spectra taken on the flavedo showed slightly differences between HQ and SC samples, excepting in the broadband of flavonoid compounds that becomes less wide in the SC sample, surely due to degradation of some flavonoid compounds. TC sample shows a yellowing at first sight, which is in connection with the high degree of flavonoid degradation and essential oils, but remaining the chlorophyll bands. A complete disappearing of the chlorophyll bands occurs only when the flavedo is quite degraded (WA sample), no matter if the albedo has not varied significantly its WVD coefficient. About the juice lime spectra, we found out an interesting evolution from HQ until the WA samples, that maybe requires other studies beyond our research. Our results show that the PAS technique should be taken into account as the internal grading system technologies for agricultural products.

