nueva página del texto (beta)
 Inglés (pdf)
 Artículo en XML
 Referencias del artículo
 Enviar artículo por email
 Citado por SciELO
  Similares en
SciELO
Similares en
SciELO 
 Permalink
Introduction
The primary objective of MFIs is to alleviate poverty through a combination of small loans and other financial services, such as savings accounts, training, health services, networking, and peer support. This objective is what distinguishes MFIs from traditional banks (Microcredit Summit Campaign, 2017). To this end, initially, donors mainly funded MFIs and governments, with below-market granted rates, which were meant to reach the base of the pyramid (BOP) customers. At that time, given the fact that their main revenue was generated through donations and subsidies, cost control was not a significant concern (Louis, Seret, & Baesens, 2015). However, during the 90´s, many donors began to worry about the continuous subsidies given to MFIs. This began a trend of only supporting new MFIs and not sustaining existing ones during their operational life (Morduch, 1999). This decision placed a concern on MFI managers to reach sustainability. At the same time, the environment in which MFIs operated became very competitive, which forced them to improve management (Pinz and Helmig, 2014).
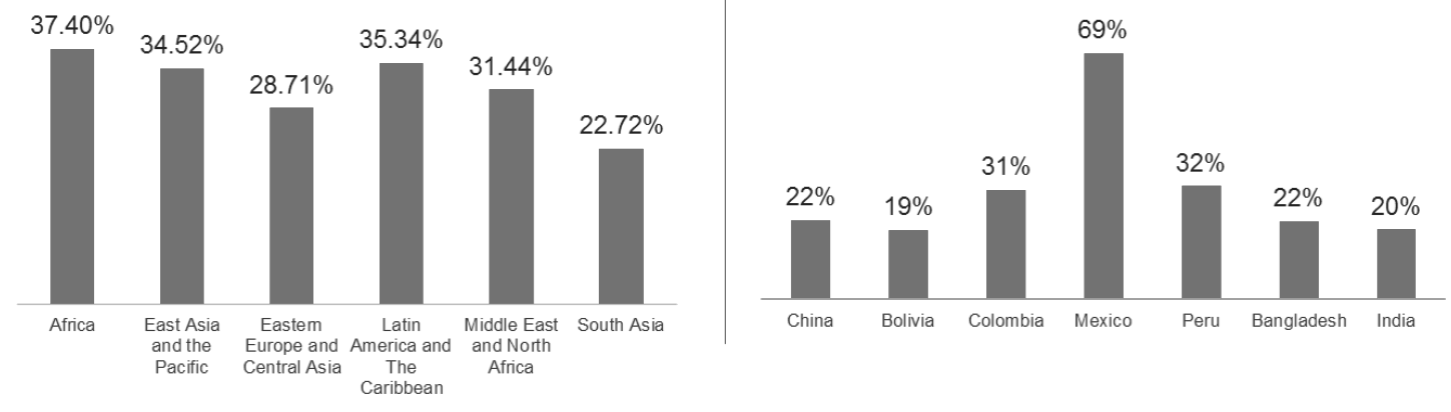
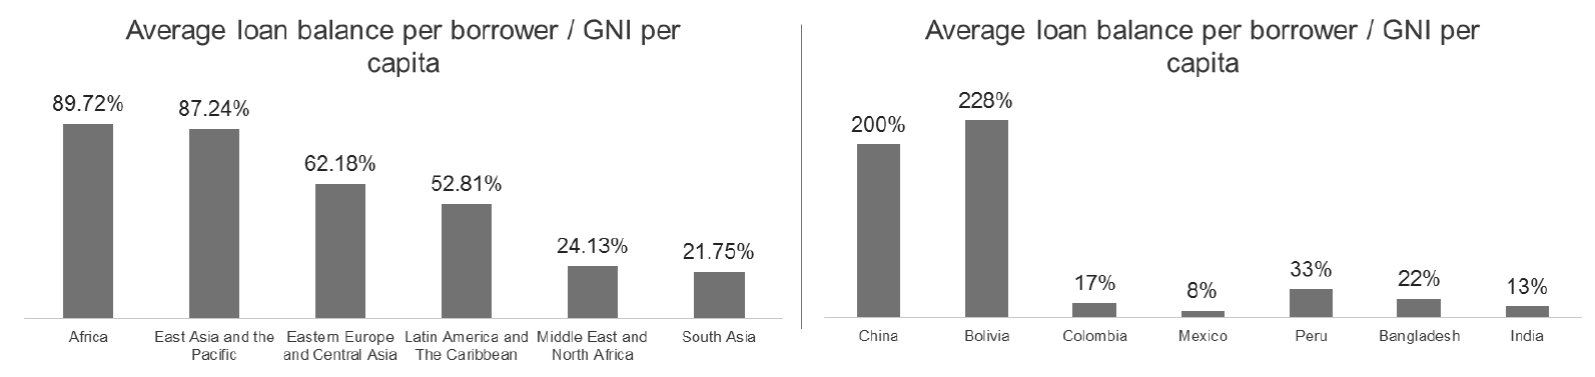
This push for sustainability, among other factors, was the beginning of what we know as mission drift. In particular, MFIs started increasing margins and maximizing profit by charging higher interest rates to the poorest customers, effect known as “poverty penalty” (Cuellar-Fernandez, Fuertes-Callén, Serrano-Cinca & Gutiérrez-Nieto, 2016; and Prahalad and Hammond, 2002). As an example of the poverty penalty, in Appendix 1 we show the interest rate proxy of average nominal yield on the gross loan portfolio, by region and country, from which we can see, for example, that in 2015 some MFIs, in Mexico, charged interest rates of up to 103 %. These MFIs argue that because loans are small in the region, they incur higher costs to serve such a small segment of the population and that this is the primary cause of high-interest rates (see appendix 2); besides Ramírez, Cruz and Venegas (2015) found that, particularly in Mexico, a more competitive environment caused an increase in operating costs and this was reflected in interest rates since MFIs, especially the small ones, were not able to achieve economies of scale.
Likewise, Dorfleitner et al (2013) suggest that the high interest rates charged by MFIs are triggered by high staff and operating costs and Mosley and Hulme (1998) found that those MFIs that set interest rates relatively higher are more likely to survive in a competitive market, mainly because high-interest rates tend to deter borrowers with projects with lower rates of return. In particular, Bruton, Khavul & Chavez (2011) found that developed countries charge lower interest rates than those in developing economies. At this regard, Ramírez, Bernal and Cervantes (2019) argue that because reaching poor IMF customers is expensive, they transfer this cost to the interest rate through operating expense. However, Mazumder and Lu (2015), reinforce mission drift theory with their study of a sample of the rural population in Bangladesh, which found that the interest rate for microcredits was the most crucial factor for improving the borrowers’ quality of life.
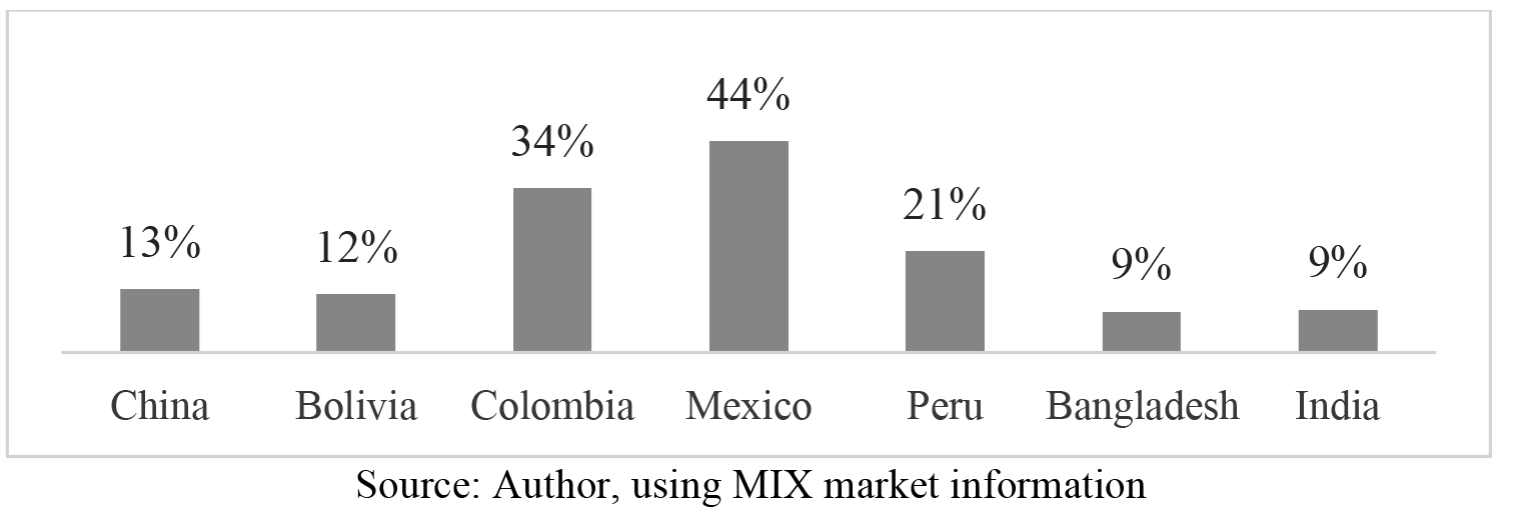
According to Cuellar-Fernandez et al. (2016) and Prahalad et al. (2002), operating expenses drive interest rates; consequently, the MFI´s objective should be to reduce margins and lower interest rates to make them more accessible to the BOP borrowers. They also suggest that operating expenses should be addressed in order to reduce interest rates. Thus, the cost per borrower (measured as a percentage of the average loan per borrower) reaches 44% in some countries, while in other more developed countries, the cost per borrower accounts for only 9% (see Appendix 3).
Given the importance of interest rates on the financial performance of MFIs, and how interest rates can be a consequence of mission drift, in this study, we analyze the effect of interest rates and operating expense on financial performance. The difference between this study and previous studies of the relationship between interest rates and financial performance is that while those studies analyze a direct relationship between these two variables, our study analyzes the indirect effect. Other studies have found that financial performance is the result of many different factors that interact both inside and outside MFIs (Gutierrez-Nieto, Serrano & Molinero, 2009). In addition, Ledgerwood (1999) states that financial performance is a combination of profitability and portfolio quality, which depends on a combination of factors such as productivity, leverage and the external environment. We hypothesize that some of these factors have first an effect on interest rates, and then on financial performance.
Based on Qian and Strahan (2007), who showed that the lowest interest rates were found in countries with better investors and creditor protection rights, we analyze interactions between external environment factors and financial performance, with interest rates as a mediator variable. Also, based on Tchakoute-Tchuigoua (2014), who found that the institutional environment (corruption index, creditor rights index, financial sector development, and economic growth of the country capital structure) plays an essential role as an external factor which impacts financial performance, we analyze the effect of the external environment on financial performance through interest rate as a mediator variable. Finally, and based on previous studies, we analyze interest rates as a mediator variable between financial performance and the MFI´s internal factors, like operational costs (Arnone et al, 2012; Tchakoute-Tchuigoua, 2010), MFI size (Cull, Demirgüç-kunt & Morduch 2011; Bogan, 2012) and MFI age (Hermes, Lensink & Meesters, 2011; Cull, Demirgüç-kunt & Morduch, 2014).
To that end, we use Structural Equation Modeling (SEM) to test whether capital structure, environment (corruption, the rule of law and government inefficiency), operating efficiency and MFI size have an indirect effect on financial performance (measured as ROE, ROA and OSS), with interest rate as the mediator channel or variable. According to Gunzler, Chen, Wu & Zhang (2013), SEM is the most appropriate way to test complex multilevel mediation models, mainly due to the necessity of testing the dual role of the mediator variable, which acts as both cause and effect. Therefore, we believe that this paper contributes to the literature on MFIs in the following way: i) we use a methodology, SEM, that allows us to show not only direct but indirect effects, and also to measure reciprocal effects; ii) we built several measures of the dependent and independent variables (constructs) by using more than one variable and taking into account the literature on MFIs. The paper is structured as follows: first, we present the methodology, then we present results, and last we offer some conclusions.
Data and methodology
The information used to test our hypothesis was obtained from the MIX Market Intelligence database, for 2015, which gives information from 545 MFIs from around the world (see Appendix 4). In addition, to test whether the size of the sample is sufficient to run the analysis, we use the Suhr (2006) criteria, which states that the sample should be at least five times the number of independent variables employed; which is met in our sample. In Appendix 5, we define the variables we use for our analysis.
According to Preacher and Hayes (2008), testing multiple mediator variables at once has the advantage to measure the effect of an independent over a dependent variable, conditioned on the presence of the multiple mediator variables. These contribute to reducing the parameters bias due to omitted variables and helps to compare the different magnitudes of the effects of mediator variables. In this regard, in figure 1 we show a simple version of a mediation model, which relates the total effect of an independent variable (environment) on a dependent variable (financial performance).
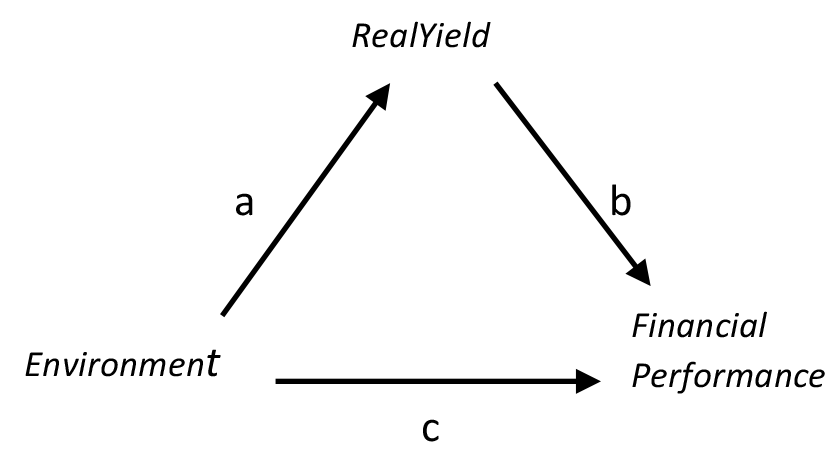
Following the notation in Iacobucci, Saldanha and Deng (2017), in this work the mediator diagram of Figure 1 is modeled as the sum of the direct (c) plus the indirect effect (ab), like in the following equations:
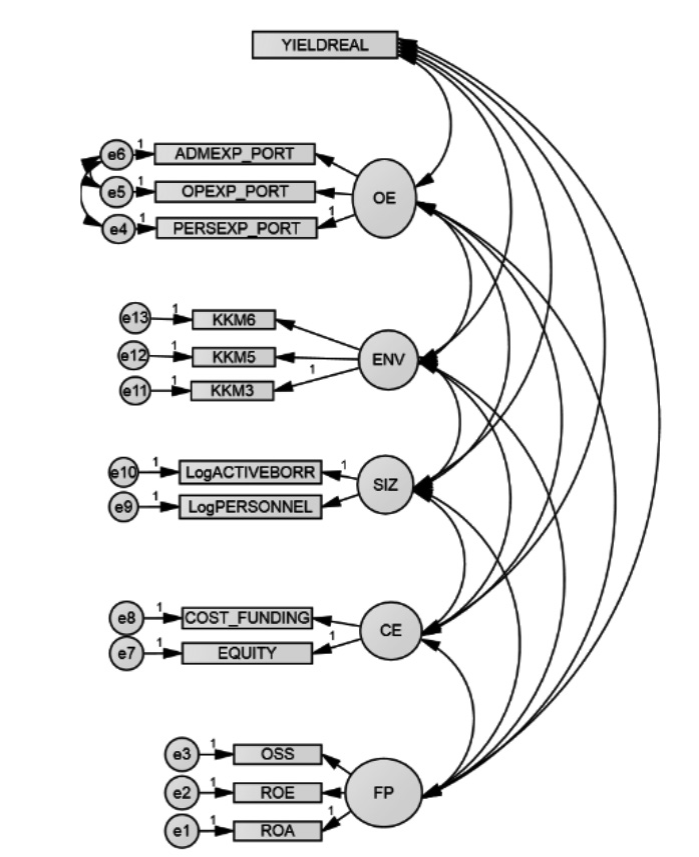
Where the betas are the intercepts, are the error term, and a, b and c are regression coefficients. However, modeling the equations of this kind of models gets complicated when we add latent constructs and multiple mediator variables because we have to test the different possible combinations within and between all variables. Besides, in our model, we have to deal with latent variables and with double mediation, which creates a complex equation system. Then, in this work, which is usually in SEM, we state a diagram like in Figure 2, together with a simplified model with latent variables only.
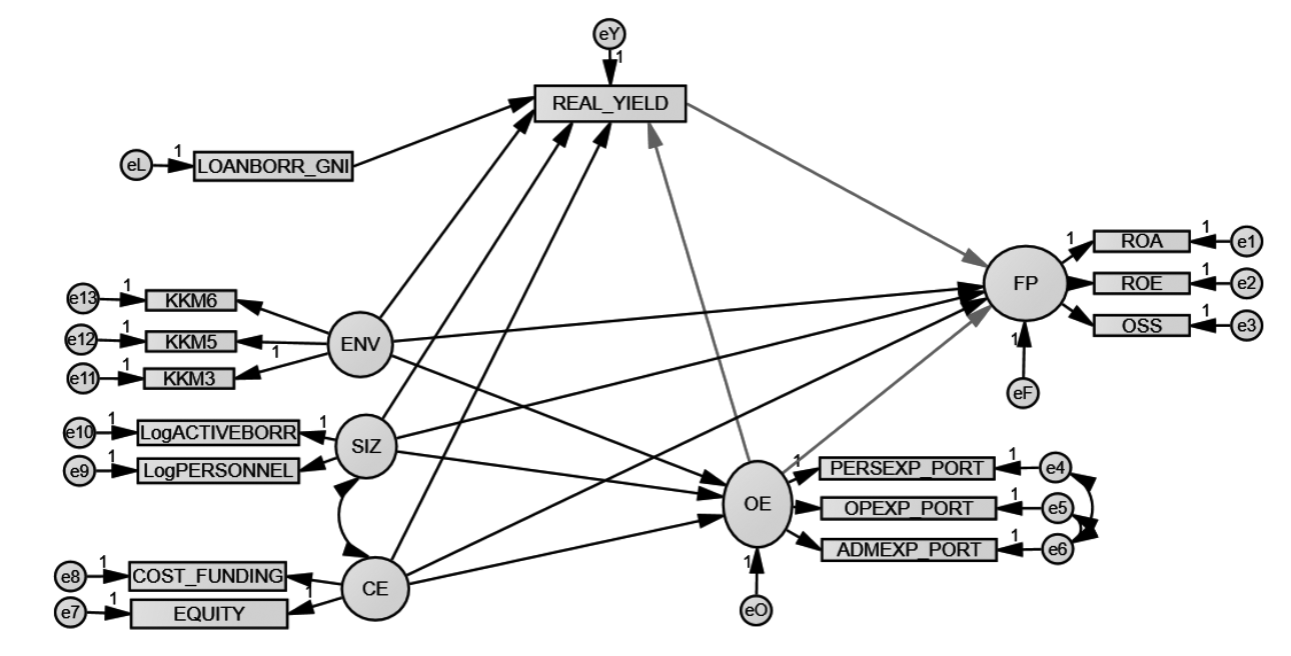
Where the variables in squares are explained in Appendix 5, and variables in circles are the following latent variables: environment (ENV), size of the MFI (SIZ), Capital structure (CE), operating expense (OE) and financial performance (FP). In a double mediation scheme, the following equations will converge into many different combinations of all the independent variables relationships. The main equations of the model, using only latent variables, are the following:
And the combined structural equation would look like this:
In the factor analysis presented in the next section, we explain how the latent variables are constructed; for example, how we construct capital structure CE using the variables cost of funding and equity, etc.
To solve this model, in this work we use structural equations modeling, using the causal steps strategy proposed by Baron and Kenny (1986) and checking robustness with a bootstrapping technique. What we attempt to prove is whether the mediation effects exist and if they are significant for the MFIs´ financial performance.
To test the model proposed in Figure 2, first, we must perform a confirmatory factor analysis to verify the validity of the constructs and then to evaluate the model using a double mediation technique with SEM. At this regard, SEM is the most recommended method for mediation analysis, because it allows separating the measurement errors of the mediator and dependent variables. Besides, it allows obtaining a more reliable measure of the systematic relationships between the mediator and the dependent variable. Finally, it allows flexibility to estimate and compare different models using sophisticated goodness-of-fit statistics (Danner, Hagemann and Fiedler, 2015).
Confirmatory factor analysis
Usually, to measure economic or social phenomena that are not observable, the econometric analysis uses what is referred to as proxy variables to approximate these values. In SEM, phenomena that cannot be measured directly, but are indicated or inferred by other observable variables, are referred to as latent constructs. In this work, to build the constructs, we use the methodology of latent variables proposed by Jarvis, Mackenzie, and Podsakoff (2003). These authors state three conditions for the constructs to be valid: i) indicators must be a real reflection of measure of the construct; ii) variables of each construct must be consistent with the construct (we use the Cronbach alpha to verify the concordance of each construct), and iii) covariance between variables and constructs must to be significant (Aldás-Manzano, Lassala-Navarré, Ruíz-Mafé, y Sanz-Blas, 2011).
The constructs we built are: i) profitability, which is comprised of variables ROE, ROA and OSS. This mix was proposed by Gutiérrez-Goiria and Unceta in 2015; ii) environment, which has been included because, according to Cull et al. (2011), both the regulatory environment and institutional development have an important impact on MFIs. As variables of this measure, we use the KKM indicators (Kaufmann, Kraay, and Mastruzzi, 2007) which include control of corruption, rule of law and government effectiveness; iii) capital structure, which includes equity and interest expenses. Although it is common practice to use the debt to equity ratio, Pati (2015) justifies the use of these indicators as capital structure measures, as they include interest expenses and equity book value; iv) size, which is comprised of employed staff and active borrowers. These variables were used by Cull et al. (2011), while Pati (2015) uses these variables as indicators of outreach; v) operating efficiency, which is made up of operating expenses, personal expenses and administrative expenses as a proportion of the credit portfolio. Finally, we included the real yield on gross loan portfolio as a proxy of the interest rate the MFI charges; this same approach was used by Cull, Demirgüç-kunt & Morduch (2007) and Bos and Millone (2015) among others who studied the relationship between operating expenses and interest rates. In order to verify the construction of the latent variables, we run the confirmatory factor analysis (CFA). To that end, we use the methodology proposed by Jarvis et al. (2003).
A generalization for the factor analysis mathematical model is the following: using the notation proposed by Yong and Pearce (2013), if p is the number of variables represented in a latent factor, and if m is the number of underlying factors (, the mathematical model is:
Where j=1,2,…, p. Also, a j1 is the factor loading of the jth variable on the first factor, and is the specific factor. In our work, in the first column of Table 1, we show the underlying factors and in the first row the latent factors. For example, for the financial performance variable we propose the following equation:
Financial performance=
Results of the exploratory factor analysis are shown in Table 1.
Table 1 Exploratory Factor Analysis
| Items | Financial Performance | Environment | Capital Structure | Size | Operating Expenses | Interest Rates |
| ROA | .944 | |||||
| OSS | .886 | |||||
| ROE | .849 | |||||
| KKM5 | .939 | |||||
| KKM6 | .901 | |||||
| KKM3 | .878 | |||||
| COST_FUNDING | .917 | |||||
| EQUITY | .912 | |||||
| LogACTIVEBORR | .931 | |||||
| LogPERSONNEL | .927 | |||||
| OPEXP_PORT | .971 | |||||
| PERSEXP_PORT | .909 | |||||
| ADMEXP_PORT | .883 | |||||
| REAL_YIELD | .964 | |||||
| Cronbach´s Alpha | .739 | .890 | .705 | .949 | .885 | |
| KMO | .704 | .703 | .500 | .500 | .476 | |
| Bartlett´s chi-square | 1029.919*** | 1058.583*** | 718.542*** | 951.178*** | 2371.754*** | |
| % of explained variance | 82.43% | 82.90% | 92.84% | 95.46% | 88.77% | |
| COMPLETE MODEL KMO | .621 | |||||
| Bartlett´s chi-square | 6922.075*** | |||||
| % of accumulated explained variance | 89.31% | |||||
| Factor´s share of explained variance | 19.24% | 17.98% | 17.83% | 13.75% | 13.38% | 7.12% |
| *** p < 0.01 |
Note: numbers in italics indicate factorial loads of each variable in the factor
Source: Author´s own
In Table 1, we show the factors loading; for example, for the financial performance, the factors loading of ROA, OSS AND ROE are 0.944, 0.886 and 0.849, respectively. However, the most critical result of Table 1 is the consistency of the model, which is proved using Cronbach´s alphas and Kaiser-Meyer-Olin (KMO) tests, according to Nunnally´s (1978) methodology. In this case, the results were positive for all factors, which indicates that a significant proportion of the variance is captured in each construct so, we can create the measurement model and verified its validity (see appendix 6).
Following Lei and Wu (2007), the next step of the methodology is validate the model. At this regard, we use the normed fit index (NFI) and comparative fit index (CFI). Results are show in Table 2. In both cases, we obtained values above 0.90, which indicates that the measurement model is valid. It is important to note that although Hu and Bentler (1995) recommended testing using chi-square (which should be not significant) and its quotient divided by the degrees of freedom (which should be below 2), Lei and Wu (2007) responded by pointing out that these two methods may give false validity results if the sample size turns out to be large.
Table 2 Goodness of fit, financial performance
| Ítems | AVE | CR |
| Financial performance | .745 | .897 |
| Capital structure | .857 | .923 |
| Size | .949 | .973 |
| Environment | .752 | .900 |
| Operating efficiency | .869 | .952 |
| Chi square (CMIN) | 403.696*** | |
| CMIN / DF | 6.618 | |
| CFI | .955 | |
| GFI | .906 | |
| NFI | .947 | |
| RMSEA | .102 | |
| *** p < 0.01 |
Source: Author´s own
In addition, in Table 2 we show the goodness of fit test (GFI), as suggested by Joreskog (2004), and the RMSEA according to Steiger and Lind (1980). The former must be over 0.9 and the latter over 0.8. Our model fits with the GFI, but not with the RMSEA. Feinian, Curran and Bollen (2008) conclude that using a single goodness-of-fit measure of a model is not appropriate and other supporting goodness-of-fit measures must be provided. In conclusion, our model seems to have an adequate goodness-of-fit.
To verify convergent and discriminant validity, we use Orozco-Gomez’s (2016) methodology. This test requires extracting the average variance (AVE) of each variable in the constructs. As shown in Table 3, the results confirm that our model has convergent and discriminant validity.
Table 3 Discriminant validity
| FP | CE | SIZ | OE | ENV | |
| Financial performance (FP) | 0.745 | ||||
| Capital structure (CE) | 0.003 | 0.857 | |||
| Size (SIZ) | 0.004 | 0.218 | 0.949 | ||
| Environment (ENV) | 0.088 | 0.048 | 0.000 | 0.752 | |
| Operating expenses (OE) | 0.005 | 0.001 | 0.019 | 0.000 | 0.869 |
Source: Author´s own
Finally, we wanted to include one variable that could reflect the outreach as a part of the equation and to test its effect on the financial performance of the MFIs. Average loan balance per borrower expressed as a percentage of GNI per capita has been used in many studies as an indicator of the depth of outreach of MFIs (Vanroose and D´Espallier, 2013) under the assumption that the smaller the loan is, the lower the population segment that is served. Cull et al. (2007 and 2009) and Nwachukwu (2014) have tested it´s effect as an independent variable that explains financial performance of the MFIs.
Mediation analysis in structural equation modeling
As was previously mentioned, the spirit of this study is to analyze if interest rates are a second level mediator variable for the environment, capital structure operating efficiency, size and financial performance. The purpose of this mediation analysis is to determine how or why interest rates and operating expenses affect financial performance. Although the answer may seem logical, the approach using SEM shows the extent of the effect of the mediation on the environment, size, and capital structure of the MFIs.
It is important to mention that in order to test multilevel mediation, it is suggested to obtain the direct effects of each variable on financial performance (Gunzler, et al. 2013). These authors suggest that the direct effect between the endogenous factors and the output is not significant until the mediator variable makes the total effect significant.
In order to verify the change in the coefficients and their significance, we use the multilevel mediation analysis, employing the causal steps procedure proposed by Preacher and Hayes (2008). The methodology consists of testing each of the factors against one mediator variable/ factor (OE and Real_Yield) at a time. In this work, OE and Real Yield will be mediator variables only of all relationships between independent and dependent variables are significant and if the direct effect of the constructs (ENV, SIZ, OE) had a significant change when OE and Real Yield entered simultaneously as predictors of the Financial Performance.
If the total effect, for example of the environment, over the financial performance is determined by the sum of the direct and the indirect effect. Regarding equations (4) to (7), the equation of total effect should look like this:
Where c´1 stands for the direct effect of the environment over the Financial Performance conditioned to the presence of two mediator variables (Real Yield and OE), a 2 b measures the indirect effect through the Real Yield path and f1 g measures the indirect effect through the OE path.
This logic continues for all the constructs and each of the paths should be tested in order to verify whether that each c´< c, then mediation can be confirmed.
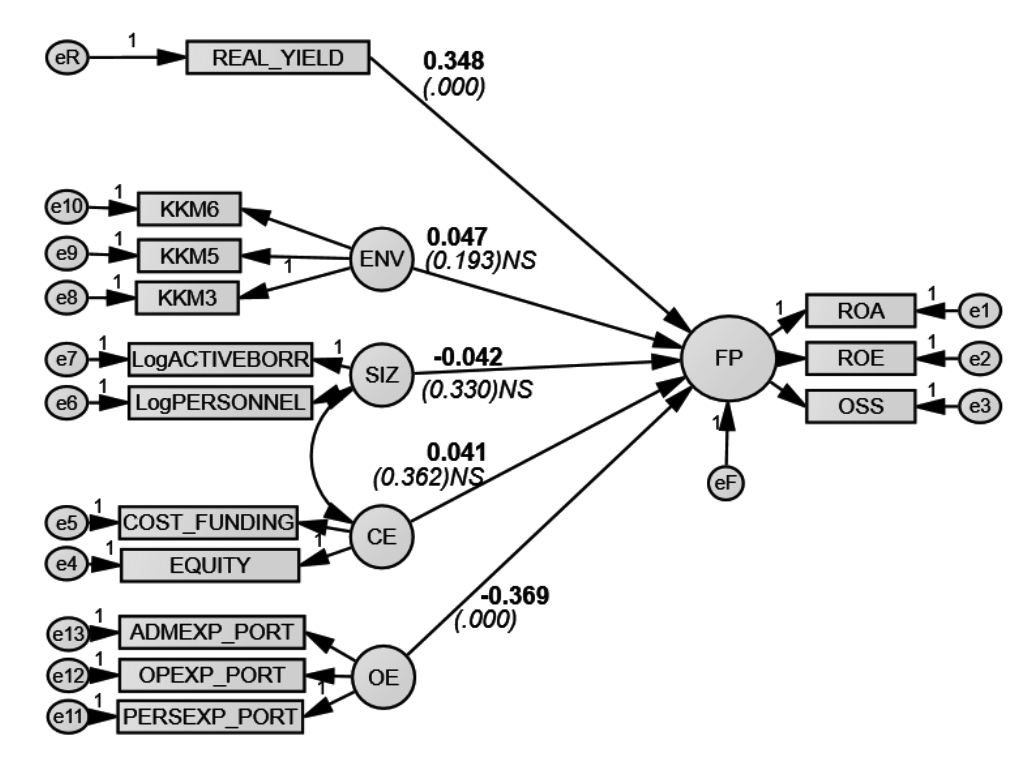
Results
When we tested the direct effects (see figure 5), we found that the only factors that are significant estimators of financial performance are operating expenses and real yield. The first finding is consistent with the results found by Ramírez, Cervantes y Bernal. (2019) and the second is consistent with the findings of Cull et al (2007, 2009 and 2014). In addition, this implies that our mediator variable, the interest rate proxy, affects the financial performance. However, this effect may be biased due to the lack of other factors such the environment, size, and capital structure of the MFI, which is why we do include them but as a cause of the mediator variables.
Other direct effects that are relevant for our analysis are the effect of environment, size, and capital structure on interest rates and yield. Those effects are reflected in Table 4, where we also present the effect on operating expenses:
Table 4 Direct effects of the exogeneus factor over mediator variables
| OP | REAL YIELD | |
| Environment | -0.014 (0.739)NS | -0.064 (0.009)*** |
| Size | -0.108 (0.005)*** | 0.065 (0.016)** |
| Capital Structure | -0.291 (0.000)*** | 0.019 (0.544)NS |
| Operating Expenses | 0.828 (0.000)*** | |
| Average loan per borrower / GNI per capita | -0.084 (0.000)*** |
NS: not significant
**: significant at 95%, *** 99%
Source: Author´s own
We also tested the mediation using bootstrap analysis with 200 subsample simulations and a confidence interval of 90%. According to Preacher and Hayes (2008), bootstrap analysis is superior because it is not affected by the symmetry and normalcy of the sample, nor by the restrictions of residual covariances, although in large samples the causal steps strategy is recommended. The results of both analyses are in Table 5.
Table 5 Mediation effect on financial performance
| Relations | Direct Effects | Relations | Total effect with mediation (Causal) | Indirect Effect (Bootstrap) | Result |
| ENV-FP | 0.047 (0.193)NS | ENV-REAL YIELD-FP | 0.104 (.004)*** 0.099 | -0.010 (0.012)** 0.003 | Full mediation |
| ENV-OE-FP | (.005)*** -0.082 | (0.025)** 0.006 | Full mediation | ||
| SIZ-FP | -0.042 (0.330)NS | SIZ-REAL YIELD-FP | -0.082 (.064)* | 0.006 (0.017)** | Full mediation |
| SIZ-OE-FP | -0.073 (.098)* | -0.001 (0.511)NS | Partial mediation | ||
| CE-FP | 0.041 (0.362)NS | CE-REAL YIELD-FP | 0.005 (0.910)NS | 0.000 (0.697)NS | No mediation |
| CE-OE-FP | 0.000 (0.994)NS | 0.064 (0.008)*** | Partial mediation | ||
| OE-FP | -0.369 (.000)*** | OE-REAL YIELD-FP | -1.125 (.000) | 0.437 (0.078)* | Partial mediation |
*** Significant at 99%, ** significant at 95%, *significant at 90%
Source: Author´s own
As we can see, both variables, OE and Real Yield, were proved to have a mediation effect between environment and size and the financial performance of MFIs, but not on the effect of capital structure over financial performance. Regarding operating expenses, these results are in line with those found in Ramírez, Bernal and Cervantes (2019a) with one mediator variable. However, when we incorporate the yield on gross loan portfolio, we find that the effect of the MFI´s environment and size on financial performance is also mediated through interest rates. This essentially allows us to confirm our initial hypothesis, which is that there is no direct relationship between environment and financial performance, nor between size and financial performance, however, these two factors seem to have an effect on operating expenses and interest rates, and both seem to determine the financial performance of MFIs.
In addition, there is a partial mediation effect between operating expenses and interest rates, which is consistent with the results found in literature stating that the main driver of interest rates are operating expenses (Dorfleitner et al, 2013; Cuéllar-Fernández et al, 2016). Finally, when we test the relation between the average loan balance per borrower, measured as a portion of GNI per capita, and the real yield on gross loan portfolio, we found that this relationship is significant at a 99% confidence level, and that outreach has a negative effect on the interest rate (-0.065).
Conclusions
Using SEM and multilevel mediation analysis we conclude that there is a significant mediation effect of interest rates and operating expenses over financial performance. In other words, interest rates and operating expenses are the vehicles through which environment, capital structure, and the size of the MFI affect the MFI´s financial performance. In particular, we found that the effect of the environment on the financial performance is mainly through interest rates, and secondly through operating expenses. This result implies that interest rates are affected by perceptions of government effectiveness, the application of the rule of law, and by the control of corruption, which indirectly affects the MFI´s financial performance. Thus, we can conclude that the better the environment in which an MFI works, the better the financial performance, and thus, the lower the interest rates will be.
For the effect of the size of the MFI on financial performance, we found that it is mostly captured by interest rates and the final effect of the size on financial performance is negative. Our results means that the bigger the MFI is the lower its financial performance, due to the size effect on interest rates and operating expenses. Meanwhile, we found that capital structure is not a relevant factor for financial performance, through the interaction neither with interest rates nor with operating expenses. However, this result may be biased due to the lack of other indicators that may more appropriately reflect the financial structure of MFIs. Unfortunately, the information provided by the MIX Market Database on the MFIs is incomplete in several cases.
Finally, we found that the effect of operating expenses on financial performance is also through interest rates. This is consistent with previous literature; whose primary conclusion is that interest rates tend to be higher due to the high operating costs, generated by small loans.